- Colombia: GDP growth misses expectations, but private consumption remains strong; BanRep’s Survey—Inflation expectations move up and now analysts expect only one 25 bps rate cut in 2025
COLOMBIA: GDP GROWTH MISSES EXPECTATIONS, BUT PRIVATE CONSUMPTION REMAINS STRONG
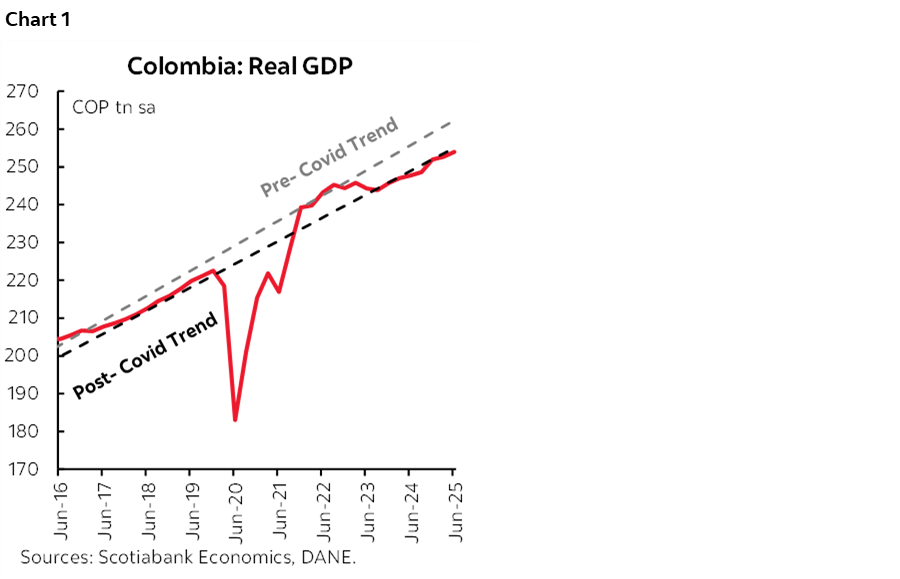
Data released by DANE on Friday, August 15th, showed that economic activity expanded by 2.1% y/y, below Scotiabank Colpatria’s forecast of 2.6% and below market consensus of 2.7% y/y. In seasonally adjusted terms, economic growth expanded by 0.5% q/q, slightly above the 0.3% expansion recorded in the first quarter of 2025. Both annual and quarterly figures suggest that Colombia is affirming an expansionary phase of its economic cycle (chart 1). This growth is being driven primarily by a strong rebound in the services sector—particularly commerce—and, from a demand-side perspective, by an increase in private consumption.
During Q2-2025, economic activity showed heterogeneous behaviour with a positive contribution from services, in line with the recomposition to more sustainable sources of growth. Positive contributions came from commerce, transport and hotels (+5.6% y/y), agriculture (+3.8% y/y), public administration, health and education (+1.8 % y/y), and leisure (+7.5% y/y). On the demand side, the main source of growth comes from the private consumption (+3.7% y/y) and the expansion of government consumption (+3.9% y/y) supported by the tax collection season. Regarding overall investment, gross capital formation expanded by 6.4% y/y, while fixed investment grew by 1.7% y/y.
It is worth noting that, as in Q1-2025, calendar effects influenced performance during Q2-2025. Easter, which was celebrated in April 2025, resulted in less working days in Q2-2025, creating a higher comparison base. These calendar effects were particularly disruptive in sectors such as agriculture and manufacturing, where growth appeared stronger than in the original (non-adjusted) series.
In the GDP reading from the supply side (sectors), economic activity results show a mixed picture, in which, commerce, agriculture, public services and leisure leverage growth, while mining and construction, which usually are representative of investment activity, partially dragged the result. In Q2-2025, digging deeper in the data, retail and wholesale commerce expanded 8.3% y/y, which was reflected in good dynamism especially on the retail sales front, where, according to our last Retail Sales and Manufacturing Output report, vehicles and telecommunication appliances sales explained the expansion in June 2025. The commerce sector led the growth, followed by transport and hotels, which expanded by 3.4% and 3.1% y/y, respectively.
Agriculture was the second-largest contributor to overall variation, driven by a greater supply of agricultural crops, but slightly offset by a sharp decline in coffee production (-15.8% y/y). Public administration ranked as the third main contributor, supported by retroactive wage payments in the public sector. In contrast, oil and mining (-10.2% y/y) and construction (-3.5% y/y) recorded a negative performance. Thus, the oil and mining sector decreased and remained in a negative trend for about six consecutive quarters. The main concern in this regard is the decline in crude oil and natural gas (-6.9% y/y), and coal production (-14.6% y/y), which has been reflected in a historical drop in traditional exports based on export performance to date. In the case of construction, this is the eighth consecutive quarter of contraction, this time, explained by low activity in the building sector.
From the demand point of view, the GDP expansion was driven by domestic demand (chart 2) with private consumption up 3.7% y/y and public spending up 3.9% y/y. Private consumption was led by higher spending on services and non-durable goods (+4.2% y/y); however, it is worth noting that durable goods recovery is taking place during a period of FX stability which contributed to more stable prices in imported goods. Public spending grew by 3.9% y/y amid the tax collection season.

Investment continues with a slower recovery, this time explained by the increase in inventories with 6.4% y/y growth in gross capital formation and a 1.7% y/y growth in gross fixed capital formation. Overall, investment continues below pre-pandemic levels, and the main lack is especially concentrated in the housing and building sectors, in which activity levels are 10% and 34% below the pre-pandemic benchmark of 2019. In the external sector, the real trade deficit widened, and exports contracted by 1.6% y/y, and a 9.7% y/y increase in imports (which combined the effect of better domestic demand and inventory accumulation). With this result, the trade deficit increased from 10.1% of GDP in Q2-2024 to 12.5% of GDP in Q2-2025.
Our take on Friday’s data is that the economic recovery continues to be driven by the traditional resilience in household consumption, rather than a rebound in investment. For now, we maintain our 2025 GDP forecast at 2.6% y/y. Although the data fell short of expectations, recent economic data have reinforced the central bank’s cautious stance. At its July 31st meeting, the Board surprised analysts by keeping the policy rate unchanged, contrary to expectations of a resumed easing cycle. In our view, economic activity remains solid, the output gap is still negative but is expected to close by 2026, and fiscal uncertainty continues to be a major concern for the Board. For these reasons, we do not anticipate any rate cuts at BanRep’s meetings for the remainder of the year, implying that the interest rate will likely remain at 9.25% through the end of 2025.
Highlights:
- On the supply side in Q2-2025, commerce (which include transport and hotels), agriculture, public services and leisure contributed the most to economic growth (charts 3 and 4). Commerce grew by 5.6% y/y (0.0% q/q SA) with a contribution of 1.1 ppts, followed by agriculture that registered an expansion of 3.8% y/y (1.5% q/q SA) with a contribution of 0.4 ppts, and public administration (which includes health and education services) with an expansion of 1.8% y/y (0.0% q/q SA) with a contribution of 0.3 ppts. Leisure increased by 7.5% y/y (-2.4% q/q SA), followed by services such as real estate (2.0% y/y and 0.6% q/q SA) and financial services (2.8% y/y and 0.8% q/q SA). Manufacturing maintained its positive trend with a boost of 0.9% y/y (1.0% q/q SA) mainly explained by an expansion of the apparel sector.
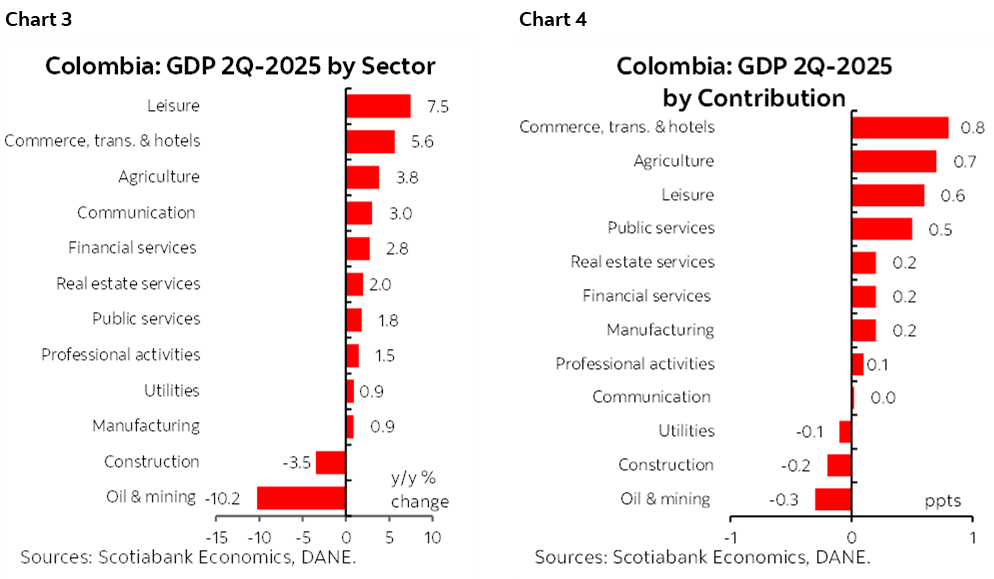
- On the negative side, oil and mining and construction were the ones that offset growth (charts 3 and 4 again). Mining industries dropped by -10.2% y/y (-5.1% q/q SA), subtracting -0.5 ppts of the total result, remaining in negative trend for about six consecutive quarters. Construction activities continued with a negative trend and registered a drop of -3.5% y/y in the period (-0.1% q/q SA), that is mainly attributed to the decrease of -9.7% y/y (-2.2% q/q SA) in the building sector which has registered negative results for about eight consecutive quarters; the good dynamic in civil infrastructure works which increased by 9.6% y/y (5.2% q/q SA) partially offset the negative trend.
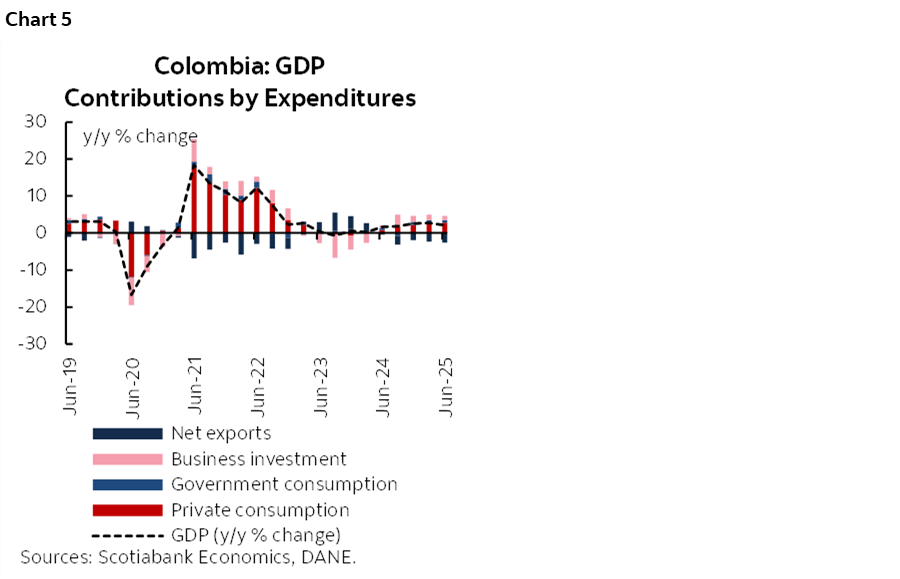
- Private consumption drove the domestic demand result, and public spending registered a recovery (chart 5). Domestic demand increased by 4.2% y/y (1.2% q/q SA). Private consumption contributed the most and continues with a positive trend with an increase of 3.7% y/y (0.1% q/q SA) and continues above the long-term consumption trend for Colombia but with a more sustainable level. Thus, household consumption reflected higher spending on non-durable goods (4.2% y/y), services (2.3% y/y), and durable goods (14.8% y/y), while spending on semi-durable goods remains in a positive trend with an increase of 7.7% y/y. In contrast with last year, government spending grew by 3.9% y/y (2.6% q/q SA) during this period. However, it is worth noting that in 2025, economic activity is expected to continue showing a recovery on the private consumption side, as the public sector faces a huge liquidity constraint and reduction on its investment budget.
- In the case of investments, gross capital formation expanded by 6.4% y/y (2.7% q/q SA) and fixed investment expanded by 1.7% y/y (3.4% q/q SA). These results suggested that inventories increased during the second quarter. The main contributors in investment growth were machinery and equipment (11.6% y/y) and biological resources (4.1% y/y) but were offset by housing (-10.6% y/y) and other buildings (-1.2% y/y). It’s important to note that investment is still weak and representing 17% of GDP, below what it used to be five years before the pandemic, ~ 22% of GDP.
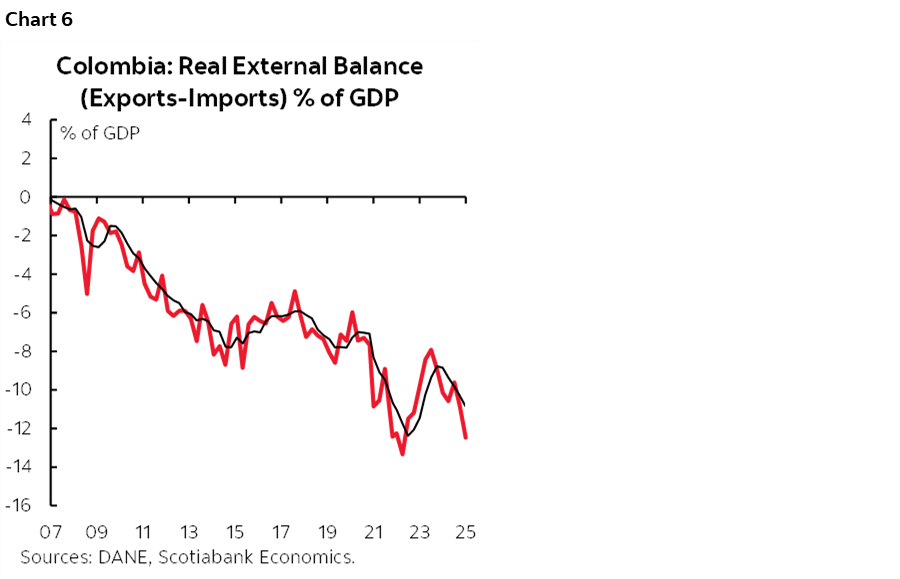
- On the external balance side the widening of the trade deficit was driven by a decline in exports and a surge in imports (chart 6). Thus, exports dropped by 1.6% y/y (-0.3% q/q SA) and contributed -0.2 ppts, while imports had a variation of 9.7% y/y (2.6% q/q SA), offsetting with -2.1 ppts to the general growth result. It is worth noting that imports of goods expanded by 12.5% y/y in Q2-2025, which represents a higher growth rate compared to one year ago (0.8% y/y).
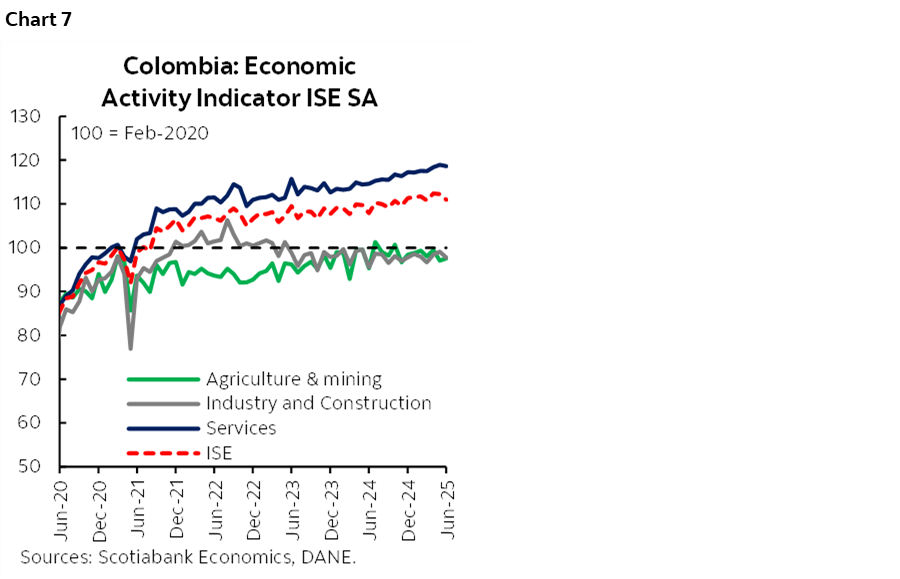
Economic Activity Indicator (ISE):
- In June, the ISE grew by 2.9% (-1.1% q/q SA) compared to June 2024, with 10 of the 12 activities showing positive variations (chart 7). The performance was mainly due to an increase in public services (which includes health and education services) which increased 5.4% y/y and contributed by 0.9 ppts, commerce, transport, and hotels with an expansion of 4.5% y/y and a contribution of 0.8 ppts, agriculture with 6.0% y/y and a contribution of 0.6 ppts, and manufacturing with an increase of 3.1% y/y and a contribution of 0.3 ppts. On the negative side, oil and mining recorded a drop of -4.5% y/y subtracting 0.2 ppts of the result, followed by finance and insurance activities which contracted by -3.5% y/y subtracting 0.2 ppts.
—Valentina Guio
BANREP’S SURVEY—INFLATION EXPECTATIONS MOVE UP AND NOW ANALYSTS EXPECT ONLY ONE 25 BPS RATE CUT IN 2025
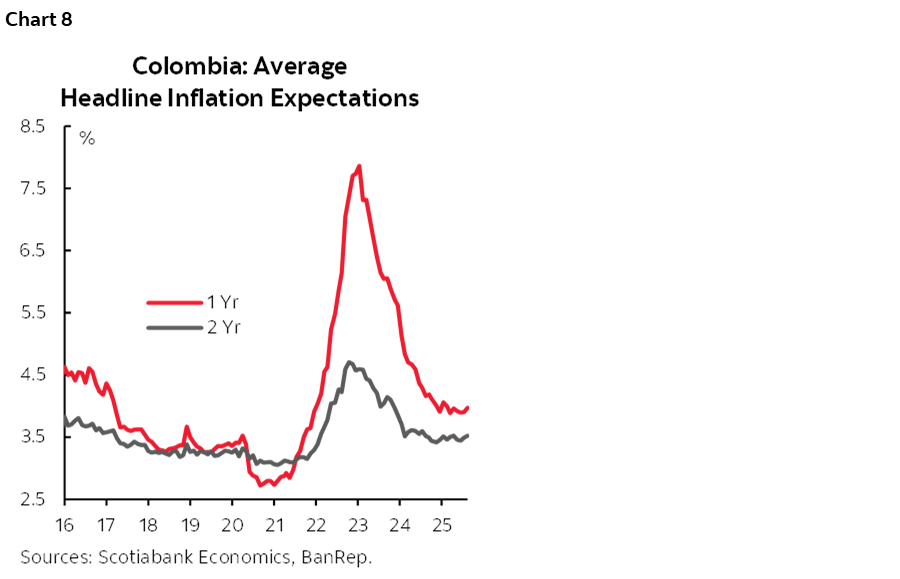
The central bank (BanRep) published its survey of economists’ expectations for August. Inflation expectations rose compared to the previous survey, explained by an upward surprise in July inflation. For December 2025, headline inflation expectations increased by 15 basis points to 4.94%. Over a one and two-year horizon (chart 8), expectations increased by 7bps and 3bps, respectively, although at a level that would be within BanRep’s target range (defined between 2% and 4%).
The results are below the path projected by Scotiabank Colpatria, as we estimate year-end inflation of around 5.20% and that by 2026 it will fall within the target range, closing at 3.98%, higher than the consensus forecast of 3.85%. In the short-term, inflation expectations are 0.19% for August, implying an increase in annual inflation from 4.90% in July to 5.10% in August. Scotiabank Colpatria expects August inflation to be 0.23% m/m and 5.14% y/y, above consensus expectations. Furthermore, in our baseline scenario, we continue to expect inflation to remain above 5% for the remainder of the year.
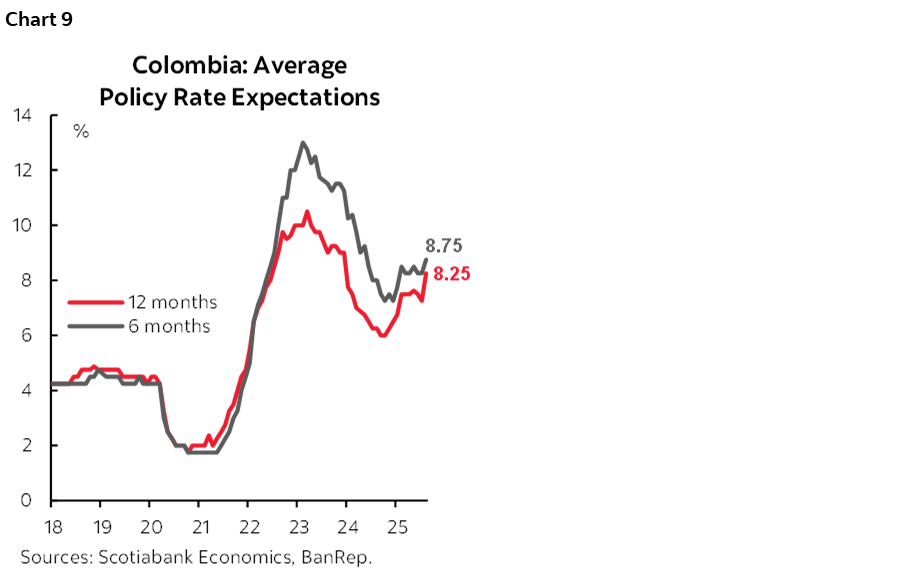
Regarding monetary policy, analysts do not expect rate cuts at the September meeting. At the July meeting, the board decided to keep rates stable at 9.25%, in a split decision, again with four members in favour of stability, two in favour of a 50bps cut, and one in favour of a 25bps cut. The majority group emphasized the need to remain cautious, given a scenario in which economic activity has performed better than expected, while inflation remains above the target range. Furthermore, restrictive international financial conditions in a context of a wide fiscal deficit, and uncertainty about the minimum wage are some of the constraints on initiating the easing cycle. Analysts currently only await a rate cut in October of 25bps to 9%, the level at which the bank would close out 2025, while for end-2026 they expect a rate of 7.50%. Scotiabank Colpatria projects a rate of 9.25% for December 2025 and 7.50% for 2025.
Regarding the exchange rate, the consensus revised its outlook downward for 2025 and 2026. For December 2025, analysts estimate an exchange rate of 4,114 pesos, 35 pesos lower than the previous survey. By 2026, the forecast is 4,112 pesos, 14 pesos lower than the previous projection. Scotiabank Colpatria’s projection for 2025 is 4,249 pesos, and for 2026, 4,200 pesos.
Survey highlights:
- Short-term inflation expectations. For August, the consensus estimate is 0.19% m/m, implying annual inflation of 5.10% y/y, above the current 4.90%. The high is 0.39% and the low is -0.04%, which shows a high dispersion among analysts, mainly due to regulated services and food that have been showing surprising numbers in recent months. Scotiabank Colpatria Economics’ projection is 0.23% m/m and 5.14% y/y. Core inflation, excluding food, projected by analysts is 0.16% m/m.
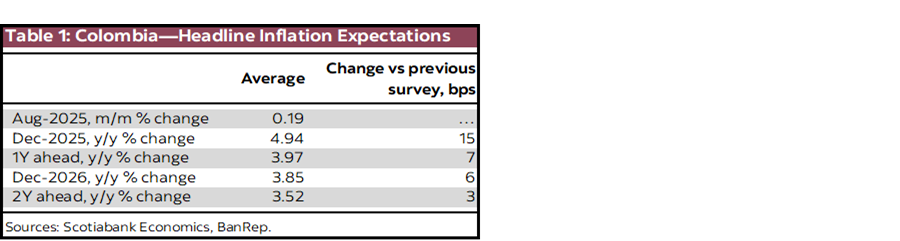
- Medium-term inflation expectations. Inflation expectations for December 2025 increased 15bps to 4.94% (table 1). Expectations for a one-year horizon slightly increased by 7bps to 3.97%, and expectations for a two-year horizon increased by 3bps to 3.52%. Scotiabank Colpatria’s expectations are above the market consensus; however, our bias is primarily explained by low food statistical bases in the third quarter of 2024, which will be difficult to replicate.
- Monetary policy rate. The median expectation is a pause in the September meeting at 9.25%. By 2025, the rate is estimated to fall to 9.0%, implying one additional rate cut over the remainder of the year (chart 9).
- FX. Projections for the US dollar exchange rate for the end of 2025 averaged 4,114 pesos (35 pesos lower than the previous survey). By December 2026, respondents, on average, expect an exchange rate of 4,112 pesos.
—Daniela Silva
DISCLAIMER
This report has been prepared by Scotiabank Economics as a resource for the clients of Scotiabank. Opinions, estimates and projections contained herein are our own as of the date hereof and are subject to change without notice. The information and opinions contained herein have been compiled or arrived at from sources believed reliable but no representation or warranty, express or implied, is made as to their accuracy or completeness. Neither Scotiabank nor any of its officers, directors, partners, employees or affiliates accepts any liability whatsoever for any direct or consequential loss arising from any use of this report or its contents.
These reports are provided to you for informational purposes only. This report is not, and is not constructed as, an offer to sell or solicitation of any offer to buy any financial instrument, nor shall this report be construed as an opinion as to whether you should enter into any swap or trading strategy involving a swap or any other transaction. The information contained in this report is not intended to be, and does not constitute, a recommendation of a swap or trading strategy involving a swap within the meaning of U.S. Commodity Futures Trading Commission Regulation 23.434 and Appendix A thereto. This material is not intended to be individually tailored to your needs or characteristics and should not be viewed as a “call to action” or suggestion that you enter into a swap or trading strategy involving a swap or any other transaction. Scotiabank may engage in transactions in a manner inconsistent with the views discussed this report and may have positions, or be in the process of acquiring or disposing of positions, referred to in this report.
Scotiabank, its affiliates and any of their respective officers, directors and employees may from time to time take positions in currencies, act as managers, co-managers or underwriters of a public offering or act as principals or agents, deal in, own or act as market makers or advisors, brokers or commercial and/or investment bankers in relation to securities or related derivatives. As a result of these actions, Scotiabank may receive remuneration. All Scotiabank products and services are subject to the terms of applicable agreements and local regulations. Officers, directors and employees of Scotiabank and its affiliates may serve as directors of corporations.
Any securities discussed in this report may not be suitable for all investors. Scotiabank recommends that investors independently evaluate any issuer and security discussed in this report, and consult with any advisors they deem necessary prior to making any investment.
This report and all information, opinions and conclusions contained in it are protected by copyright. This information may not be reproduced without the prior express written consent of Scotiabank.
™ Trademark of The Bank of Nova Scotia. Used under license, where applicable.
Scotiabank, together with “Global Banking and Markets”, is a marketing name for the global corporate and investment banking and capital markets businesses of The Bank of Nova Scotia and certain of its affiliates in the countries where they operate, including; Scotiabank Europe plc; Scotiabank (Ireland) Designated Activity Company; Scotiabank Inverlat S.A., Institución de Banca Múltiple, Grupo Financiero Scotiabank Inverlat, Scotia Inverlat Casa de Bolsa, S.A. de C.V., Grupo Financiero Scotiabank Inverlat, Scotia Inverlat Derivados S.A. de C.V. – all members of the Scotiabank group and authorized users of the Scotiabank mark. The Bank of Nova Scotia is incorporated in Canada with limited liability and is authorised and regulated by the Office of the Superintendent of Financial Institutions Canada. The Bank of Nova Scotia is authorized by the UK Prudential Regulation Authority and is subject to regulation by the UK Financial Conduct Authority and limited regulation by the UK Prudential Regulation Authority. Details about the extent of The Bank of Nova Scotia's regulation by the UK Prudential Regulation Authority are available from us on request. Scotiabank Europe plc is authorized by the UK Prudential Regulation Authority and regulated by the UK Financial Conduct Authority and the UK Prudential Regulation Authority.
Scotiabank Inverlat, S.A., Scotia Inverlat Casa de Bolsa, S.A. de C.V, Grupo Financiero Scotiabank Inverlat, and Scotia Inverlat Derivados, S.A. de C.V., are each authorized and regulated by the Mexican financial authorities.
Not all products and services are offered in all jurisdictions. Services described are available in jurisdictions where permitted by law.