- Colombia: July inflation was higher than expected, with food prices surprising on the upside
- Mexico: Weak industrial activity despite increases in manufacturing and construction
COLOMBIA: JULY INFLATION WAS HIGHER THAN EXPECTED, WITH FOOD PRICES SURPRISING ON THE UPSIDE
Colombia’s monthly CPI inflation rate was 0.28% m/m in July, according to data published by DANE on Friday, August 8th, 2025. This result was above analysts’ expectations in the BanRep survey (0.18% m/m) and the Scotiabank Colpatria forecast (0.20% m/m). During the month, 10 of the 12 groups registered positive monthly variations, with food and lodging and utilities contributing the most to total inflation, accounting for 75% (chart 1).

The upside surprise was driven by food inflation. Food prices increased 0.82% m/m, well above the average historical variation for the month of July excluding the pandemic (0.08% m/m). We associate the increase in food prices with the road closures that occurred during the month due to the strike of rice producers. The lodging and utilities sector was the second largest contributor to July inflation, with a 0.19% increase and a 6bps contribution, mainly due to increases in housing-related services, while utilities registered a negative change for the second month in a row (-0.31% m/m).
In annual terms, inflation rose from 4.82% in June to 4.90% in July, interrupting the declines recorded in the previous two months. Non-food inflation fell from 4.94% y/y to 4.89% y/y, while core inflation (excluding food and regulated prices) showed a slight acceleration from 4.77% y/y to 4.79% y/y. Services inflation remained stable compared to the previous month at 6.0%, reflecting an acceleration in annual inflation for restaurants and hotels, and transportation. Meanwhile, inflation for goods rose from 1.58% to 1.66%, remaining below the target range (2%–4%).
Previous results affirm our expectation that inflation will rebound in the following months, closing 2025 at levels above 5%. In August, the BanRep board will not have to decide on interest rates. However, given the current outlook and the political risks that could impact inflation, such as a greater fiscal deficit and potential high minimum wage increases, we believe that the room for cuts is limited, and the interest rate will remain stable at 9.25% for the remainder of the year.
Our baseline scenario is closing 2025 with a monetary policy rate of 9.25%. The possibility of resuming the easing cycle is highly dependent on decisions regarding the minimum wage increase for 2026, as indexation effects were one of the main reasons inflation has not declined more rapidly in 2025, and these effects remain a key source of uncertainty for 2026.
Other highlights:
- Two groups accounted for 75% of total inflation. Food was the largest contributor, with a monthly increase of 0.82% and a contribution of 15bps. Within the food basket, fruits and onions were the largest contributors to the food price increase, with increases of 3.11% m/m and 10.5% m/m. However, other foods also registered significant increases, such as carrots (+19.3% m/m), tomatoes (+5.17% m/m) and coffee (+6.34% m/m), However, 32% of the food items included in the basket registered increases below zero, with potatoes registering the largest decrease (-6.82% m/m).
- Lodging and utilities were the second largest contributors to inflation. Lodging and utilities registered a monthly increase of 0.19%, contributing 6bps to the total. The increase was due to housing-related services, with rentals showing a more modest increase than the previous month at 0.31% m/m. However, other services related to housing administration and security registered a 0.99% m/m increase, higher than the 0.82% m/m in June. Meanwhile, utilities registered a -0.31% m/m decrease, showing negative variations across all components. Gas rates fell -1.19% m/m, electricity -0.20% m/m, completing three months of negative variations, while water fell -0.09% m/m.
- Other items contributed to inflation. Health services showed a 0.39% m/m increase, the second largest increase, but contributing only 1bps. Restaurants and hotels increased 0.35% m/m, contributing 4bps, maintaining higher monthly variations than the historical average. Despite increased domestic demand from households, goods prices have maintained moderate variations, with household appliances registering negative variations in the month and vehicles falling slightly (-0.08% m/m).
- Services continued to show persistence in July. Services inflation had maintained a downtrend; however, in July it remained stable at 6% y/y despite some reductions in leisure-related prices. Services are believed to contribute around 65% of total annual inflation (charts 2 and 3).

—Jackeline Piraján & Daniela Silva
MEXICO: WEAK INDUSTRIAL ACTIVITY DESPITE INCREASES IN MANUFACTURING AND CONSTRUCTION
In June, industrial production softened its annual decline, from -0.7% to -0.4% y/y, marking five out of the six months of the year in negative territory. Across the main categories, the sharpest drop came from mining, deepening to -8.6%, with consecutive declines since July 2023. Additionally, electricity, gas, and water generation and distribution maintained a decline of -3.7% (chart 4).

Meanwhile, construction rose from 0.5% to 1.7%, owing to stronger growth in building construction (8.7%), which offset the drop in heavy and civil engineering works (-20%). Manufacturing also showed a slightly more favourable pace, rising from 0.5% to 0.7%, although still with heterogeneous behaviour in its components. As a result, in the cumulative total for the first six months of the year, production maintained a decline of -1.3% YTD.
On a seasonally adjusted monthly basis, activity turned negative, with -0.1% m/m, after two consecutive months of growth. Construction fell by -0.2%, while manufacturing posted three months in positive territory, rising from 0.1% to 0.3%. The sharpest drop came from mining, which continues to show a steep decline of -1.4% (chart 5).
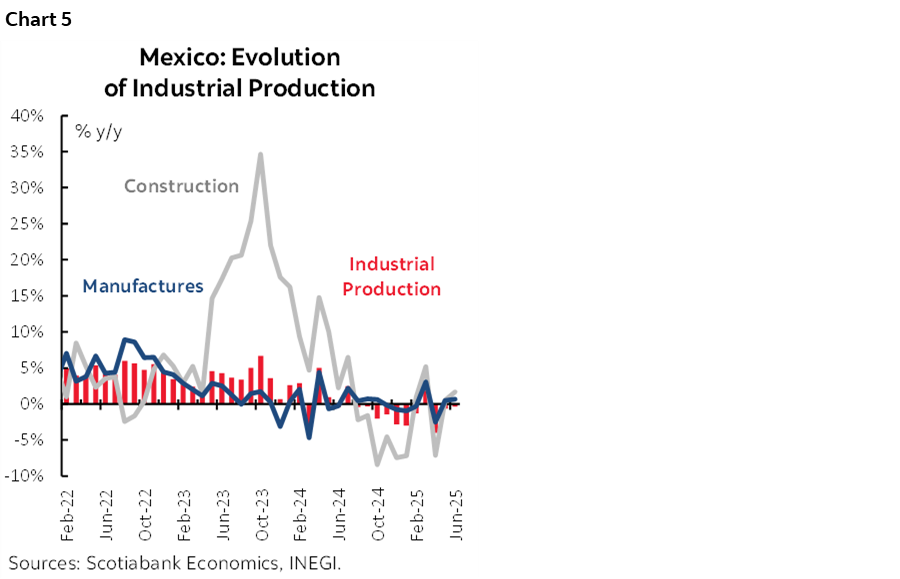
Looking ahead, we believe industrial activity could remain in negative territory due to stagnation in mining and public utilities, along with weakness in construction, affected by both international and domestic uncertainty.
—Rodolfo Mitchell & Miguel Saldaña
DISCLAIMER
This report has been prepared by Scotiabank Economics as a resource for the clients of Scotiabank. Opinions, estimates and projections contained herein are our own as of the date hereof and are subject to change without notice. The information and opinions contained herein have been compiled or arrived at from sources believed reliable but no representation or warranty, express or implied, is made as to their accuracy or completeness. Neither Scotiabank nor any of its officers, directors, partners, employees or affiliates accepts any liability whatsoever for any direct or consequential loss arising from any use of this report or its contents.
These reports are provided to you for informational purposes only. This report is not, and is not constructed as, an offer to sell or solicitation of any offer to buy any financial instrument, nor shall this report be construed as an opinion as to whether you should enter into any swap or trading strategy involving a swap or any other transaction. The information contained in this report is not intended to be, and does not constitute, a recommendation of a swap or trading strategy involving a swap within the meaning of U.S. Commodity Futures Trading Commission Regulation 23.434 and Appendix A thereto. This material is not intended to be individually tailored to your needs or characteristics and should not be viewed as a “call to action” or suggestion that you enter into a swap or trading strategy involving a swap or any other transaction. Scotiabank may engage in transactions in a manner inconsistent with the views discussed this report and may have positions, or be in the process of acquiring or disposing of positions, referred to in this report.
Scotiabank, its affiliates and any of their respective officers, directors and employees may from time to time take positions in currencies, act as managers, co-managers or underwriters of a public offering or act as principals or agents, deal in, own or act as market makers or advisors, brokers or commercial and/or investment bankers in relation to securities or related derivatives. As a result of these actions, Scotiabank may receive remuneration. All Scotiabank products and services are subject to the terms of applicable agreements and local regulations. Officers, directors and employees of Scotiabank and its affiliates may serve as directors of corporations.
Any securities discussed in this report may not be suitable for all investors. Scotiabank recommends that investors independently evaluate any issuer and security discussed in this report, and consult with any advisors they deem necessary prior to making any investment.
This report and all information, opinions and conclusions contained in it are protected by copyright. This information may not be reproduced without the prior express written consent of Scotiabank.
™ Trademark of The Bank of Nova Scotia. Used under license, where applicable.
Scotiabank, together with “Global Banking and Markets”, is a marketing name for the global corporate and investment banking and capital markets businesses of The Bank of Nova Scotia and certain of its affiliates in the countries where they operate, including; Scotiabank Europe plc; Scotiabank (Ireland) Designated Activity Company; Scotiabank Inverlat S.A., Institución de Banca Múltiple, Grupo Financiero Scotiabank Inverlat, Scotia Inverlat Casa de Bolsa, S.A. de C.V., Grupo Financiero Scotiabank Inverlat, Scotia Inverlat Derivados S.A. de C.V. – all members of the Scotiabank group and authorized users of the Scotiabank mark. The Bank of Nova Scotia is incorporated in Canada with limited liability and is authorised and regulated by the Office of the Superintendent of Financial Institutions Canada. The Bank of Nova Scotia is authorized by the UK Prudential Regulation Authority and is subject to regulation by the UK Financial Conduct Authority and limited regulation by the UK Prudential Regulation Authority. Details about the extent of The Bank of Nova Scotia's regulation by the UK Prudential Regulation Authority are available from us on request. Scotiabank Europe plc is authorized by the UK Prudential Regulation Authority and regulated by the UK Financial Conduct Authority and the UK Prudential Regulation Authority.
Scotiabank Inverlat, S.A., Scotia Inverlat Casa de Bolsa, S.A. de C.V, Grupo Financiero Scotiabank Inverlat, and Scotia Inverlat Derivados, S.A. de C.V., are each authorized and regulated by the Mexican financial authorities.
Not all products and services are offered in all jurisdictions. Services described are available in jurisdictions where permitted by law.