- Chile: The Monetary Policy Rate remains at 5.00%. No change is expected until September; Unemployment rate rises to 8.7% in the quarter ending in March
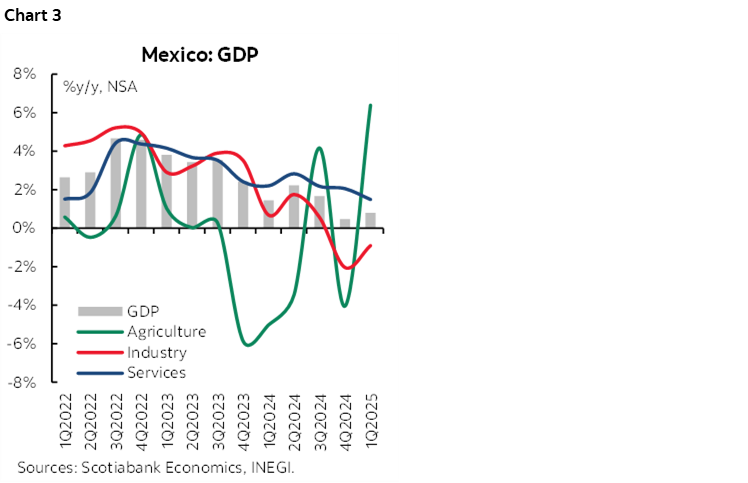
- Mexico: GDP surprises to the upside, supported by agriculture
- Peru: Fiscal deficit begins to decline after improved tax revenues; Evolution of fiscal accounts during 1Q25
CHILE: MONETARY POLICY RATE REMAINS AT 5.00%. NO CHANGE IS EXPECTED UNTIL SEPTEMBER
- The neutral bias and the message of caution regarding external risks remain, although a better start to the year in economic activity and a slight downward surprise in inflation are observed
On Tuesday, April 29th, the Central Bank (BCCh) maintained the policy rate at 5%, as broadly expected. On the external scenario, the BCCh once again highlights the increase in uncertainty about the outlook for the global economy, especially in the United States. Following the March meeting, market consensus projections for 2025 GDP have continued to decline markedly for the United States, with less pronounced declines in China and the Eurozone. It is important to highlight the reading, which we also endorse at Scotiabank, regarding external pressures on local inflation. The BCCh indicates that CPI pressures could ease in countries like Chile, which will not modify their trade policy, given the dominance of lower global GDP growth, falling energy prices, CLP appreciation, and the redirection of goods that will be more affected in economies with reciprocal tariffs.
The Board acknowledges a slight upward surprise in economic activity in February, and at Scotiabank, we anticipate another positive surprise (this time much more pronounced) in the March GDP (we forecast 3.5% to 4.0% y/y). Furthermore, the inflation scenario has evolved marginally below what was forecast in the March IPoM. At Scotiabank, we forecast inflation of 3.5% y/y for December 2025. While economic activity has started the year dynamically, including with positive news on the mining investment front, the elevated risks from the external environment for 2025 will be offset.
The BCCh shows no signs of changing its base case for the policy rate given a slight increase in 2025 GDP and a limited reduction in inflation relative to the forecast. This scenario considers two rate cuts (September and December), not validating the expectations contained in market rates, which include approximately three cuts this year. At Scotiabank, we maintain and support the Central Bank’s scenario, which considers the cut to be in September and not before the Fed begins its cutback process.
Why won't the Central Bank adjust its low 2025 GDP growth projection despite the trade war (although it will introduce a downward bias into 2026 GDP)? The consensus has adjusted the 2025 growth projection downward in light of the trade war and its effect on global growth. Without ignoring the more pronounced effects on Chilean external demand growth in the second half of 2025 and 2026, the GDP figures for the first quarter of this year will be a positive surprise for the growth projected in the Central Bank’s base case. We anticipate 2.0% y/y expansion in Q1-25, above the Central Bank’s 1.6%. Additionally, investment projected to grow by 3.7% in the last IPoM will be revised in June, closer to Scotiabank’s projection (6.0%) given the positive momentum in capital imports and the entry of new mining and energy projects. The cuts in public spending, which will ultimately grow by around 2.3% in 2025 if these cuts materialize, will be incorporated by the Central Bank in conjunction with lower global GDP growth, but will only offset the improved growth figures and the upward revision in the expansion of domestic demand. We maintain GDP growth of 2.5% in 2025, consistent with cuts in the policy rate only starting in September and not before the first Fed cut. We reiterate our 2025 inflation projection of 3.5%, markedly below the market, the Central Bank, and surveys.
UNEMPLOYMENT RATE RISES TO 8.7% IN THE QUARTER ENDING IN MARCH
- Seasonal job losses do not change the diagnosis of labour market weakness
On Tuesday, April 29th, the INE released the unemployment rate for the quarter ending in March, which rose to 8.7%, slightly above expectations, due to the strong dynamism of the labour force, in contrast to seasonal job losses. While the quarter’s job losses (-8k) were within seasonal expectations, greater dynamism in employment, especially in private sector wage earners, is needed to reverse the diagnosis of a weak labour market and an upward trend in the unemployment rate. These figures confirm that the labour market continues to display wide capacity gaps, with the seasonally adjusted unemployment rate remaining around 8.5% (chart 1). Regarding the strong dynamism of the labour force, this phenomenon has been observed for several months, with a decreasing number of people reporting “no desire to work” or citing “permanent family reasons” or “study reasons.”

Heterogeneity in employment across economic sectors. On the negative side, there is a notable loss of private salaried employment in the commerce sector, as well as a decline in public-sector salaried employment in the education and public administration sectors. This latter category of employment has been losing share since the beginning of the Q4-24, at the same time as the tightness of public finances and the need to reduce spending to meet fiscal targets became more evident. Looking ahead, the importance of the private sector in the recovery of total employment will increase in a context where the direct contribution of the public sector to job creation will remain limited.
Salaried employment contracts, while self-employment regains share. The decline in salaried employment was primarily explained by its public sector component (-29k). While 19k salaried jobs were lost in the private sector, the decline was less than the average for March (chart 2). On the other hand, one of the few positive pieces of news in the quarterly figure was the recovery in self-employment, where 44k new jobs were created. While this allows for some of the share this employment category has lost since the pandemic to recover, the sector remains significantly behind.

Mining and industrial sectors are expected to show increasing demand for employment in the coming quarters. Based on estimates by the Capital Goods Corporation (CBC), the current investment in the pipeline for the mining sector considers that the peak in direct employment demand required by these projects will be reached in the Q3-25, which will remain at similar levels until the end of 2026, given the high level of investment in the sector. Similarly, demand for employment from industrial sector projects is expected to peak in the Q3-25, although it will rapidly fade by mid-2026. For the remainder of the year, the continued entry of new investment projects in sectors such as real estate and public works will be of great importance, as their demand for employment is typically higher and could strengthen the labour market in the coming quarters.
We project March’s GDP between 3.5% and 4.0% y/y, which would be consistent with recent employment figures and our sector growth projections. The recovery from the February electricity blackout, with mining significantly increasing year-on-year production, and industry and commerce also seeing significant year-on-year expansions, while services would show a recovery led by business services, Transportation services, and personal services. Our non-mining nowcast anticipates seasonally adjusted growth between 0.4% and 1% m/m. Regarding this, the additional business day will also generate a year-on-year contribution. If our GDP projection is confirmed, Q1-25 would see growth of 2.0% y/y, above the Central Bank’s base case (1.6% y/y). In this context, any correction to 2025 GDP growth due to the external scenario could be offset by this surprise, leading to the BCCh maintaining its growth projection for the year in its June IPoM.
—Aníbal Alarcón
MEXICO: GDP SURPRISES TO THE UPSIDE, SUPPORTED BY AGRICULTURE
Q1 2025 GDP increased more than expected, rising by 0.8% y/y in real terms, up from 0.5% in Q4 2024, surpassing the consensus expectation of 0.6% (chart 3). By sector, industry fell by -0.9% y/y (-2.0% previously), the services sector slowed to 1.5% (2.1% previously), and agriculture showed a significant increase of 6.4% (-4.0% previously). On a seasonally adjusted quarterly data basis, GDP increased by 0.2% q/q, up from -0.6% previously, exceeding the consensus of 0.1%. Industry fell by -0.3% q/q (-1.5% previously), the services sector showed no change at 0.0% (0.2% previously), and the agriculture increased by 8.1% (-8.5% previously). We believe the better-than-expected print is due to several advances in purchases and production in sectors that will be most affected by the imposition of tariffs starting in April. Therefore, we believe that in the coming months, the economy could remain weak, affected by the high level of uncertainty.
—Rodolfo Mitchell, Brian Pérez & Miguel Saldaña
PERU: FISCAL DEFICIT BEGINS TO DECLINE AFTER IMPROVED TAX REVENUES
The fiscal deficit reached 3.4% of GDP in the 12 months ending in March (chart 4), slightly lower than the 3.5% recorded in the 2024 full year, according to recently released official figures. The improvement was smaller than we were expecting. Although tax revenues have been recovering in line with estimates, public spending continues to exceed our forecasts.
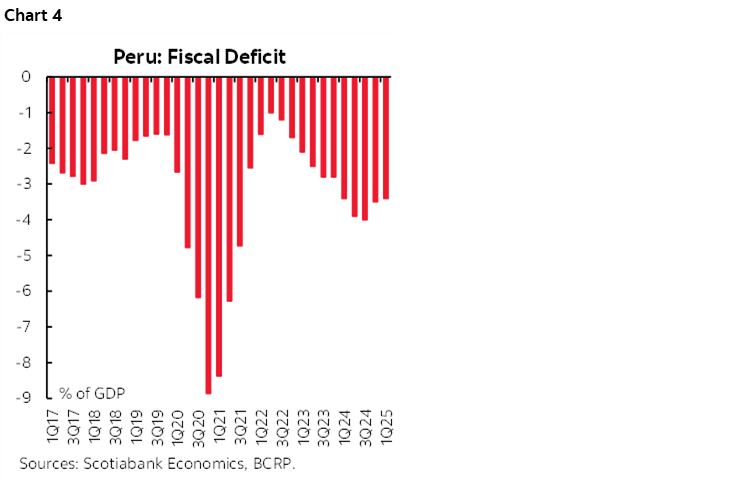
We estimate that the fiscal deficit will approach 3.0% of GDP by the end of April, on higher payments during the yearly income tax season, particularly from mining companies. If this materializes, our forecast of a fiscal deficit of 2.5% of GDP for full-year 2025 may be met. However, the government is unlikely to reach its target of 2.2% of GDP.
The main risk to the expected improvement in the fiscal deficit come from outside of Peru. The tariff war launched by the US threatens a slowdown in the global economy, which could affect the price of copper. High metal prices—mainly copper and gold—is one of the two reasons we have been expecting an increase in tax revenue going forward. The other reason is the strength of domestic demand. However, any significant decline in metal prices would impact 2026 tax revenue, more than 2025, as each tax income tax season is on the previous year’s results.
EVOLUTION OF FISCAL ACCOUNTS DURING 1Q25
Tax revenues rose 14.5% YoY in 1Q25, driven by a 105% increase in payments during the main income tax season (chart 5). Mining companies were the main source of this increase, thanks to higher metal prices in 2H24. This also contributed to the 25.8% increase in revenues from the Special Mining Tax. Likewise, higher tax revenues linked to domestic demand, such as VAT (+14.6%) and the Selective Consumption Tax (ISC) (+10.6%), contributed to this increase.
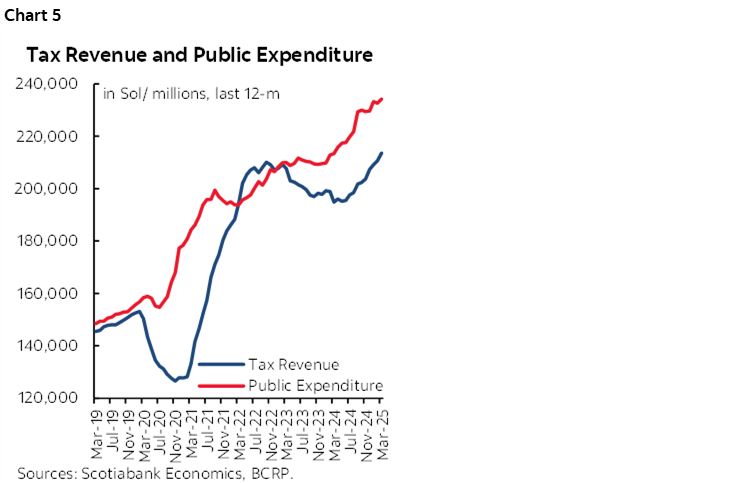
On the other side, public spending increased 9.9%, mainly due to higher current spending (+7.6%), with particular emphasis on the increase in expenditures for salaries by the National Government (+11.7%), particularly in the education, defense, and interior sectors. Spending on goods and services rose 8.7, and higher pension expenditures. Public investment rose 14.9%, driven by public projects by the National Government—particularly Lima Metro Line 2, and the Bicentennial Schools project.
—Pablo Nano
DISCLAIMER
This report has been prepared by Scotiabank Economics as a resource for the clients of Scotiabank. Opinions, estimates and projections contained herein are our own as of the date hereof and are subject to change without notice. The information and opinions contained herein have been compiled or arrived at from sources believed reliable but no representation or warranty, express or implied, is made as to their accuracy or completeness. Neither Scotiabank nor any of its officers, directors, partners, employees or affiliates accepts any liability whatsoever for any direct or consequential loss arising from any use of this report or its contents.
These reports are provided to you for informational purposes only. This report is not, and is not constructed as, an offer to sell or solicitation of any offer to buy any financial instrument, nor shall this report be construed as an opinion as to whether you should enter into any swap or trading strategy involving a swap or any other transaction. The information contained in this report is not intended to be, and does not constitute, a recommendation of a swap or trading strategy involving a swap within the meaning of U.S. Commodity Futures Trading Commission Regulation 23.434 and Appendix A thereto. This material is not intended to be individually tailored to your needs or characteristics and should not be viewed as a “call to action” or suggestion that you enter into a swap or trading strategy involving a swap or any other transaction. Scotiabank may engage in transactions in a manner inconsistent with the views discussed this report and may have positions, or be in the process of acquiring or disposing of positions, referred to in this report.
Scotiabank, its affiliates and any of their respective officers, directors and employees may from time to time take positions in currencies, act as managers, co-managers or underwriters of a public offering or act as principals or agents, deal in, own or act as market makers or advisors, brokers or commercial and/or investment bankers in relation to securities or related derivatives. As a result of these actions, Scotiabank may receive remuneration. All Scotiabank products and services are subject to the terms of applicable agreements and local regulations. Officers, directors and employees of Scotiabank and its affiliates may serve as directors of corporations.
Any securities discussed in this report may not be suitable for all investors. Scotiabank recommends that investors independently evaluate any issuer and security discussed in this report, and consult with any advisors they deem necessary prior to making any investment.
This report and all information, opinions and conclusions contained in it are protected by copyright. This information may not be reproduced without the prior express written consent of Scotiabank.
™ Trademark of The Bank of Nova Scotia. Used under license, where applicable.
Scotiabank, together with “Global Banking and Markets”, is a marketing name for the global corporate and investment banking and capital markets businesses of The Bank of Nova Scotia and certain of its affiliates in the countries where they operate, including; Scotiabank Europe plc; Scotiabank (Ireland) Designated Activity Company; Scotiabank Inverlat S.A., Institución de Banca Múltiple, Grupo Financiero Scotiabank Inverlat, Scotia Inverlat Casa de Bolsa, S.A. de C.V., Grupo Financiero Scotiabank Inverlat, Scotia Inverlat Derivados S.A. de C.V. – all members of the Scotiabank group and authorized users of the Scotiabank mark. The Bank of Nova Scotia is incorporated in Canada with limited liability and is authorised and regulated by the Office of the Superintendent of Financial Institutions Canada. The Bank of Nova Scotia is authorized by the UK Prudential Regulation Authority and is subject to regulation by the UK Financial Conduct Authority and limited regulation by the UK Prudential Regulation Authority. Details about the extent of The Bank of Nova Scotia's regulation by the UK Prudential Regulation Authority are available from us on request. Scotiabank Europe plc is authorized by the UK Prudential Regulation Authority and regulated by the UK Financial Conduct Authority and the UK Prudential Regulation Authority.
Scotiabank Inverlat, S.A., Scotia Inverlat Casa de Bolsa, S.A. de C.V, Grupo Financiero Scotiabank Inverlat, and Scotia Inverlat Derivados, S.A. de C.V., are each authorized and regulated by the Mexican financial authorities.
Not all products and services are offered in all jurisdictions. Services described are available in jurisdictions where permitted by law.