- Mexico: Activity rebounds in February prior to trade war escalation
- Peru: Cement sales rise for the second consecutive month
MEXICO: ACTIVITY REBOUNDS IN FEBRUARY PRIOR TO TRADE WAR ESCALATION
In February, the monthly GDP proxy (IGAE, chart 1) showed a seasonally adjusted monthly rebound of 1.0% m/m from the previous 0.1% (revised from –0.2%), beating the median forecast of a 0.5% rise. Primary activity increased by 1.0% slowing from a 3.2% pace, industry rebounded to 2.5% from -0.6%—mainly driven by manufacturing, which grew by 2.9% m/m—and services also picked up the pace growing by 0.6% versus 0.2% in January.

On a year-on-year annual basis, the IGAE showed a decline of -0.7% y/y, compared to 0.0% the previous month (which was revised from -0.1%) and a –1.1% economist median; however, adjusting for working days results in a 0.8% y/y rise as 2024 was a leap year. By components, industry fell for the seventh consecutive time by 1.3% (-2.9% prior), driven by a small decline in manufacturing (-0.3%), a sharp contraction in mining (-9.2%), though showing a rebound in construction (0.4% after –7% in January). Services went from a 0.8% expansion to a -0.3% contraction, with wholesale trade dropping -8.5% and retail trade moderating to 2.5%. Primary activities fell by -3.5% (14.8% prior).
The better-than-expected figures may be reflecting an advance in production in some sectors, mainly manufacturing, ahead of the implementation of steep U.S. tariffs. However, in the coming months, the pace of economic activity is expected to remain low also owing to slower exports and consumption, as well as greater uncertainty that could affect investment, leading to further downward revisions in growth expectations for 2025.
—Rodolfo Mitchell, Brian Pérez & Miguel Saldaña
PERU: CEMENT SALES RISE FOR THE SECOND CONSECUTIVE MONTH
Local cement sales grew for the second consecutive month in March, following a decline in January (charts 2 and 3). In March, cement sales increased by nearly 6% y/y, surpassing February’s growth of 4.4% y/y. In volume terms, sales reached 950 thousand tons, marking the second-highest volume for the year’s first quarter, according to ASOCEM (Asociación de Productores de Cemento).
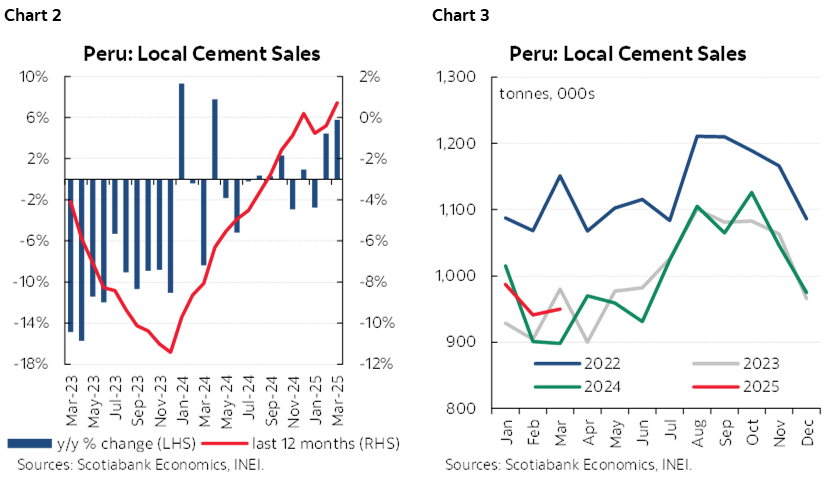
This March result was partly attributed to two additional working days, as the Easter holidays fell in March 2024, leading to the lowest monthly cement consumption for that year. Additionally, there appears to be a recovery in the self-construction segment, which accounts for 70% of cement demand, likely fueled by a gradual recovery in formal employment and the relative stability of construction material prices. Notably, there was a slight decrease in the average price of cement in Metropolitan Lima, with March’s average price being 30.48 PEN per bag, which is lower than the price at the end of 2024 (30.60 PEN per bag) and the lowest price recorded since January 2024, according to INEI (Instituto Nacional de Estadistica e Informatica).
With the results from March, domestic cement consumption in 1Q25 increased by 2.3%, remaining in positive territory after growing by 1.1% in 4Q24. As mentioned earlier, this growth was driven by heightened demand for self-construction. Moreover, there was increased demand for public sector projects due to an 18% rise in public investment during 1Q25, according to the Ministerio de Economia y Finanzas (MEF). Additionally, the real estate sector, especially in Lima, showed robust performance, with housing sales increasing by 28% during the first two months of the year. Cement demand also rose for significant infrastructure projects, such as Line 2 of Lima’s Metro, as recognized investments in transportation projects through Public-Private Partnerships (PPPs) grew by 4% during 1Q25, according to figures from the regulatory agency Ositran (Organismo Supervisor de la Inversión en Infraestructura de Transporte de Uso Público).
For April, we anticipate that cement consumption will likely be lower than in March, and it could even approach levels similar to April 2024, considering that this April had two fewer working days compared to April 2024. Furthermore, there is a base effect to consider, as April 2023’s consumption was the second highest in H1-24. Finally, based on the results from 1Q25, we are maintaining our growth projection of 3% for the end of 2025, a rate that would exceed the modest growth observed in 2024.
—Carlos Asmat
DISCLAIMER
This report has been prepared by Scotiabank Economics as a resource for the clients of Scotiabank. Opinions, estimates and projections contained herein are our own as of the date hereof and are subject to change without notice. The information and opinions contained herein have been compiled or arrived at from sources believed reliable but no representation or warranty, express or implied, is made as to their accuracy or completeness. Neither Scotiabank nor any of its officers, directors, partners, employees or affiliates accepts any liability whatsoever for any direct or consequential loss arising from any use of this report or its contents.
These reports are provided to you for informational purposes only. This report is not, and is not constructed as, an offer to sell or solicitation of any offer to buy any financial instrument, nor shall this report be construed as an opinion as to whether you should enter into any swap or trading strategy involving a swap or any other transaction. The information contained in this report is not intended to be, and does not constitute, a recommendation of a swap or trading strategy involving a swap within the meaning of U.S. Commodity Futures Trading Commission Regulation 23.434 and Appendix A thereto. This material is not intended to be individually tailored to your needs or characteristics and should not be viewed as a “call to action” or suggestion that you enter into a swap or trading strategy involving a swap or any other transaction. Scotiabank may engage in transactions in a manner inconsistent with the views discussed this report and may have positions, or be in the process of acquiring or disposing of positions, referred to in this report.
Scotiabank, its affiliates and any of their respective officers, directors and employees may from time to time take positions in currencies, act as managers, co-managers or underwriters of a public offering or act as principals or agents, deal in, own or act as market makers or advisors, brokers or commercial and/or investment bankers in relation to securities or related derivatives. As a result of these actions, Scotiabank may receive remuneration. All Scotiabank products and services are subject to the terms of applicable agreements and local regulations. Officers, directors and employees of Scotiabank and its affiliates may serve as directors of corporations.
Any securities discussed in this report may not be suitable for all investors. Scotiabank recommends that investors independently evaluate any issuer and security discussed in this report, and consult with any advisors they deem necessary prior to making any investment.
This report and all information, opinions and conclusions contained in it are protected by copyright. This information may not be reproduced without the prior express written consent of Scotiabank.
™ Trademark of The Bank of Nova Scotia. Used under license, where applicable.
Scotiabank, together with “Global Banking and Markets”, is a marketing name for the global corporate and investment banking and capital markets businesses of The Bank of Nova Scotia and certain of its affiliates in the countries where they operate, including; Scotiabank Europe plc; Scotiabank (Ireland) Designated Activity Company; Scotiabank Inverlat S.A., Institución de Banca Múltiple, Grupo Financiero Scotiabank Inverlat, Scotia Inverlat Casa de Bolsa, S.A. de C.V., Grupo Financiero Scotiabank Inverlat, Scotia Inverlat Derivados S.A. de C.V. – all members of the Scotiabank group and authorized users of the Scotiabank mark. The Bank of Nova Scotia is incorporated in Canada with limited liability and is authorised and regulated by the Office of the Superintendent of Financial Institutions Canada. The Bank of Nova Scotia is authorized by the UK Prudential Regulation Authority and is subject to regulation by the UK Financial Conduct Authority and limited regulation by the UK Prudential Regulation Authority. Details about the extent of The Bank of Nova Scotia's regulation by the UK Prudential Regulation Authority are available from us on request. Scotiabank Europe plc is authorized by the UK Prudential Regulation Authority and regulated by the UK Financial Conduct Authority and the UK Prudential Regulation Authority.
Scotiabank Inverlat, S.A., Scotia Inverlat Casa de Bolsa, S.A. de C.V, Grupo Financiero Scotiabank Inverlat, and Scotia Inverlat Derivados, S.A. de C.V., are each authorized and regulated by the Mexican financial authorities.
Not all products and services are offered in all jurisdictions. Services described are available in jurisdictions where permitted by law.