- Colombia: BanRep Survey—Inflation expectations increased slightly, and economists expect a rate cut in April; February’s retail sales increased while manufacturing was affected by calendar effects
- Peru: Lower GDP growth in February reflects special events, not a change in trend
COLOMBIA: BANREP SURVEY—INFLATION EXPECTATIONS INCREASED SLIGHTLY, AND ECONOMISTS EXPECT A RATE CUT IN APRIL
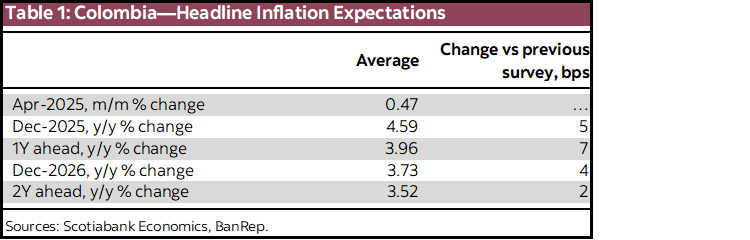
The Central Bank (BanRep) released its survey of economists’ expectations for April late on Monday. Inflation expectations increased modestly after the downside surprise on March’s inflation reading. For Dec-2025, headline inflation expectation increased 5 bps to 4.59%, between a one- and two-year window; it is expected to fluctuate in the upper side of BanRep’s target range (defined between 2% and 4%). Previous results are lower compared with the path expected by Scotiabank Colpatria as we estimate year-end inflation at 4.96% and inflation achieving the target range again in the last quarter of 2026, closing at 3.90% vs. consensus expectation of 3.73%. In the short term, the inflation expectation for April is 0.47%, which takes headline annual inflation to 4.97%. Scotiabank Colpatria’s projection is 0.50% m/m and 5.0% y/y. April’s result will allow inflation to resume a downtrend in the forthcoming months. However, we expect to see a new interruption in this dynamic during the second half of the year as a result of a low statistical base.
Regarding monetary policy, analysts expect a 25bps cut at the April 30th meeting. In its last monetary policy decision, the BanRep board of directors decided to keep the rate stable at 9.50%, maintaining a cautious approach as the spike in inflation was a concern. They also highlighted the uncertainty of the international scenario and its effects on key variables, such as the exchange rate, all in a context of uncertainty around domestic public finances. Ahead of April’s meeting BanRep has a positive piece of news with the reduction in inflation and relative stability on inflation expectation; as a headwind, we see the FX depreciation triggered by the international turmoil. However, we see that in the case of Colombia, the impact could be limited, and in that regard, the monetary policy could have a space to provide some impulse in cutting the interest rate. For Dec-2025, inflation expectations are at 8%, and for Dec-2026, it is at 6.75%. Scotiabank Colpatria has the same expectation.
Regarding the exchange rate, the consensus revised its outlook to the upside in 2025, however expect a reverse in 2026. For December 2025, analysts estimate an exchange rate of 4,302 pesos, above previous estimate of 4,267.35 pesos. For 2026, the expectation was revised to the downside to 4,176 pesos versus the previous forecast of 4,202.76 pesos. Scotiabank Colpatria’s projection for 2025 is 4,367 pesos, and for 2026, 4,364 pesos.
Key points from the survey
- Short-term inflation expectations. For April, the consensus is 0.47% m/m, implying annual inflation of 4.97% y/y, lower than the current 5.09%. The maximum expectation is 0.59% and the minimum is 0.29%, showing a moderate dispersion. Scotiabank Colpatria Economics’ projection is 0.50% m/m and 5.0% y/y. Core inflation, excluding food, projected by analysts is 0.40% m/m and 5.12% y/y.
- Medium-term inflation expectations. Inflation expectations for December 2025 rose 5 basis points to 4.59% (table 1). The expectation for a 1-year horizon increased by 7 bp to 3.96%, and expectations for 2 years increased by 2 bp to 3.52% (chart 1). Scotiabank Colpatria expectations are above market consensus, however our skew is mainly explained by strong indexation effects of the minimum salary reflected on services prices, especially housing-related expenses. On the other side, our forecast does not include a significant impact from the FX depreciation as historically, this effect has been mild and, at this time, is not coinciding with an extra episode that could magnify its effect.
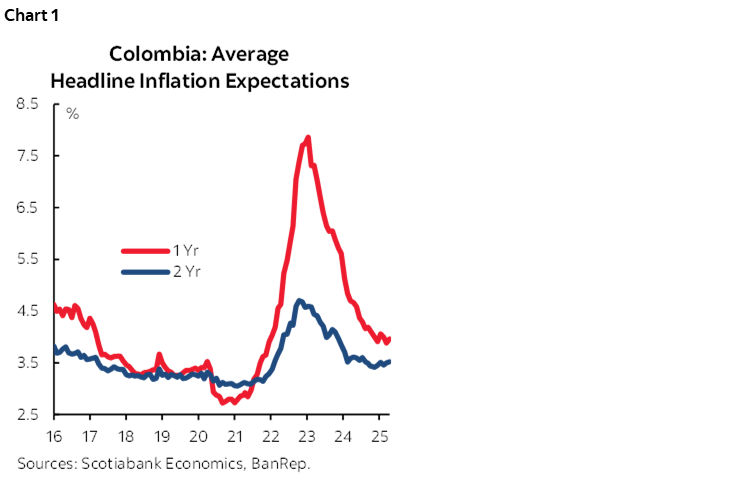
- Monetary policy rate. The median of expectations is for a 25 basis point cut at the April 30th meeting, which would leave a rate of 9.25%. For 2025, the rate is estimated to fall to 8%, which is assuming a continue path of cuts of 25 bps each meeting (chart 2).
- FX. Projections for the US dollar exchange rate for the end of 2025 averaged 4,302 pesos (35 pesos less than the previous survey). By December 2026, respondents, on average, expect a rate change of 4,176 pesos.
—Jackeline Piraján
FEBRUARY’S RETAIL SALES INCREASED WHILE MANUFACTURING WAS AFFECTED BY CALENDAR EFFECTS
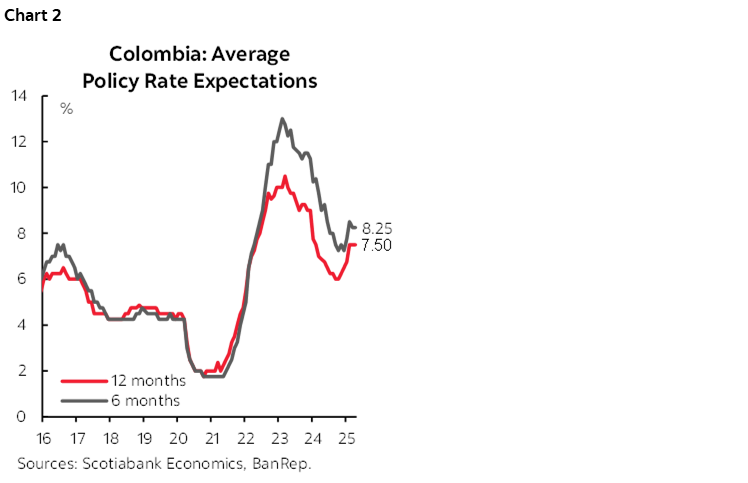
On Tuesday, April 15th, the National Institute of Statistics (DANE) published the manufacturing production and retail sales data for February 2025. Manufacturing production decreased -1.2% y/y, below market expectation of +1.7% y/y, and, retail sales increased 7.5% y/y, in line with markets’ expectation. February’s result is partially due to a calendar effect, as 2024 was a leap year with an additional working day; therefore, the seasonally adjusted data showed a 1.4% y/y expansion in manufacturing production. The recovery in retail sales due to the surge of the demand for durable and semi-durable goods could announce the beginning of a new cycle. However, it is important to monitor how the demand continues recovering and the negative effects due to the FX depreciation which could have some impact on imported prices, at the same time when some services prices are showing sticky high inflation.
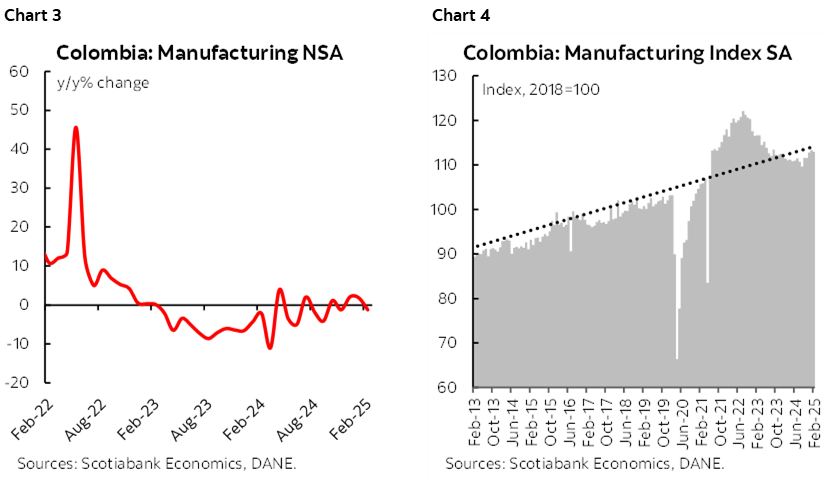
Manufacturing output fell by 1.2% y/y explained by calendar effects (chart 3 and chart 4). February results showed a negative performance in the manufacturing sector compared to the previous year (-2.2% y/y). However, the seasonally adjusted data showed a +1.4% y/y expansion, which suggest that the contraction in the original data is due to the additional working day last year; however, we saw a 0.3% m/m contraction. In this context, oil and fuel industry, beverage, mineral and pharmaceutical products, explained the negative performance. On the other hand, chemicals, transport equipment and coffee offset the decline during this period.
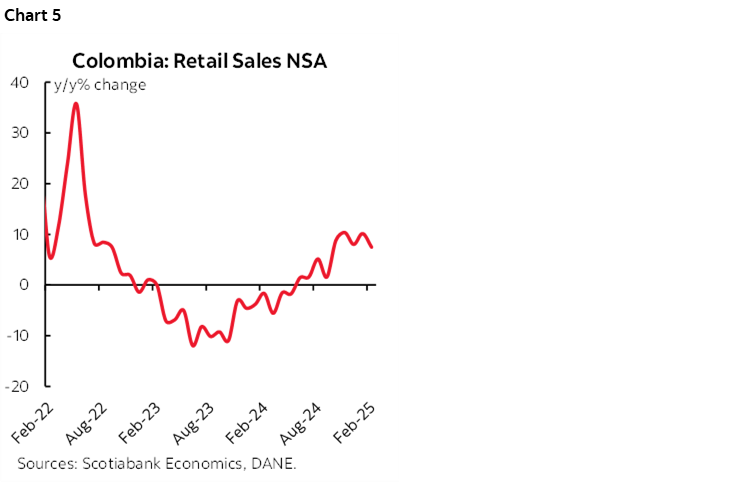
Retail sales continued their positive trend for the ninth consecutive month, showing a significant expansion (chart 5). In February, retail sales increased by 7.5% y/y, explained by strong telecommunications equipment sales, vehicle sales, and durable goods such as furniture, which together explained 77% of total growth. It is important to highlight the increase in the textile sector since January after almost two years of contraction, but this could be explained by a base effect due to the 12.1% y/y drop in February 2024. The positive performance in retail sales could be attributed to the price stability of tradable goods for many months and the impact of the FX performance, which showed an appreciation of 6.0% until February. In contrast, fuel, alcoholic and non-alcoholic beverages were the sectors which registered a drop in the period.
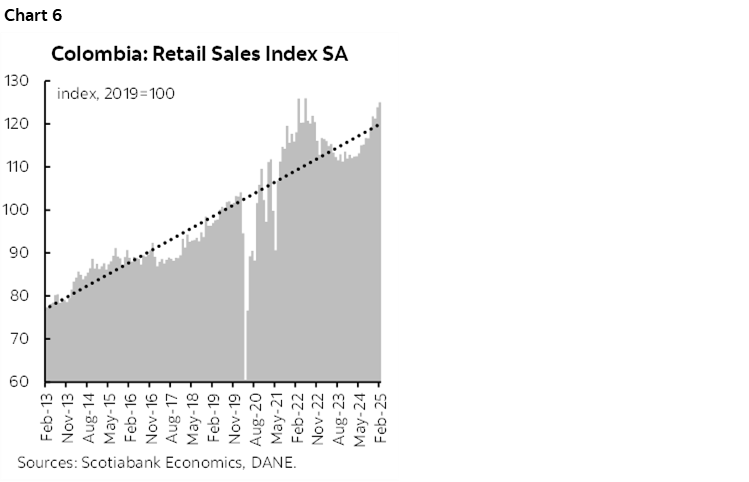
In monthly seasonal adjustment terms, retail sales in February (excluding other vehicles) increased by 0.9% m/m. This result offers further signs of the start of a new cycle (chart 6) in which commerce is expected to drive economic growth in 2025.
On Monday, April 21st, the general picture of economic activity in February 2025 will be released with the publication of the Economic Activity Index. However, it will be relevant to monitor whether the sectors that had a positive dynamic during the first half of 2024 would lose traction due to transitory effects in agriculture and public administration restricted by a tight fiscal position. All in all, despite the economic performance at the beginning of 2025 being a reason for the central bank to maintain caution, there are economic fundamentals that increase the probability of a return to the easing cycle. At Scotiabank Colpatria, the expectation is that the central bank will cut the interest rate to 9.25% during the monetary meeting on April 30th.
Key Highlights:
- Manufacturing production decrease 1.2% y/y. 17 of the 39 activities showed annual contraction. On the negative side, oil and fuel industry (-13.3 y/y), the beverage industry (-6.0% y/y), mineral (-7.0% y/y), the pharmaceutical industry (-7.0% y/y), and paper and cardboard production (-7.5% y/y) were the main sectors driving the negative outcome for the month, collectively contributing -2.7 p.p. On the positive side, the chemical industry (+11.5% y/y), transport equipment (+30.8% y/y), and coffee (+62.9% y/y) contributed +0.8 p.p. to the result.
- Retail sales grew 7.5% y/y. 16 of the 19 activities registered positive variations. Telecommunication equipment sales (+45.1% y/y), vehicle sales (+20.6% for household vehicles and +19.2% for other vehicles), and durable goods such as furniture (+18.4% y/y) were the ones that contributed the most to retail sales growth. Something to highlight is the increase in textile sector sales since January (+4.4% y/y) after almost two years of contraction. Meanwhile, on the negative side, fuel (-3.1% y/y) and alcoholic and non-alcoholic beverages (-5.8% y/y and -3.0% y/y) offset the result.
- From March 2024 to February 2025, retail sales expanded by +3.9% y/y where the sales of textile products experienced the greatest deterioration with a drop of 8.5%, while the sales of telecommunications equipment, the ones that have had the best contribution to the result with an expansion of +24.7%. Furthermore, the industry output dropped -1.5% y/y explained by the pharmaceutical industry (-8.8% y/y), minerals industry (-7.7% y/y), and oil and fuel production (-5.0% y/y). In contrast, transport equipment (+28.4%) and the cleaning industry (+3.7% y/y) maintain a positive contribution in the indicator.
—Jackeline Piraján & Valentina Guio
PERU: LOWER GDP GROWTH IN FEBRUARY REFLECTS SPECIAL EVENTS, NOT A CHANGE IN TREND
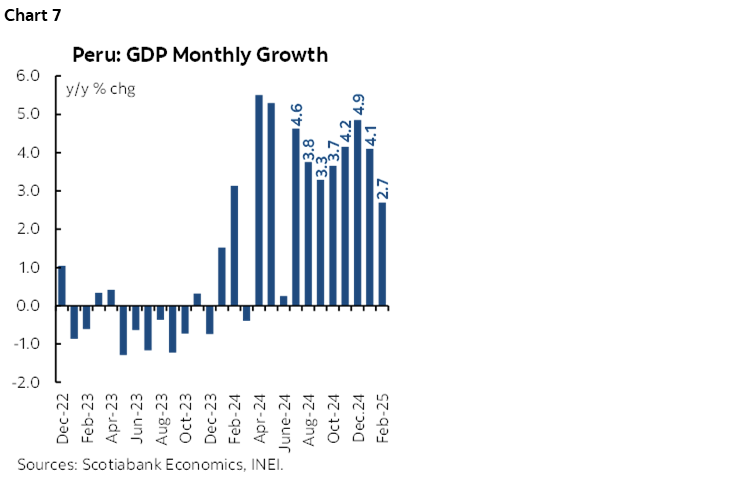
Peru GDP rose a modest 2.7%, YoY, in February, which compares unfavourably with the 4.2% average growth of the previous four months (chart 7). Moreover, MoM growth in February was -0.1%. It would be grossly premature to be worried, however, as low growth in February largely reflected the fact that February last year was a leap year, so, in comparison, there was one less day in 2025. This was enough to take growth off trend.
What slower growth in February decidedly did not reflect was an impact stemming from global trade and tariff concerns. The impact of recent US tariff policy is not likely to be felt for, perhaps, a couple of quarters yet.
Construction and agriculture growth figures were two significant positives in February sector data (table 2). Construction GDP rose a robust 5.9%, YoY. This was a sector that had lagged the economy throughout 2024, and it is encouraging that it is now leading with conviction. Construction was even up 1.6% in MoM terms, even though February is such a short month compared to January. Much of construction growth was due to public investment, certainly, but there are increasing signs that the private sector is also starting to contribute.

Agriculture GDP rose 5.5%, YoY. In part, the weather has been fine. But, more significantly, it’s the export of agroindustrial goods that is leading growth. Peru’s agroindustrial sector exports heavily to the US, and February’s figure is pre-tariffs. We await with trepidation to see if agroindustry continues to outperform once tariffs are triggered in April.
Sectors that showed negative growth, mining, industrial manufacturing and electricity, were also the most vulnerable to less working days. We note, however, that industrial manufacturing has been weakish for a couple of months now, so we’ll need to monitor the sector to see if this reflects a temporary post-Christmas seasonal phenomenon, or if there is more to it.
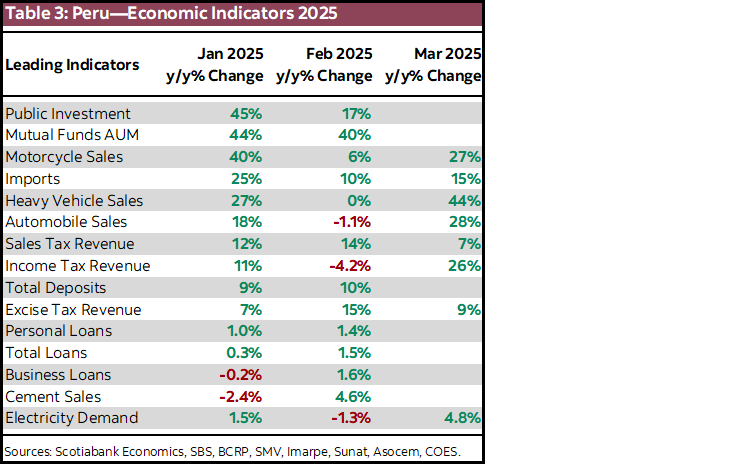
Looking forward, GDP growth in March is likely to surpass 4.0% handily, although this too will reflect a calendar issue, due to the switch of Easter vacations from March in 2024 to April in 2025. Leading indicators for March are coming in much more strongly than was the case for February (table 3). March is also still too soon to feel the impact of the worldwide tariff wars. Moreover, GDP growth continues to find support in the unexpectedly strong performance of global copper and gold prices. The longer high metal prices persist, the longer Peru’s healthy growth trend will be able to continue.
—Guillermo Arbe
DISCLAIMER
This report has been prepared by Scotiabank Economics as a resource for the clients of Scotiabank. Opinions, estimates and projections contained herein are our own as of the date hereof and are subject to change without notice. The information and opinions contained herein have been compiled or arrived at from sources believed reliable but no representation or warranty, express or implied, is made as to their accuracy or completeness. Neither Scotiabank nor any of its officers, directors, partners, employees or affiliates accepts any liability whatsoever for any direct or consequential loss arising from any use of this report or its contents.
These reports are provided to you for informational purposes only. This report is not, and is not constructed as, an offer to sell or solicitation of any offer to buy any financial instrument, nor shall this report be construed as an opinion as to whether you should enter into any swap or trading strategy involving a swap or any other transaction. The information contained in this report is not intended to be, and does not constitute, a recommendation of a swap or trading strategy involving a swap within the meaning of U.S. Commodity Futures Trading Commission Regulation 23.434 and Appendix A thereto. This material is not intended to be individually tailored to your needs or characteristics and should not be viewed as a “call to action” or suggestion that you enter into a swap or trading strategy involving a swap or any other transaction. Scotiabank may engage in transactions in a manner inconsistent with the views discussed this report and may have positions, or be in the process of acquiring or disposing of positions, referred to in this report.
Scotiabank, its affiliates and any of their respective officers, directors and employees may from time to time take positions in currencies, act as managers, co-managers or underwriters of a public offering or act as principals or agents, deal in, own or act as market makers or advisors, brokers or commercial and/or investment bankers in relation to securities or related derivatives. As a result of these actions, Scotiabank may receive remuneration. All Scotiabank products and services are subject to the terms of applicable agreements and local regulations. Officers, directors and employees of Scotiabank and its affiliates may serve as directors of corporations.
Any securities discussed in this report may not be suitable for all investors. Scotiabank recommends that investors independently evaluate any issuer and security discussed in this report, and consult with any advisors they deem necessary prior to making any investment.
This report and all information, opinions and conclusions contained in it are protected by copyright. This information may not be reproduced without the prior express written consent of Scotiabank.
™ Trademark of The Bank of Nova Scotia. Used under license, where applicable.
Scotiabank, together with “Global Banking and Markets”, is a marketing name for the global corporate and investment banking and capital markets businesses of The Bank of Nova Scotia and certain of its affiliates in the countries where they operate, including; Scotiabank Europe plc; Scotiabank (Ireland) Designated Activity Company; Scotiabank Inverlat S.A., Institución de Banca Múltiple, Grupo Financiero Scotiabank Inverlat, Scotia Inverlat Casa de Bolsa, S.A. de C.V., Grupo Financiero Scotiabank Inverlat, Scotia Inverlat Derivados S.A. de C.V. – all members of the Scotiabank group and authorized users of the Scotiabank mark. The Bank of Nova Scotia is incorporated in Canada with limited liability and is authorised and regulated by the Office of the Superintendent of Financial Institutions Canada. The Bank of Nova Scotia is authorized by the UK Prudential Regulation Authority and is subject to regulation by the UK Financial Conduct Authority and limited regulation by the UK Prudential Regulation Authority. Details about the extent of The Bank of Nova Scotia's regulation by the UK Prudential Regulation Authority are available from us on request. Scotiabank Europe plc is authorized by the UK Prudential Regulation Authority and regulated by the UK Financial Conduct Authority and the UK Prudential Regulation Authority.
Scotiabank Inverlat, S.A., Scotia Inverlat Casa de Bolsa, S.A. de C.V, Grupo Financiero Scotiabank Inverlat, and Scotia Inverlat Derivados, S.A. de C.V., are each authorized and regulated by the Mexican financial authorities.
Not all products and services are offered in all jurisdictions. Services described are available in jurisdictions where permitted by law.