Latam Economic Update
Central banks & macro data: Rate decisions in Chile, Colombia; July data roll in
Argentina: Restructuring results expected as wealth tax proposed and IMF talks requested
Chile: Employment rate falls to 45% in July from 58% pre-COVID-19
Peru: Ministry of Finance presents its economic policy framework and 2021 budget
CENTRAL BANKS & MACRO DATA: RATE DECISIONS IN CHILE, COLOMBIA; JULY DATA ROLL IN
I. Central banks: Final cuts expected in Chile and Colombia
- Chile. The monetary policy committee (MPC) of the BCCh meets on Tuesday, September 1 and consensus expects the MPC to keep the headline policy rate at the current “technical minimum” of 0.50%. Although economic activity is rebounding and is aligning with the relatively robust -6% y/y contraction in real GDP we forecast for 2020 (see our August 22 Latam Weekly), our team in Santiago has anticipated a possible -25 bps cut to the monetary policy rate to 0.25%, with the case for a lower rate floor to be laid out in the BCCh’s quarterly Monetary Policy Report (Informe de Política Monetaria, IPoM) that is due to be published on Wednesday, September 2.
- Colombia. The BanRep Board is scheduled to announce its next monetary policy decision at 14:00 ET today; both our team in Bogota and the consensus anticipate a final -25 bps cut from 2.25% to 2.00%. While the Board could repeat its indication that some limited room for additional easing remains, the Board’s data-dependent stance implies that further cuts aren’t likely at this point. The meeting’s Minutes are set to be released on Tuesday, September 1.
II. Macro data: July data roll in
Market events and indicators for the week ahead are detailed in the risk calendar at the back of our August 22 Latam Weekly. Highlights include:
- GDP and monthly economic activity. Brazil Q2 GDP data arrive on Tuesday, September 1, while the monthly proxy is published the same day in Chile.
- Inflation. July CPI numbers come out for Peru (Tuesday, Sep. 1) and Colombia (Saturday, Sep. 5) and inflation is expected to continue moderating in both countries.
- Fiscal. Brazil’s July primary budget balance comes out today at 08:30 while the FY2021 budget proposal deadline also falls today. Argentina’s monthly tax revenue numbers for August print on Wednesday, September 2.
- Industrial activity. IP and/or manufacturing data arrive for July in Argentina (Wednesday, Sep. 2), Brazil (Thursday, Sep. 3), and Chile (Monday, Aug. 31). Mexico’s August PMIs are scheduled to be released on Tuesday, September 1.
- Additionally, Mexico’s July remittances numbers are expected to remain at record levels when they come out on Tuesday, September 1.
—Brett House
ARGENTINA: RESTRUCTURING RESULTS EXPECTED AS WEALTH TAX PROPOSED AND IMF TALKS REQUESTED
The Ministry of Economy is expected to announce today participation rates in Argentina’s external debt restructuring. The offer period on the exchange closed on Friday, August 28 and the swap is schedule to be executed on Friday, September 4. The domestic debt swap is set to follow mid-month.
Meanwhile, Friday saw the ruling coalition introduce a bill to the lower house of Congress that would impose a one-time “solidarity” tax on Argentina’s wealthiest citizens. The possible tax would apply to Argentines with more than ARS 200 mn
(USD 2.7 mn) in assets and would scale up to a maximum of 5.25%. The government estimates the tax could generate up to ARS 300 bn in tax revenue and would play a role in closing the fiscal gap that is now wider than forecast in the IMF’s March debt-sustainability analysis (DSA).
Economy Minister Guzman sent a formal letter last week to the IMF to request the re-initiation of talks on a new lending and adjustment program. Discussions are likely to begin imminently.
—Brett House
CHILE: EMPLOYMENT RATE FALLS TO 45% IN JULY FROM 58% PRE-COVID-19
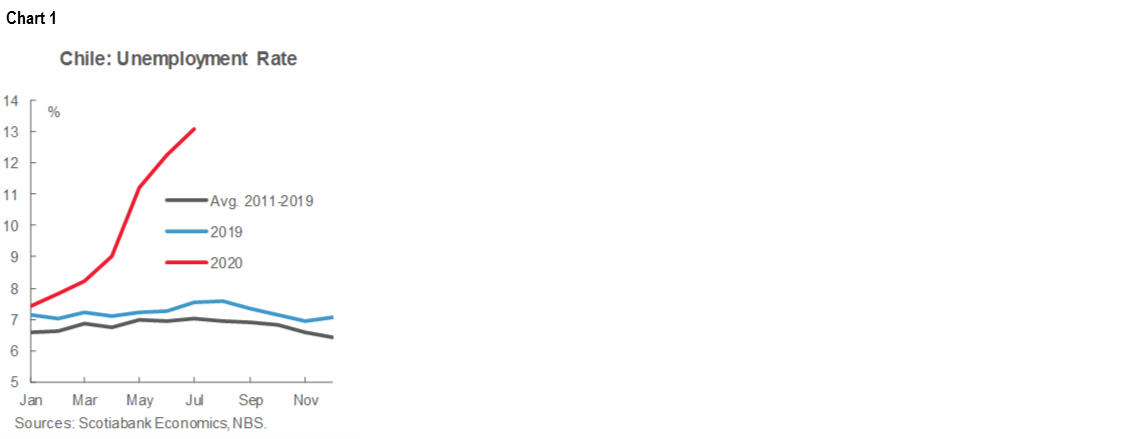
Labour market close to its low, with risks of a slow recovery. In data out Friday, August 28, the unemployment rate stood at 13.1% in the May–July moving quarter, somewhat above what was expected by consensus (12.8%). This print was affected by a significant drop in employed workers and only partially mitigated by a new drop in the active labour force (chart 1). Indeed, the population outside the labour force increased 31.8% y/y, showing that a growing percentage of people of the age and ability to work were not looking for a job given the public-health situation.
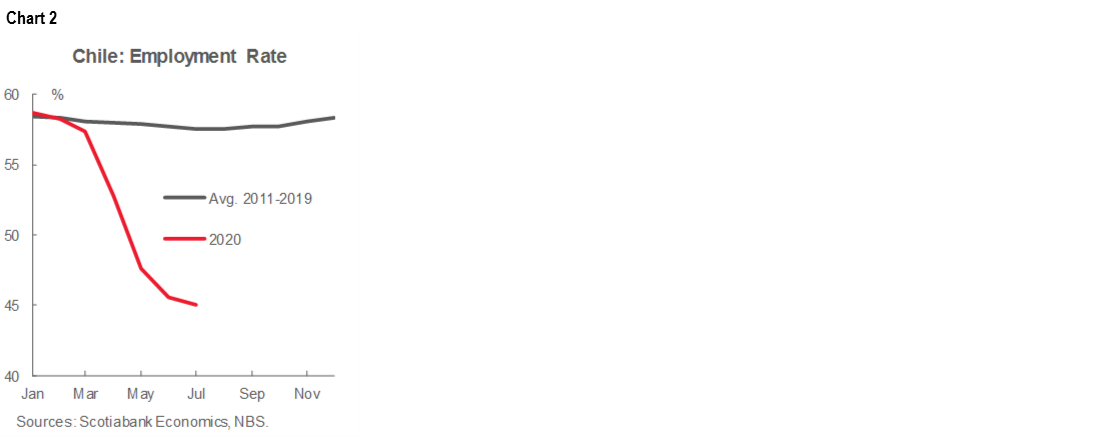
The employment rate fell to 45%, compared to levels of around 58% at the beginning of the year, and a potential of around 57% for the same period in previous years (chart 2).
A very likely scenario during the coming months is that the unemployment rate remains high and may even experience an increase despite better activity numbers. The labour market will lag behind growth in activity and greater degrees of re-opening measures at the national level. Many people could return actively to seeking work (increasing the workforce), but they may not quickly find available positions. In this context, we continue to think that the health of the labour market must be evaluated by indicators of people employed at the sectoral level, rather than by the unemployment rate. According to the National Bureau of Statistics’ (NBS) own calculations, the potential unemployment rate (which includes the potential workforce) could be around 30.2%.
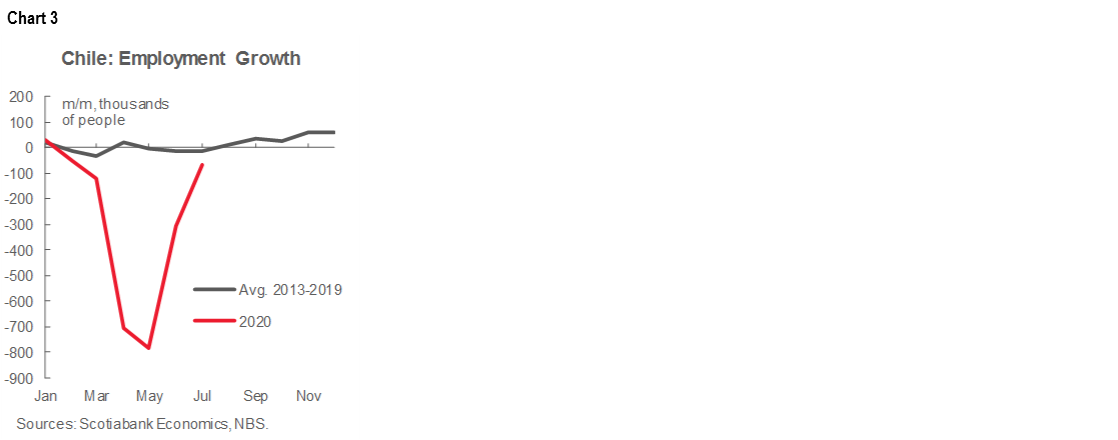
The good news came from lower job destruction, which showed that the worst of the lockdown’s labour-market effects have been left behind. Indeed, the number of people employed in July revealed destruction of 1.84 mn jobs compared to what was registered in July of last year (-20.6% y/y). However, the monthly sequence shows that the deterioration in employment continued to moderate at the margin, although we were not yet back into net new job creation territory in July (chart 3). It cannot be ruled out that some slight new job creation could be observed next month, given that the process of lifting confinement measures began at the end of July and was extended in August.
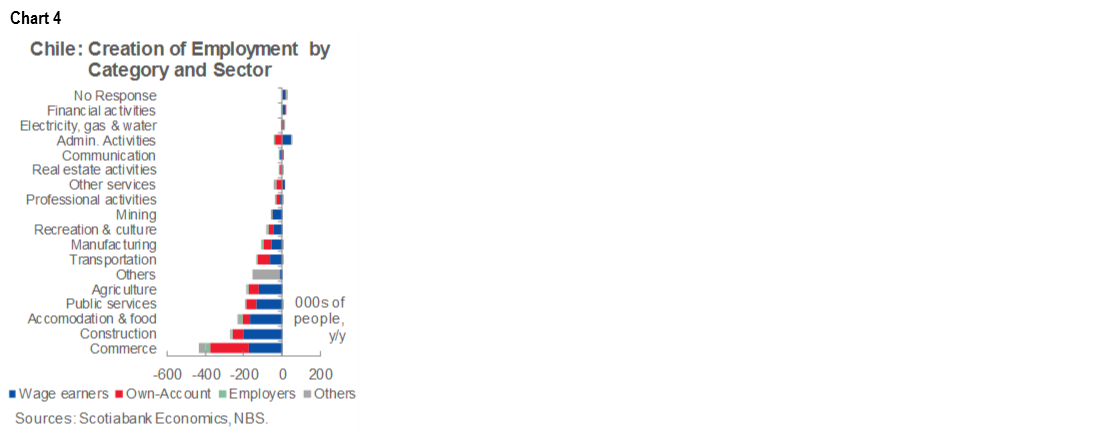
Job destruction continued to be concentrated amongst private wage-earners, predominantly employed in services, while commerce saw a concentration self-employed (i.e., “own account”) positions lost (chart 4). The sectors that showed the greatest loss of employment continued to be commerce, followed by construction, accommodation and food services, and public services.
—Jorge Selaive
PERU: MINISTRY OF FINANCE PRESENTS ITS ECONOMIC POLICY FRAMEWORK AND 2021 BUDGET
Substantial developments have come out over the past few days. Recent events include:
- The government extended the State of Emergency another month, until the end of September. This means the lockdown will continue on Sundays and to varying degrees in certain regions of the country.
- Finance Minister María Alva gave an overview of the government’s plans and budget forecasts on August 27. This was a preview of the Multiannual Macroeconomic Framework.
- On August 28, the government released the Multiannual Macroeconomic Framework (Marco Macroeconómico Multianual, MMM). This is a detailed guideline on the government’s views, plans, programs and budgets over a horizon from 2021 to 2024.
- On August 30, the government delivered to Congress the fiscal budget for 2021.
- As for upcoming events, Finance Minister Alva has been called for questioning before Congress on both September 4 and September 7.
This is a lot of information to digest.
I. Budget for 2021
Starting with the budget, the government submitted a PEN 183 bn (USD 51.8 bn) budget for 2021. This is 3.2% greater than the 2020 budget. Congress has 48 hours to call for a special session for Minister Alva to explain the budget. Congress then has until the end of November to analyze and approve it. In the past, Congress has introduced relatively minor changes, normally in coordination with the Ministry of Finance. It is less clear how the current Congress will behave.
II. Multiannual Macroeconomic Framework
The budget is submitted within the broader view provided by the Multiannual Macroeconomic Framework (Marco Macroeconómico Multianual, MMM), which gave a more in-depth vision of the government’s intentions on economic policy. The following highlights are based on both the Framework document and Minister Alva’s presentation of the document. In her presentation, Minister Alva outlined additional colour and emphases that are not as evident in a reading of the Framework.
- The Ministry of Economy and Finance (MEF) expects a -12% y/y contraction in GDP in 2020, which is broadly in line with our -11.5% GDP growth forecast. Outside of possible mild tweaking, we do not foresee a change to our growth forecasts based on the new information provided.
- Of the -12% contraction, 8.4 percentage points already took place in H1-2020, when GDP fell -17.4% y/y.
- The government is forecasting a 10.0% y/y rebound in GDP in 2021, compared to our 8.7%.
- The MEF sees average GDP growth of 4.5% in the 2022-2024 period.
- The fiscal situation that the MMM paints is of some concern in terms of magnitudes, although with few real conceptual surprises. The MEF expects fiscal deficits of -10.7% of GDP in 2020, and -6.2% in 2021. The figures surpass our expectations of -8.7% of GDP and -5.0% of GDP, respectively.
- A key factor in the MEFs fiscal account is fiscal revenue. The MEF expects a -21% y/y decline in 2020 in PEN terms, representing a -2.2% decline in GDP terms. This is a pretty big hole to fill.
- The government expects a 17.4% increase in fiscal spending, or 6.1% of GDP. A part of this increase was from the pre-COVID-19 budget, so it’s not all pandemic-related.
- The MEF now puts its Economic Recovery Plan at 20% of GDP. Of course, this includes not only fiscal resources, but tax benefits, monetary resources and private resources (e.g. pension funds). However, the MMM states that actual public sector expenditure represents 4.6% of GDP and tax benefits represent 2.3% of GDP. Thus, 6.9% of GDP, out of the -10.7% of GDP deficit the government forecasts, would be directly linked to government emergency measures. If one adds to this a -2% pre-COVID-19 deficit, than one can assume that about 1.8% of GDP comes from a drop in revenue due to the contraction of the economy.
- For 2021, the government expects a -6.2% of GDP deficit, thanks largely to a 20.2% increase in fiscal revenue (reaching 19.4% of GDP). Spending will be mixed, with public investment up 22.0%, but current fiscal spending falling -6.8%, as emergency programs cease. The result is that government spending declines from 26.2% of GDP in 2020 to 23.4% in 2021.
- One question that the MMM answers is the path the MEF foresees to return to fiscal normalcy. The government hopes to see the deficit subside to 3.3% of GDP in 2022, and from there slip progressively towards 1.0% by 2026. The MEF expects public sector debt to rise to 35.4% of GDP in 2020, and then keep rising, peaking at 39.1% of GDP in 2023, before tapering off.
- The MEF itself apparently only partially believes its numbers, and adds the disclaimer that the final data will depend on the impact of COVID-19 on public finances. Our view is that the crucial aspect in the trend of public finances will not be government and/or Congressional spending initiatives, but how quickly fiscal revenue recovers.
- On the plus side, the MEF expects terms of trade to be moderately favourable to Peru in both 2020 and 2021. However, the metal prices they are using are below current price levels, which gives upside to their fiscal forecasts.
- What is clear is that what the government terms fiscal “convergence” will not to begin until 2022. Minister Alva has mentioned that this convergence would require unspecified “additional tax measures”, which, if not for the question of timing, would be somewhat at odds with her assurances that the government is not contemplating new taxes. Of course, by 2022 there will be another government in place, which makes all forecasts between 2021 and 2024 little more than suggestions, albeit suggestions with the strong institutional backing of the MEF.
- Financing needs for 2020 amount to 11.0% of GDP (10.7% deficit plus 0.3% debt amortization). Exactly half of this, 5.5% of GDP, is to be finance through the governments own resources, namely, the Fiscal Stabilization Fund, and other public sector savings. Much of the remainder would come from past and future debt issuances.
- In her presentation, Minister Alva ends with a warning of sorts. The fiscal convergence path is a narrow one, and deviating from it could lead to a higher debt. Alva presented a scenario where the fiscal debt could reach 50% of GDP by 2024. One is not quite sure who the warning is meant for, whether for the next government, the current Congress, or her own cabinet.
The MMM also provided interesting short-term information, which is useful in helping to gauge the extent of the recovery in the rebound in July and August. The information for August was based on sales receipts for tax purposes up to August 18. Highlights include:
- Commerce sales receipts (which includes from bodegas and small markets, to supermarkets and malls): are positive in y/y terms for both July (1.2% y/y) and August (1.7% y/y), which represents a pretty much complete recovery from -60% y/y in April.
- Manufacturing sales receipts were down only -1.8% y/y in August (-7.6% y/y in July), after having also fallen over -60% in April. While still negative, manufacturing appears to be rebounding much faster than we were expecting.
- Both figures add to electricity, which is only -3% down y/y in August, and the surprisingly strong (previously released) rebound in cement sales, which was less than -6% below pre-COVID-19 levels in July.
- Other new figures were more in line with expectations. Sales receipts for services were down an unsurprising -5% y/y in August after -14.7% y/y in July.
- All in all, the information points to an August that continues to show a rebound moderately better than we expected.
—Guillermo Arbe
DISCLAIMER
This report has been prepared by Scotiabank Economics as a resource for the clients of Scotiabank. Opinions, estimates and projections contained herein are our own as of the date hereof and are subject to change without notice. The information and opinions contained herein have been compiled or arrived at from sources believed reliable but no representation or warranty, express or implied, is made as to their accuracy or completeness. Neither Scotiabank nor any of its officers, directors, partners, employees or affiliates accepts any liability whatsoever for any direct or consequential loss arising from any use of this report or its contents.
These reports are provided to you for informational purposes only. This report is not, and is not constructed as, an offer to sell or solicitation of any offer to buy any financial instrument, nor shall this report be construed as an opinion as to whether you should enter into any swap or trading strategy involving a swap or any other transaction. The information contained in this report is not intended to be, and does not constitute, a recommendation of a swap or trading strategy involving a swap within the meaning of U.S. Commodity Futures Trading Commission Regulation 23.434 and Appendix A thereto. This material is not intended to be individually tailored to your needs or characteristics and should not be viewed as a “call to action” or suggestion that you enter into a swap or trading strategy involving a swap or any other transaction. Scotiabank may engage in transactions in a manner inconsistent with the views discussed this report and may have positions, or be in the process of acquiring or disposing of positions, referred to in this report.
Scotiabank, its affiliates and any of their respective officers, directors and employees may from time to time take positions in currencies, act as managers, co-managers or underwriters of a public offering or act as principals or agents, deal in, own or act as market makers or advisors, brokers or commercial and/or investment bankers in relation to securities or related derivatives. As a result of these actions, Scotiabank may receive remuneration. All Scotiabank products and services are subject to the terms of applicable agreements and local regulations. Officers, directors and employees of Scotiabank and its affiliates may serve as directors of corporations.
Any securities discussed in this report may not be suitable for all investors. Scotiabank recommends that investors independently evaluate any issuer and security discussed in this report, and consult with any advisors they deem necessary prior to making any investment.
This report and all information, opinions and conclusions contained in it are protected by copyright. This information may not be reproduced without the prior express written consent of Scotiabank.
™ Trademark of The Bank of Nova Scotia. Used under license, where applicable.
Scotiabank, together with “Global Banking and Markets”, is a marketing name for the global corporate and investment banking and capital markets businesses of The Bank of Nova Scotia and certain of its affiliates in the countries where they operate, including, Scotiabanc Inc.; Citadel Hill Advisors L.L.C.; The Bank of Nova Scotia Trust Company of New York; Scotiabank Europe plc; Scotiabank (Ireland) Limited; Scotiabank Inverlat S.A., Institución de Banca Múltiple, Scotia Inverlat Casa de Bolsa S.A. de C.V., Scotia Inverlat Derivados S.A. de C.V. – all members of the Scotiabank group and authorized users of the Scotiabank mark. The Bank of Nova Scotia is incorporated in Canada with limited liability and is authorised and regulated by the Office of the Superintendent of Financial Institutions Canada. The Bank of Nova Scotia is authorised by the UK Prudential Regulation Authority and is subject to regulation by the UK Financial Conduct Authority and limited regulation by the UK Prudential Regulation Authority. Details about the extent of The Bank of Nova Scotia's regulation by the UK Prudential Regulation Authority are available from us on request. Scotiabank Europe plc is authorised by the UK Prudential Regulation Authority and regulated by the UK Financial Conduct Authority and the UK Prudential Regulation Authority.
Scotiabank Inverlat, S.A., Scotia Inverlat Casa de Bolsa, S.A. de C.V., and Scotia Derivados, S.A. de C.V., are each authorized and regulated by the Mexican financial authorities.
Not all products and services are offered in all jurisdictions. Services described are available in jurisdictions where permitted by law.