- US inflation has skyrocketed since 2020 on surging consumer demand, constrained supply, the switch from services to goods spending, and sharply higher commodity prices.
- High consumer prices, particularly for staples, reduced consumer spending power and pose a risk to US growth, and thus require a response from policymakers.
- An estimated model of the US economy, including the block for total and core inflation, shows the two measures to be quite sensitive to further escalation of logistical problems and increases in commodity prices.
- Despite this, barring a further large and global increase in commodity prices and a significant and persistent global supply chain disruption in the next few months, it is likely that we will see the peak of US inflation in mid-2022, with a gradual easing of price pressures after. Significant risks remain, however, from further escalation in the geopolitical crisis, to un-anchoring of inflation expectations and continued high rental and housing costs boosting inflation.
INTRO
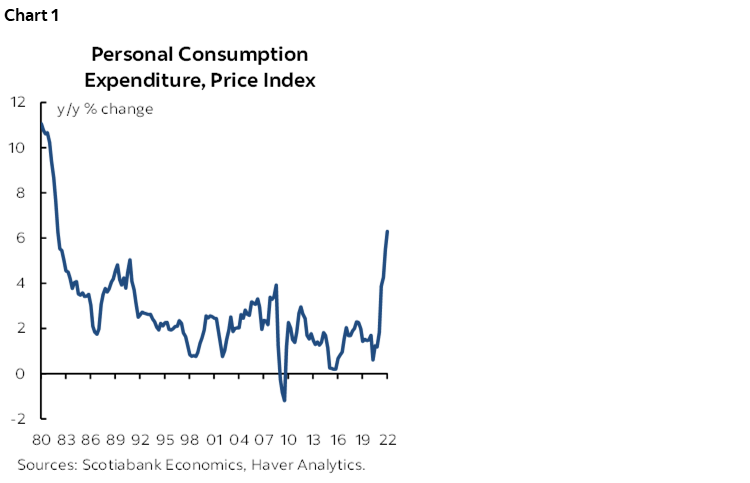
Over the past few years, consumer price inflation in the US has climbed to levels not seen since the early 80s (chart 1). Despite the largest economic contraction on record, consumer prices declined only briefly during the worst of the pandemic in the spring of 2020, rebounding quickly in the second half of that year. However, early 2021 was the beginning of sustained high inflation, with an average quarterly annualized increase over 2021–22 in personal consumption expenditure (PCE) prices of 5.8%, far surpassing the average increases in 2000–19. Once food and energy are excluded from the basket, the so-called core PCE price increases over 2021–22 averaged 4.7% in Q/Q SAAR terms, evidence of broad inflationary pressure.
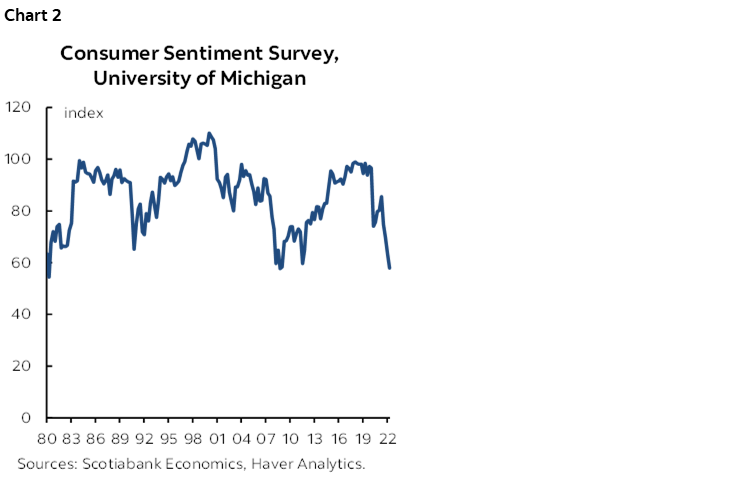
There are few signs that the price increases are slowing so far in 2022. In addition to various pandemic-related factors that contributed to boosting inflation in 2021—from a large shift in demand from the services to the goods sector and the corresponding impact on various commodity prices, to the unprecedented levels of fiscal support to households, to scrambled supply chains due to pandemic-related lockdowns across the globe and in China’s core port cities in particular—the war in Ukraine added rising prices for wheat, oil, natural gas, fertilizers and other commodities. Persistently high inflation was likely one of the factors behind the worsening consumer sentiment, which is currently at a decade low according to the University of Michigan survey (chart 2).
No wonder the policymakers have been paying close attention to the evolution of consumer prices. Having stayed on the sidelines during 2021, debating whether the surge in consumer prices was transitory or persistent, in early 2022 the Federal Reserve acknowledged the broad inflationary wave that was lifting prices across the US economy and threatening to boost inflation expectations in an uncontrolled way. As a result, the Federal Reserve raised the Federal Funds rate to 1.75%, a total of 150bps of tightening over the course of three meetings since early March. In its June 2022 projection materials (see here) the Federal Reserve showed that it expected a relatively fast deceleration in core and total PCE in the second half of 2022 and beyond. Whether this optimism is misplaced will become clear over the remainder of 2022 and 2023, but the signs so far are not very encouraging. The global geopolitical crisis that erupted since Russia’s invasion of Ukraine has already driven prices of food and energy up significantly, with a risk of further increases in prices, from consumer staples to essential industrial and agricultural commodities.
DATA
The additional fuel for the burning inflationary fire can come from a variety of sources, including the continuing excessive strength in economy-wide demand relative to supply, high commodity prices, rising cost of labour and continued or worsening problems with logistics.
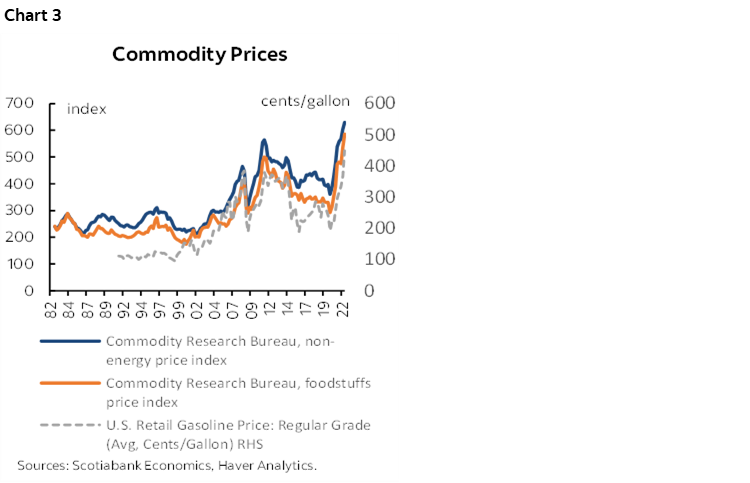
While oil prices, and energy commodity prices more generally, are always in focus when it comes to inflation, recent increases in non-energy commodities have captured attention as well. As prices of food and industrial metals began to rise sharply in the second half of 2020 on a combination of surging demand and supply issues (chart 3), cost increases began to pile up and businesses increasingly passed them on to consumers. Continuing increases in commodity prices would undoubtedly lead to more pressure on profit margins and lead to further increases in consumer prices.
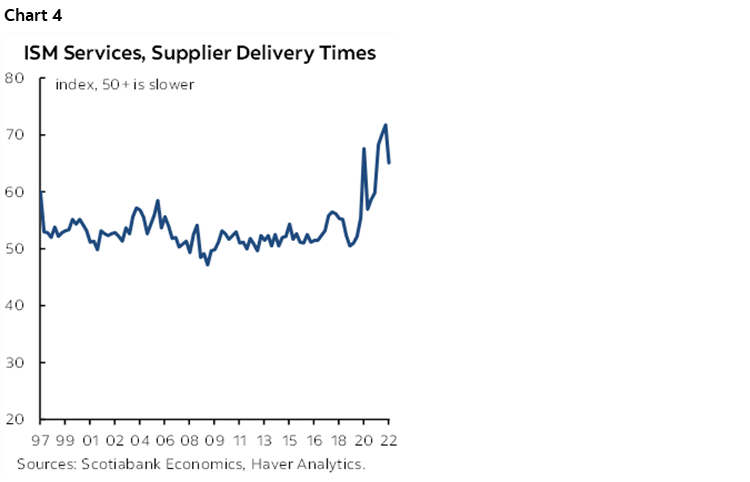
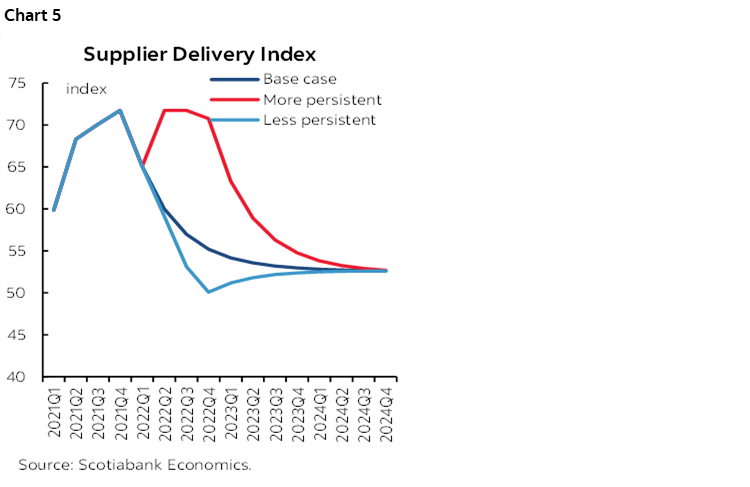
Rising delays for supplier deliveries for any overseas goods, due to scrambled supply chains, added to shortages of goods in stores and higher consumer prices. Supplier delivery issues affected both the goods and the services side of the economy (chart 4). Going forward, improvements in logistics should lead to a rapid decline in the supplier delivery indexes, perhaps below the critical level of 50, which would imply falling delivery times. The supplier delivery index was found to be useful in forecasting inflation in the Canadian context (see Lalonde, Perevalov, 2022 link).
In addition, estimates of the US excess demand (the output gap, or the gap between the level of GDP and potential), as well as unit labour costs would indicate the extent to which broad inflationary pressure in core consumer prices (excluding food and energy) is likely to be sustained.
ESTIMATION
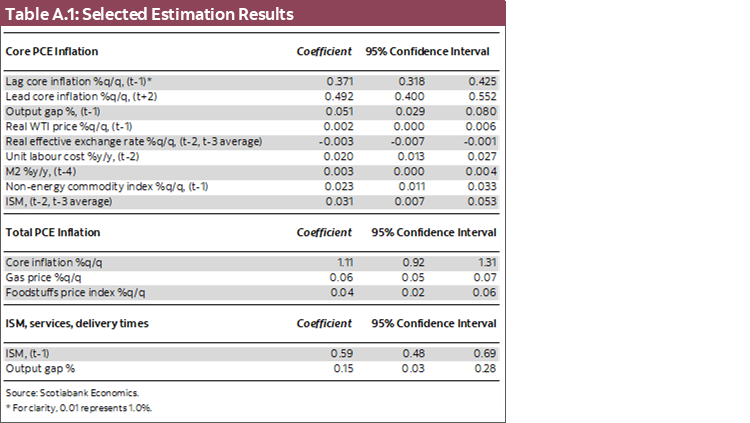
It is relatively easy to build a narrative where the drivers listed above led to increases in input prices, shortages of products and strong demand since 2020, spurring inflation higher. However, to assess these linkages quantitatively requires a model that can be confronted with data using an econometric procedure. To this end, I estimate a general equilibrium model that includes an equation for core PCE q/q inflation (a modified Phillips curve), an equation linking the total PCE q/q inflation to core inflation, as well as the interest rate reaction function (Taylor rule) and an equation for GDP (IS curve). The estimation is done by using Bayesian methods over 1987–2019. It is worth noting that the Canadian PMI-augmented Phillips curve estimation, using a similar specification (Lalonde, Perevalov 2022) was robust to including or excluding the pandemic period.
The estimated coefficients in the Phillips curve show that there is a statistically significant pass-through from energy and non-energy commodity prices and supplier delivery times to core PCE inflation. Total PCE inflation, which includes energy and food prices, follows very closely core inflation that excludes the latter components, but reacts strongly to changes in gas and food prices. See the appendix for more details.
SCENARIOS
Having seen price inflation rise sharply over the past year, policymakers, consumers and businesses are anxious to see inflation rates peak in 2022, as this would at least leave further escalation of inflationary pressure off the table. However, the risks of further inflationary shocks are still significant, as the war in Ukraine strains supplies of commodities, industrial supply chains and global trade networks. To assess the sensitivity of core and total PCE inflation to supply chain issues, in this section I consider alternative model simulations where delivery times either worsen or improve significantly, compared to the base case.
First, the base case forecast is built around Scotiabank Economics’ most recent published forecasts (see here), aligning the output gap, Fed Funds rate path and oil prices in the model simulation. With growth averaging 2.6% in 2022 before declining to 2.4% in 2023, the model forecast shows core PCE inflation easing from an average of 4.8% in 2022 to 3.3% in 2023 (table 1). Underlying this forecast, quarterly price increases in core PCE start to wane beginning in Q2-2022, ending the year at +3.7% Q/Q SAAR. This deceleration is in line with stabilizing supplier delivery times (chart 5), oil prices and non-energy commodity prices, despite some building excess demand in 2023.
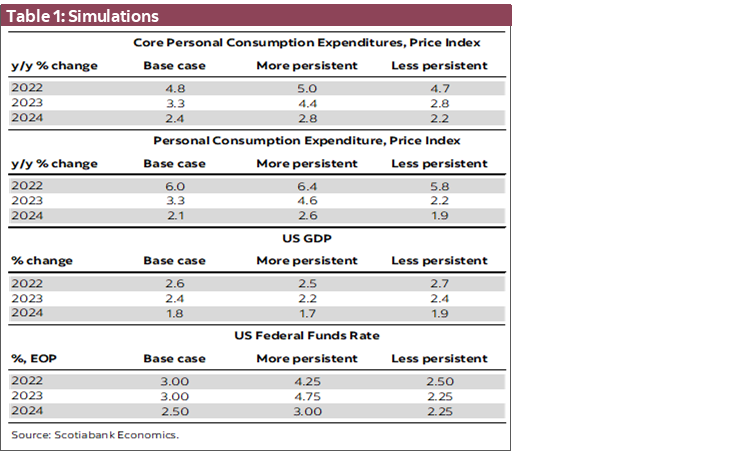
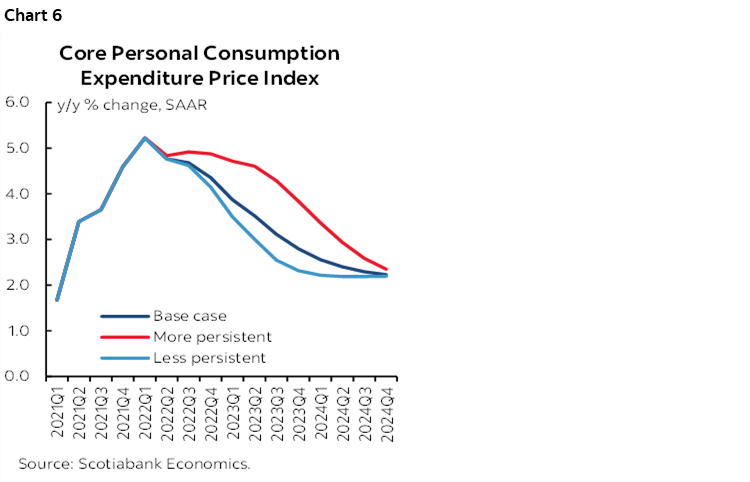
Note that the accumulated price increases at the end of 2021 and in early 2022 mean that the y/y core inflation rate is expected to be as high as 4.4% y/y at the end of 2022 (chart 6), slightly above the median projection by the Federal Reserve Board members and Bank Presidents from their June 2022 meeting (+4.3% y/y in Q4-2022, see here). The forecast for Q4-2023 is comparable, at 2.8% y/y versus the Fed’s 2.7% y/y. In our forecast, the Fed Funds rate reaches 3.0% in Q4-2022.
Given the acute risks to the global economy in the grips of the geopolitical crisis, in addition to the nagging COVID-related disruptions, the uncertainty around the outlook for growth and inflation is at least as high as it was in the early 1980s. I consider two alternative scenarios, one where supply issues are more persistent with further lengthening of delivery times (chart 5 again) and rising commodity prices, and one where supply issues are less persistent, with delivery times and commodity prices falling.
In the more persistent case, core PCE inflation averages 5.0% in 2022 and 4.4% in 2023. The persistence in supply chain disruptions could keep the quarterly inflation rate above 4.5% through the end of 2022. In this case, the Federal Reserve could be forced to raise the Fed Funds rate more sharply to reduce demand in interest-sensitive sectors to get inflationary pressures under control, which leaves the policy rate peaking at 4.75% in 2023 in this scenario. Growth is weaker due to higher policy rates, with GDP averaging 2.2% in 2023.
One factor that could restrain such a sharp increase in the policy rate is the impact on the housing market, with house price to disposable income and mortgage debt having risen significantly in the US. In the Canadian context, the vulnerabilities related to the housing market and high mortgage debt were pointed out recently by the Bank of Canada’s Deputy Governor Gravelle as a factor that could reduce the pace of rate increases over the next few years (see here).
Further, note that in the case of a global escalation in political tensions, with shortages of key energy and food commodities and sharp price increases, as well as scrambled trade globally, the impact on US GDP growth, inflation and policy rates is likely to be much more significant, as it would likely also include financial market volatility, a sharp growth slowdown in key trading partners and many other elements which I am not considering in the scenario above.
In the case where supply issues improve rapidly—perhaps as the international political situation improves—quarterly inflation could decline much faster than expected in the base case, with core PCE inflation falling to 2.8% in 2023. This would reduce the pressure on the Federal Reserve to hike rates rapidly, with the Federal Funds rate 75bps lower than in the base case at the end of 2023. Repaired logistics and lower policy rate mean stronger growth, at 2.7% and 2.4% in 2022 and 2023, respectively.
CONCLUSION
Barring any significant escalation in the current geopolitical crisis, core and total inflation will likely peak in mid-2022. However, if supply issues are more persistent than is embedded in the base case, inflation can remain stubbornly above the inflation target and force the Federal Reserve to raise rates more sharply, perhaps reaching 4.75% in 2023. Of course, such a sharp rise in the policy rate may run into financial stability concerns, with most of the developed economies, including the US, having increased mortgage borrowing during the pandemic and bidding house prices to unprecedented levels. However, even if inflation normalizes much faster, the policy rate would rise towards the neutral levels, perhaps at a more gradual pace.
The analysis in this note focuses on scenarios around supply chain disruptions and commodity prices, their impact on inflation and policy rates, and finally on economic activity. In the current context, many factors—financial market volatility and its effect on aggregate demand, high housing prices and rents going forward, in addition to the chilling effect of high consumer prices on spending—can lead to an even stronger slowdown in growth in case inflation is not brought under control. These factors pose downside risks to growth and policy rates, with the most recent macroeconomic data already pointing to significant weakness in GDP growth in advanced economies including the US. It remains to be seen whether any policies currently being discussed, including lowering US tariffs on imported goods, would slow inflation sufficiently to prop up household spending and aggregate demand more broadly.
DISCLAIMER
This report has been prepared by Scotiabank Economics as a resource for the clients of Scotiabank. Opinions, estimates and projections contained herein are our own as of the date hereof and are subject to change without notice. The information and opinions contained herein have been compiled or arrived at from sources believed reliable but no representation or warranty, express or implied, is made as to their accuracy or completeness. Neither Scotiabank nor any of its officers, directors, partners, employees or affiliates accepts any liability whatsoever for any direct or consequential loss arising from any use of this report or its contents.
These reports are provided to you for informational purposes only. This report is not, and is not constructed as, an offer to sell or solicitation of any offer to buy any financial instrument, nor shall this report be construed as an opinion as to whether you should enter into any swap or trading strategy involving a swap or any other transaction. The information contained in this report is not intended to be, and does not constitute, a recommendation of a swap or trading strategy involving a swap within the meaning of U.S. Commodity Futures Trading Commission Regulation 23.434 and Appendix A thereto. This material is not intended to be individually tailored to your needs or characteristics and should not be viewed as a “call to action” or suggestion that you enter into a swap or trading strategy involving a swap or any other transaction. Scotiabank may engage in transactions in a manner inconsistent with the views discussed this report and may have positions, or be in the process of acquiring or disposing of positions, referred to in this report.
Scotiabank, its affiliates and any of their respective officers, directors and employees may from time to time take positions in currencies, act as managers, co-managers or underwriters of a public offering or act as principals or agents, deal in, own or act as market makers or advisors, brokers or commercial and/or investment bankers in relation to securities or related derivatives. As a result of these actions, Scotiabank may receive remuneration. All Scotiabank products and services are subject to the terms of applicable agreements and local regulations. Officers, directors and employees of Scotiabank and its affiliates may serve as directors of corporations.
Any securities discussed in this report may not be suitable for all investors. Scotiabank recommends that investors independently evaluate any issuer and security discussed in this report, and consult with any advisors they deem necessary prior to making any investment.
This report and all information, opinions and conclusions contained in it are protected by copyright. This information may not be reproduced without the prior express written consent of Scotiabank.
™ Trademark of The Bank of Nova Scotia. Used under license, where applicable.
Scotiabank, together with “Global Banking and Markets”, is a marketing name for the global corporate and investment banking and capital markets businesses of The Bank of Nova Scotia and certain of its affiliates in the countries where they operate, including; Scotiabank Europe plc; Scotiabank (Ireland) Designated Activity Company; Scotiabank Inverlat S.A., Institución de Banca Múltiple, Grupo Financiero Scotiabank Inverlat, Scotia Inverlat Casa de Bolsa, S.A. de C.V., Grupo Financiero Scotiabank Inverlat, Scotia Inverlat Derivados S.A. de C.V. – all members of the Scotiabank group and authorized users of the Scotiabank mark. The Bank of Nova Scotia is incorporated in Canada with limited liability and is authorised and regulated by the Office of the Superintendent of Financial Institutions Canada. The Bank of Nova Scotia is authorized by the UK Prudential Regulation Authority and is subject to regulation by the UK Financial Conduct Authority and limited regulation by the UK Prudential Regulation Authority. Details about the extent of The Bank of Nova Scotia's regulation by the UK Prudential Regulation Authority are available from us on request. Scotiabank Europe plc is authorized by the UK Prudential Regulation Authority and regulated by the UK Financial Conduct Authority and the UK Prudential Regulation Authority.
Scotiabank Inverlat, S.A., Scotia Inverlat Casa de Bolsa, S.A. de C.V, Grupo Financiero Scotiabank Inverlat, and Scotia Inverlat Derivados, S.A. de C.V., are each authorized and regulated by the Mexican financial authorities.
Not all products and services are offered in all jurisdictions. Services described are available in jurisdictions where permitted by law.