The post-pandemic surge in inflation raised some questions as to which measure of core inflation was the best indicator of future total inflation, the Bank of Canada’s official target. At that time we found that CPI excluding food, energy and the effect of indirect taxes (CPIXFET) outperformed other measures while having the added benefit of being more intuitive, and easier to communicate to markets and households.
Now, with inflation largely back within the Bank of Canada range, we’ve repeated this exercise, comparing CPI-trim, CPI-median, and CPIXFET. Once again, CPIXFET proves to be the most accurate predictor of headline inflation.
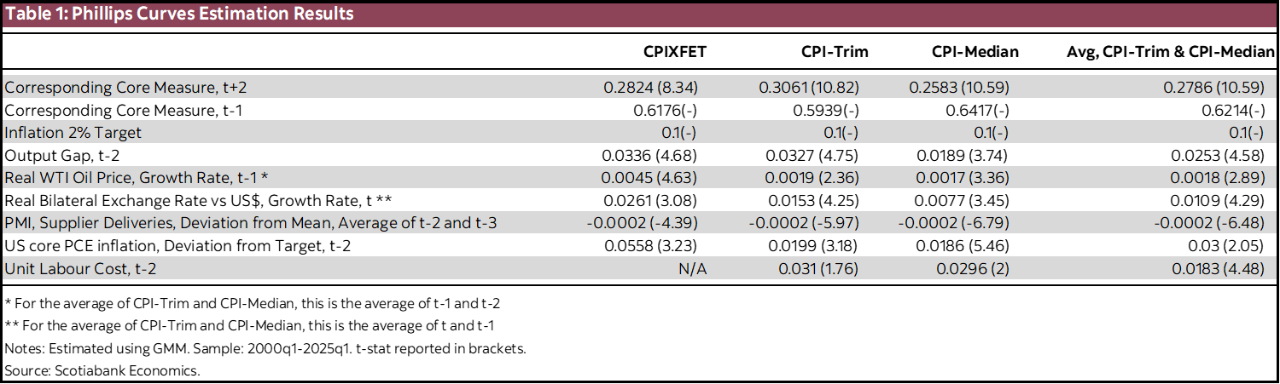
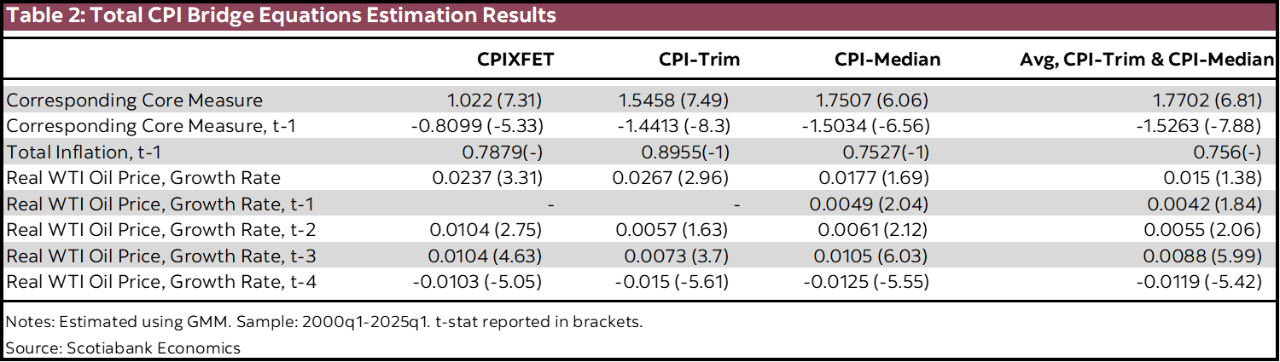
Our approach involves estimating augmented Phillips Curves for each of the core measures, including one for the average of CPI-trim and CPI-median. Each curve links year-over-year inflation to economic slack and other fundamentals. We then estimate bridge equations that connect each core measures to total inflation. This allows us to assess which core forecast best predicts headline inflation.
To do so, we run dynamic simulations that jointly forecast core and total inflation over history. This is a more stringent test of the forecasts’ performance than an in-sample approach, which reset forecast errors at each period based on observed inflation.
Table 1 presents the estimation results of the augmented Phillips Curves, while table 2 reports the corresponding results for the bridge equations. Both sets of equations are estimated using the Generalized Method of Moments within a semi-structural general equilibrium framework that links inflation dynamics to economic fundamentals and incorporates the monetary policy response through a Taylor rule.
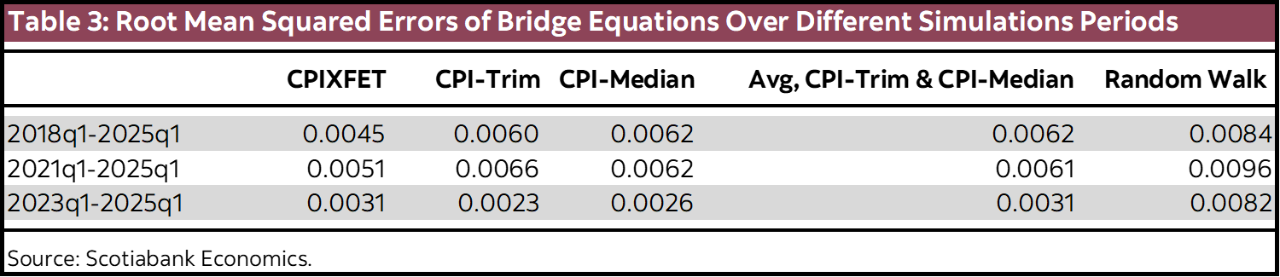
Because total inflation forecasts are derived from those of core inflation, we assess predictive performance by comparing the root mean squared errors of total inflation forecasts. Table 3 reports forecast accuracy scores across different simulation periods. Over the 2018–2025 period, the CPIXFET is the clear winner based on RMSE results. Chart 1 illustrates the dynamic simulation forecasts for total inflation over this period, providing a visual sense of how each measures track headline inflation.

During the inflation rundown starting in 2022Q3, all core measures perform similarly, though CPIXFET delivers the best overall forecast of total inflation when considering the whole sample. Notably, only CPI-Trim captures the peak of the inflationary episode, albeit at the cost of generally overestimating inflation leading up to and following the peak.
While CPIXFET maintains the lead in the 2021–2025 simulation (table 3 again), its advantage over CPI-trim and CPI-median narrows. When the model is simulated over the most recent eight quarters, CPI-trim achieves the most accurate forecast (lowest RMSE), followed by CPI-median, with the average of the two and CPIXFET performing similarly thereafter. Importantly, the core-inflation-based equations outperform a random walk across all simulation periods.
Although shorter-sample simulations provide interesting insights, the 2018–2025 sample fully captures the most recent inflationary cycle, including multiple shocks such as supply constraints and geopolitical tensions. The strong performance of CPIXFET over this broader horizon simulation reinforces its value as a reliable guide for predicting total inflation and informing monetary policy decisions, especially during times of heightened uncertainty.
DISCLAIMER
This report has been prepared by Scotiabank Economics as a resource for the clients of Scotiabank. Opinions, estimates and projections contained herein are our own as of the date hereof and are subject to change without notice. The information and opinions contained herein have been compiled or arrived at from sources believed reliable but no representation or warranty, express or implied, is made as to their accuracy or completeness. Neither Scotiabank nor any of its officers, directors, partners, employees or affiliates accepts any liability whatsoever for any direct or consequential loss arising from any use of this report or its contents.
These reports are provided to you for informational purposes only. This report is not, and is not constructed as, an offer to sell or solicitation of any offer to buy any financial instrument, nor shall this report be construed as an opinion as to whether you should enter into any swap or trading strategy involving a swap or any other transaction. The information contained in this report is not intended to be, and does not constitute, a recommendation of a swap or trading strategy involving a swap within the meaning of U.S. Commodity Futures Trading Commission Regulation 23.434 and Appendix A thereto. This material is not intended to be individually tailored to your needs or characteristics and should not be viewed as a “call to action” or suggestion that you enter into a swap or trading strategy involving a swap or any other transaction. Scotiabank may engage in transactions in a manner inconsistent with the views discussed this report and may have positions, or be in the process of acquiring or disposing of positions, referred to in this report.
Scotiabank, its affiliates and any of their respective officers, directors and employees may from time to time take positions in currencies, act as managers, co-managers or underwriters of a public offering or act as principals or agents, deal in, own or act as market makers or advisors, brokers or commercial and/or investment bankers in relation to securities or related derivatives. As a result of these actions, Scotiabank may receive remuneration. All Scotiabank products and services are subject to the terms of applicable agreements and local regulations. Officers, directors and employees of Scotiabank and its affiliates may serve as directors of corporations.
Any securities discussed in this report may not be suitable for all investors. Scotiabank recommends that investors independently evaluate any issuer and security discussed in this report, and consult with any advisors they deem necessary prior to making any investment.
This report and all information, opinions and conclusions contained in it are protected by copyright. This information may not be reproduced without the prior express written consent of Scotiabank.
™ Trademark of The Bank of Nova Scotia. Used under license, where applicable.
Scotiabank, together with “Global Banking and Markets”, is a marketing name for the global corporate and investment banking and capital markets businesses of The Bank of Nova Scotia and certain of its affiliates in the countries where they operate, including; Scotiabank Europe plc; Scotiabank (Ireland) Designated Activity Company; Scotiabank Inverlat S.A., Institución de Banca Múltiple, Grupo Financiero Scotiabank Inverlat, Scotia Inverlat Casa de Bolsa, S.A. de C.V., Grupo Financiero Scotiabank Inverlat, Scotia Inverlat Derivados S.A. de C.V. – all members of the Scotiabank group and authorized users of the Scotiabank mark. The Bank of Nova Scotia is incorporated in Canada with limited liability and is authorised and regulated by the Office of the Superintendent of Financial Institutions Canada. The Bank of Nova Scotia is authorized by the UK Prudential Regulation Authority and is subject to regulation by the UK Financial Conduct Authority and limited regulation by the UK Prudential Regulation Authority. Details about the extent of The Bank of Nova Scotia's regulation by the UK Prudential Regulation Authority are available from us on request. Scotiabank Europe plc is authorized by the UK Prudential Regulation Authority and regulated by the UK Financial Conduct Authority and the UK Prudential Regulation Authority.
Scotiabank Inverlat, S.A., Scotia Inverlat Casa de Bolsa, S.A. de C.V, Grupo Financiero Scotiabank Inverlat, and Scotia Inverlat Derivados, S.A. de C.V., are each authorized and regulated by the Mexican financial authorities.
Not all products and services are offered in all jurisdictions. Services described are available in jurisdictions where permitted by law.