- How many core inflation measures does it actually take to get the Canadian monetary policy right? Not that many, as it turns out.
- Looking at a range of “underlying” measures of inflation, we find that CPI excluding food, energy and indirect taxes is the best measure to forecast total inflation. Not only is that measure of inflation best explained in a Phillips curve framework, it also beats other measures at forecasting total inflation by a wide margin since 2017.
- The Bank of Canada currently considers a broad range of inflation measures as it evaluates its policy stance. Our results suggest the Bank should put less emphasis on the inflation measures it developed in 2017, and go back to basics by placing more emphasis on CPI excluding food, energy and indirect taxes in its communications and policy deliberations.
MOTIVATION
The COVID-19 pandemic which took Canada by storm in early 2020 has had an impact on all facets of the Canadian economy. It spurred unprecedented public health measures leading to the largest fall in economic activity and employment on record. It also drew a formidable fiscal and monetary response aimed at supporting Canadian households and businesses through the pandemic.
Focusing on monetary policy, the BoC’s large monetary stimulus in the form of Quantitative Easing (QE) and forward guidance was ultimately linked to the goal of helping inflation to sustainably reach the 2.0% target. The magnitude of the stimulus thus hinged on the understanding and accurate forecasts of inflation dynamics in the “fog-of-war” atmosphere of a public health emergency.
In general, to understand the evolution of consumer prices the Bank of Canada uses a number of measures of underlying, or “core” inflation. These series aim to capture broad movements in prices by excluding much of the inevitable month-to-month transitory volatility.1 Core inflation series based on trimmed-mean (CPI-trim), weighted-median (CPI-median) and common component (CPI-common) were officially introduced in the inflation target renewal for 2017−21.2 Other measures of core inflation are also available and were used in the past such as the CPI excluding food and energy and CPI excluding food, energy and the effect of indirect taxes. Which of these series has been the best at capturing the underlying inflationary trend? In other words, which measure is more likely to produce an accurate forecast for total CPI inflation—the focus of the Bank of Canada’s inflation-control framework? Also, which of these measures are best forecasted by a Phillips Curve framework? These are the questions we address in this report.
MODELLING FRAMEWORK AND ESTIMATION RESULTS
We start by estimating the relationship between core and total inflation and economic fundamentals using a standard modelling framework. Once estimated, the model can be used to forecast total and core inflation and we can compare the accuracy of the forecasts across specifications.
Table 1 shows the equations that link the y/y % change in core inflation to measures of economic slack and other economic fundamentals,3 or the so-called augmented Phillips Curve (APC). The central feature of the APC is its forward-looking nature, as shown by the inclusion of a two-quarter lead in core inflation, motivated by price rigidities that force businesses to also consider expected price changes when setting prices. It also includes cost-push and demand-pull drivers of inflation.
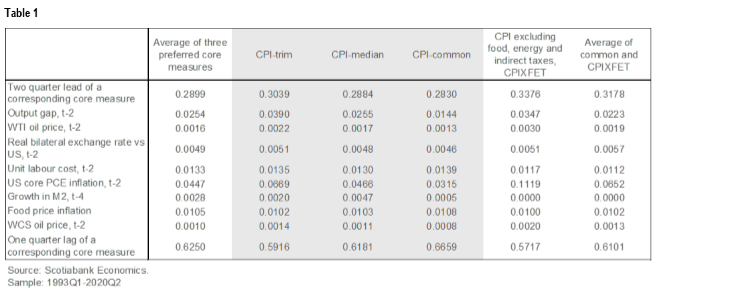
The equations in table 1 are estimated by Bayesian methods in a fully-specified general equilibrium model that links together economic fundamentals, total and core inflation, and the setting of monetary policy through the so-called Taylor rule. This technique allows us to use model-consistent expectations of core inflation in estimating the equations—the main benefit of this approach.
Six versions of the model are estimated for each of the core inflation series we consider including: three of the BoC’s preferred measures (CPI-trim, CPI-median and CPI-common); their simple arithmetic average; CPI excluding food, energy and the effect of indirect taxes; as well as the average of the latter and the CPI-common.
Table 1 shows the coefficients in the Augmented Phillips Curve for each estimated model. Although they are relatively similar across models, there are a few notable differences. First, the BoC’s preferred measures of core inflation show significant difference in persistence as shown by the weight on the lag of the particular core inflation measure, which is highest for CPI-common at 0.67, while CPI excluding food, energy and the effect of indirect taxes has the lowest at 0.57.
Second, economic fundamentals have a significant impact on all measures of core inflation, but the impact is strongest on the CPIXFET and CPI-trim: the coefficients on the two-quarter lag of the output gap (the difference between the level of GDP and its long-run potential) are above 0.03, compared to less than 0.02 for the CPI-common. Finally, the coefficients on the unit labour cost, which measures the cost of labour needed to produce a unit of GDP, are highest for the BoC’s preferred measures of core. The unit labour cost captures the cost-push inflation coming from the labour market, in contrast to the demand-pull dimension captured by the output gap.
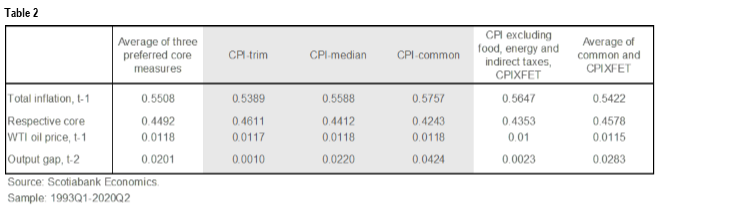
For each core measure we also estimated a bridge equation linking it to total CPI inflation (see table 2), which includes a lag of total CPI, core inflation, the real price of oil and the output gap. The weight on core inflation is between 0.42 and 0.46 in all cases, which shows that core inflation measures are significantly correlated with total CPI, as expected.
The equations in tables 1 and 2 will serve as the basis for the simulations shown in the next section, helping us to determine which measures of core are most useful as signals of the underlying inflationary pressures.
FORECASTING PERFORMANCE
Focusing on six measures of core inflation described in the previous section, we evaluate whether a core inflation measure is a good proxy for fundamental inflation using the following two criteria:
i) Is the Augmented Phillips Curve a good framework to forecast a particular core inflation measure?
ii) Is the core inflation measure useful for forecasting total CPI?
For our assessment we use the models estimated in the previous section to run dynamic simulations in which core and total CPI inflation are jointly forecast over history.
Table 3 shows the root mean squared errors associated with the forecast of the six measures of core inflation over different forecasting periods.4 Over the 2003–2020 period, results show that the Augmented Phillips Curve framework is useful in forecasting the CPI-Common measure and the average of the BoC cores but performs relatively poorly in forecasting CPIXFET (see charts 1–6). The remaining core inflation series are somewhere in between these two cases.
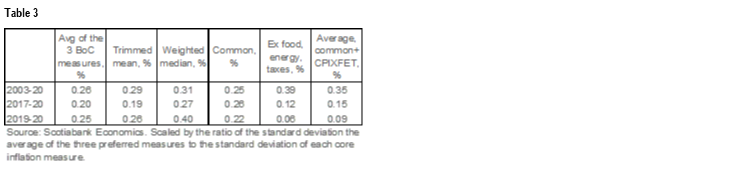
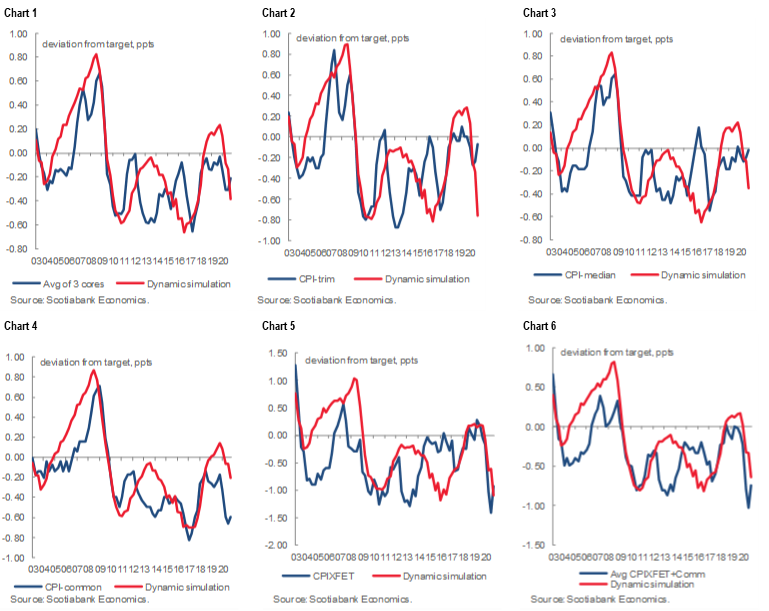
Since the introduction by the Bank of Canada of the 3 new core measures (i.e., CPI-Trim, CPI-Median and CPI-Common) in 2017, the situation changed significantly. In fact, since 2017, and particularly during the ongoing pandemic, the Augmented Phillips Curve produced more accurate forecasts of CPIXFET compared to forecasts of all the other measures of core inflation, including the CPI-common.
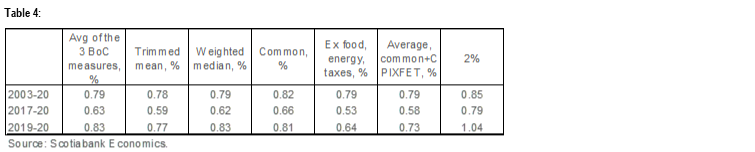
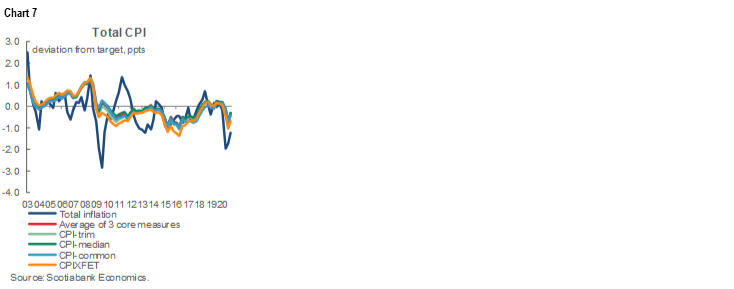
Table 4 shows the accuracy of the forecast for total CPI using various core inflation measures and other determinants (chart 7). Over the 2003–2020 period the forecasting performance of the six core-inflation-based equations is only slightly better than that of a constant 2% forecast. All of the six core measures perform similarly over the 2003–2020 period, but since 2017, and particularly during the pandemic, CPIXFET is a clear winner.5 Over this period, CPIXFET is substantially better at forecasting total CPI than all the other measures of core inflation or a simple 2% inflation forecast. This is in large part because of the good fit for CPIXFET of the Augmented Phillips Curve over that period.
SENSITIVITY ANALYSIS
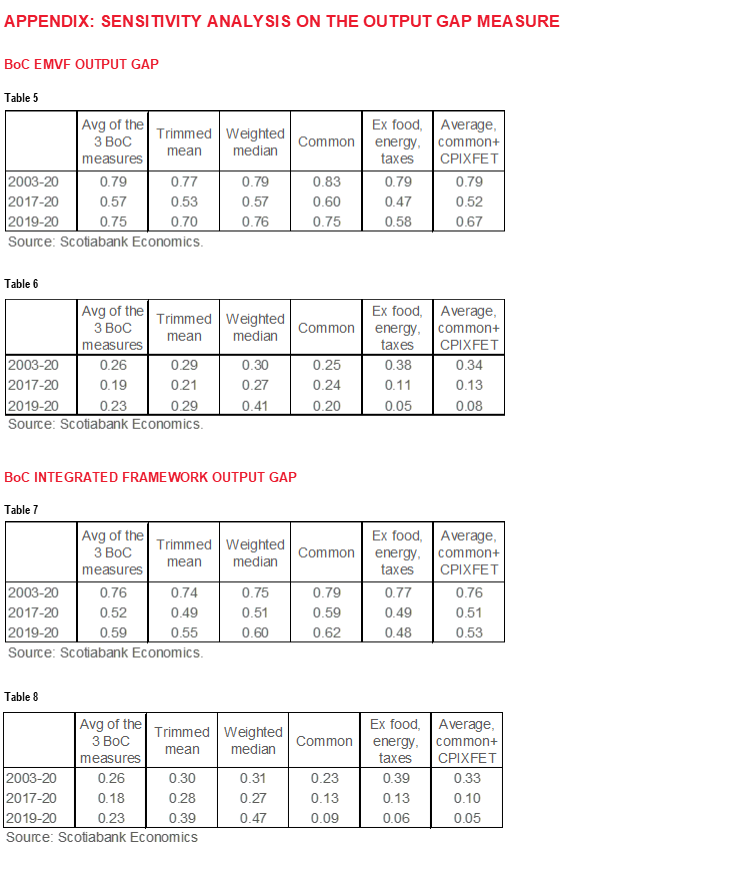
Given the uncertainty around potential GDP, the results might be sensitive to the measure of the output gap that we use in the Phillips Curves. The results presented in the last section are based on an in-house output gap that is a mix of staff judgment, the Extended Multivariate Filter (EMVF) produced by the BoC and the Integrated Framework approach (IF) published by the BoC. We also estimated Phillips Curves based on the EMVF output gap and on the IF output gap. The results regarding the forecasting performance of these Phillips Curves presented in the Appendix show that our conclusions are robust as to the measure of the output gap that we use in the Phillips Curves. For instance, since 2017 the CPI excluding food, energy and indirect taxes (and the CPI excluding food and energy) still do better or as good as the other measures of core inflation. In addition, we found that our results were robust regarding the choice of the lag structure in the Phillips Curve specification.
CONCLUSION
The CPI excluding food, energy and the effect of indirect taxes is striking back. In a sense it is back to the future in terms of core inflation measures! Indeed, given our results we think that the Bank of Canada should consider focusing its attention to the CPI excluding food, energy and the effect of indirect taxes and, to a lesser extent, to the CPI-Common to evaluate the level of fundamental inflation pressures.
Not only is CPI excluding food, energy and indirect taxes at least as good at forecasting total inflation overall—the target of the Canadian central bank—and significantly better since 2017, but it is also more intuitive, well forecasted by the Phillips Curve framework and easier to communicate and analyze by markets. The black-box-like quality of the Bank of Canada’s CPI-trim and CPI-median leaves them opaque and difficult to explain.
In terms of modelling, from now on in the Scotiabank Macroeconomic Model we will use CPIXFET to anchor the forecast of total CPI (combined with the price of oil and the output gap). We will also introduce the mean of the CPIXFET and the CPI-Common inflation rates in the reaction function of the Bank of Canada. Up until now we were using the average of the CPI-Common, CPI-Trim and CPI-Median inflation.
1 See Lao, H. and Steyn, L., “A Comprehensive Evaluation of Measures of Core Inflation in Canada: An Update”, Bank of Canada Staff Discussion Paper 2019-9. Link
2 See Renewal of Inflation-Control Target (October 2016), Bank of Canada. Link
3 The choice of y/y % growth in core inflation is forced by the fact that only this form is publicly available for the BoC’s preferred core measures. This constraint limits our ability to decompose the fluctuation of core measures into underlying monthly price changes.
4 To account for the differences in standard deviations of the cores measures we scaled the RMSEs by the ratio of the standard deviation of the average of the 3 BoC cores measures to the standard deviation of the core measure under consideration.
5 It is worth noting that an equation that anchors the forecast of total CPI on CPI excluding food, energy and the effect of indirect taxes gives better results than a Phillips Curve applied directly on total CPI. This conclusion shows that the core inflation concept is useful to forecast total CPI.
DISCLAIMER
This report has been prepared by Scotiabank Economics as a resource for the clients of Scotiabank. Opinions, estimates and projections contained herein are our own as of the date hereof and are subject to change without notice. The information and opinions contained herein have been compiled or arrived at from sources believed reliable but no representation or warranty, express or implied, is made as to their accuracy or completeness. Neither Scotiabank nor any of its officers, directors, partners, employees or affiliates accepts any liability whatsoever for any direct or consequential loss arising from any use of this report or its contents.
These reports are provided to you for informational purposes only. This report is not, and is not constructed as, an offer to sell or solicitation of any offer to buy any financial instrument, nor shall this report be construed as an opinion as to whether you should enter into any swap or trading strategy involving a swap or any other transaction. The information contained in this report is not intended to be, and does not constitute, a recommendation of a swap or trading strategy involving a swap within the meaning of U.S. Commodity Futures Trading Commission Regulation 23.434 and Appendix A thereto. This material is not intended to be individually tailored to your needs or characteristics and should not be viewed as a “call to action” or suggestion that you enter into a swap or trading strategy involving a swap or any other transaction. Scotiabank may engage in transactions in a manner inconsistent with the views discussed this report and may have positions, or be in the process of acquiring or disposing of positions, referred to in this report.
Scotiabank, its affiliates and any of their respective officers, directors and employees may from time to time take positions in currencies, act as managers, co-managers or underwriters of a public offering or act as principals or agents, deal in, own or act as market makers or advisors, brokers or commercial and/or investment bankers in relation to securities or related derivatives. As a result of these actions, Scotiabank may receive remuneration. All Scotiabank products and services are subject to the terms of applicable agreements and local regulations. Officers, directors and employees of Scotiabank and its affiliates may serve as directors of corporations.
Any securities discussed in this report may not be suitable for all investors. Scotiabank recommends that investors independently evaluate any issuer and security discussed in this report, and consult with any advisors they deem necessary prior to making any investment.
This report and all information, opinions and conclusions contained in it are protected by copyright. This information may not be reproduced without the prior express written consent of Scotiabank.
™ Trademark of The Bank of Nova Scotia. Used under license, where applicable.
Scotiabank, together with “Global Banking and Markets”, is a marketing name for the global corporate and investment banking and capital markets businesses of The Bank of Nova Scotia and certain of its affiliates in the countries where they operate, including; Scotiabank Europe plc; Scotiabank (Ireland) Designated Activity Company; Scotiabank Inverlat S.A., Institución de Banca Múltiple, Grupo Financiero Scotiabank Inverlat, Scotia Inverlat Casa de Bolsa, S.A. de C.V., Grupo Financiero Scotiabank Inverlat, Scotia Inverlat Derivados S.A. de C.V. – all members of the Scotiabank group and authorized users of the Scotiabank mark. The Bank of Nova Scotia is incorporated in Canada with limited liability and is authorised and regulated by the Office of the Superintendent of Financial Institutions Canada. The Bank of Nova Scotia is authorized by the UK Prudential Regulation Authority and is subject to regulation by the UK Financial Conduct Authority and limited regulation by the UK Prudential Regulation Authority. Details about the extent of The Bank of Nova Scotia's regulation by the UK Prudential Regulation Authority are available from us on request. Scotiabank Europe plc is authorized by the UK Prudential Regulation Authority and regulated by the UK Financial Conduct Authority and the UK Prudential Regulation Authority.
Scotiabank Inverlat, S.A., Scotia Inverlat Casa de Bolsa, S.A. de C.V, Grupo Financiero Scotiabank Inverlat, and Scotia Inverlat Derivados, S.A. de C.V., are each authorized and regulated by the Mexican financial authorities.
Not all products and services are offered in all jurisdictions. Services described are available in jurisdictions where permitted by law.