HIGHLIGHTS
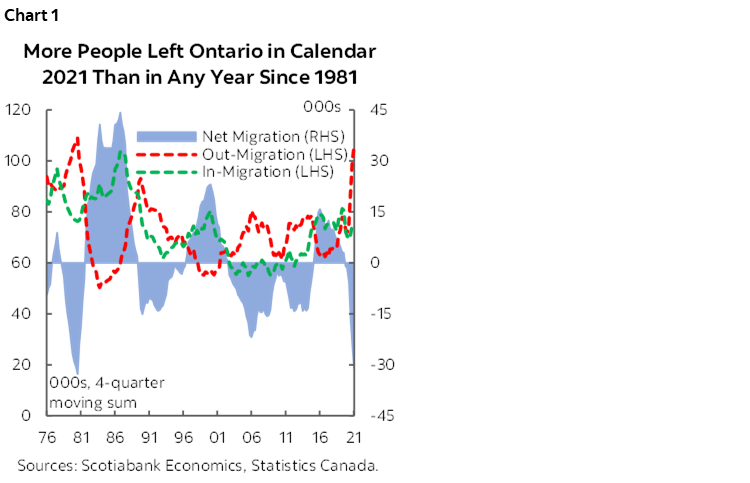
- Ontario’s population rose by 175k between Q4-2020 and Q4-2021—boosted by record numbers of immigrant admissions—but nearly 108k people moved to other provinces and territories in calendar year 2021—the most since 1981 (chart 1).
- Pandemic restriction severity, housing affordability, and telework adoption all appear to have influenced the trend—in contrast to past periods of strong out-migration that mirrored starker differences in regional economic conditions.
- It is not yet clear if this is a permanent shift: telework and housing affordability challenges will likely persist and surging crude values should increase Alberta’s draw, but Ontario is still a dynamic province and is easing COVID-19 restrictions.
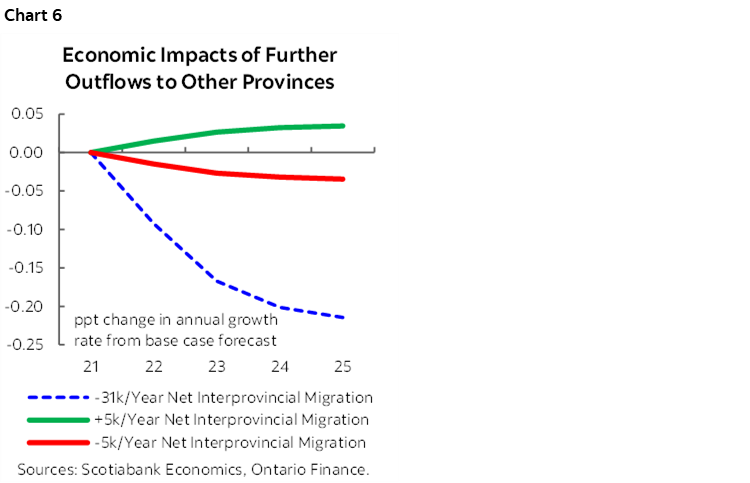
- Using our econometric model of the Ontario economy, we estimate that further outflows at the 2021 rate would shave only 0.2 ppts per year off of GDP growth; that could be offset by higher immigrations via national-level target increases.
- Even so, interprovincial headcount losses should reinforce the need for policymakers to step up efforts to alleviate housing affordability issues.
FLOCKING OUT OF ONTARIO
Population data to the end of 2021 released this morning continue to show marked shifts in where Canadians are choosing to live and work. Particularly striking is the rate at which former residents left Ontario for other provinces and territories: in 2021, almost 108k people moved out of Canada’s largest province—the most since calendar year 1981—a sharp reversal of the pre-pandemic trend. Though that loss was dominated by 198.5k immigrant admissions in calendar year 2021—the most in any four-quarter period since at least 1946—such a large movement to other provinces merits an examination. In this note, we discuss the drivers and implications of that shift.
A BRIEF HISTORY OF ONTARIO INTERPROVINCIAL MIGRATION
Historically, movement within the country has naturally reflected relative economic conditions; in Canada, that means a strong correlation with oil prices. When crude surges, job-seekers tend to migrate to net oil-producing provinces like Saskatchewan and Alberta. Ontario residents flocked to those jurisdictions in 1980 and early 1981 amid the oil boom of those years as well as during the last commodity price super cycle that peaked in the early 2010s. By contrast, when crude values fall, more stable employment in net oil-consuming regions like Ontario tends to pull prospective workers away from more natural resources-intensive economies.
What stands out about the last year’s out-migration from Ontario is the breadth of destination provinces (chart 2). All three Maritime regions witnessed record inflows from Canada’s largest province, and BC welcomed more former Ontario residents than at any point since the early 1990s recession that hit the latter jurisdiction particularly hard. Perhaps even more stunningly, more people moved from Ontario to Quebec than vice versa for the first calendar year in recorded history! Meanwhile, net outflows to Alberta strengthened late in the year, a trend that is more likely to continue this year with oil prices hovering around 100 USD/bbl and drilling activity on the rise.

In an environment of fairly synchronized pandemic-era regional rates of economic growth and job creation, differences in lockdown stringency explain some—but not all—of the outflows. For instance, BC and the Atlantic Provinces generally imposed less restrictive measures to contain COVID-19, which likely contributed to their draw. If Ontario continues to reopen with limited virus flare-ups, that effect could be diminished. That argument holds less water with Quebec, which still saw improved net interprovincial migration flows with Ontario despite being among the most locked-down of the provinces and earliest to implement restrictions during multiple pandemic waves.
The magnitude and range of destinations sought by Ontario out-migrants likely also reflects housing affordability challenges built up over the last few years, combined with increased telework. Toronto recently made headlines for surpassing Vancouver as Canada’s priciest local housing market. Perhaps more strikingly, last year, as a share of disposable income, all-Ontario average home sale prices were roughly in line with those in BC for the first time since before the early 1990s recession that hammered Central Canada’s manufacturing sector (chart 3). With remote work now widely accepted in the Canadian labour market, it stands to reason that some Ontario workers would seek opportunities in more affordable locations—a class that now includes the previously much more costly BC Lower Mainland.

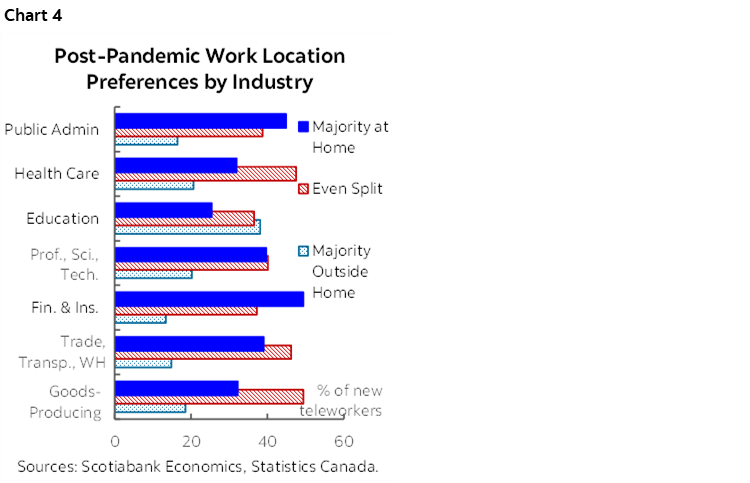
Both factors look likely to remain in place to some degree in the future. We estimate that Ontario had the lowest per-person residential housing stock of any province in 2020 and would need to build an additional 1.2 million homes to match the ratio of our international peers. We also suspect that telework will remain in some form once the pandemic is behind us and continue to influence Canadian migration trends in the interim. Results from a Statistics Canada survey released in 2021 indicate that a strong majority of new Canadian teleworkers across provinces and in most industries wish to continue working remotely at least half the time (chart 4). This could naturally be expected to diminish the draw of higher-priced jurisdictions like Ontario.
Historical migration ties also appear to be playing a role in where Canadians settle. For instance, movement from Ontario to Nova Scotia/New Brunswick tends to far outpace that from Ontario to Manitoba/Saskatchewan even though the latter two jurisdictions have much larger populations and economies. These historical relationships may be behind the relative lack of Ontario migration to the Prairies despite clear advantages on affordability and relatively light pandemic restrictions, and could influence cross-provincial movement over the coming years as more Canadians reach retirement age.
ASSESSING BROADER ECONOMIC IMPACTS
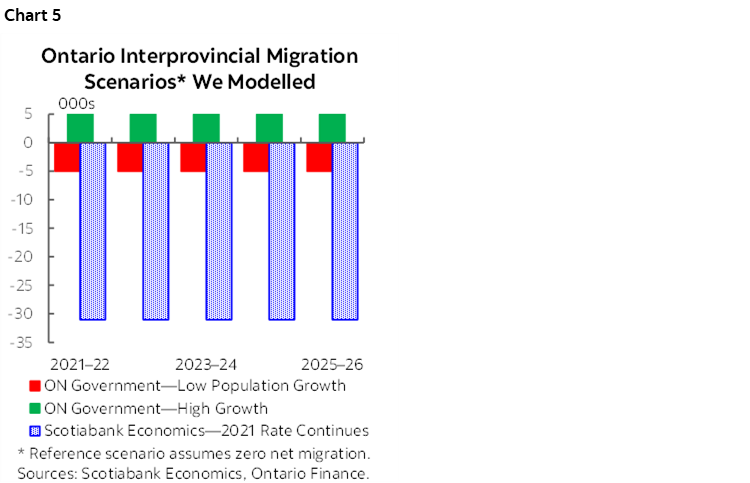
To estimate the potential economic drag associated with increased interprovincial migration out of Ontario, we used our quarterly econometric model of the province’s economy and provincial government demographic projections. Our regular forecasts employ Ontario reference population forecasts and adjust history as data are released in-year; as such, government-designed scenarios are an excellent way to assess the effects of a range of potential outflows. In addition to modelling Ontario’s base case (zero net interprovincial migration over time), low-growth path (annual average net migration of about –5,000), and high-growth trajectory (+5,000 per year), we devise a worst scenario in which net interprovincial migration continues at its 2021 rate, reducing Ontario’s population by about 31,000 persons per year through 2025 (chart 5).
Our model suggests that our “worst case scenario” would not significantly alter the course of Ontario growth over the next two years. We estimate that net losses of 31k people per year would slow Ontario’s expansion by only 0.2 ppts per year1 through 2025—a small hit in the context of the pandemic reopening-assisted expansions of 3–4% that we anticipated over 2022–23 in our March 2022 forecast tables. Yet, that drag would be more meaningful as the economy converges towards a long-run potential growth rate below 2%. Impacts are more modest for net interprovincial migration of ±5k per year (chart 6). This is not a totally unexpected result given that net international immigration—unchanged in all of our model shocks—accounts for at least 72% of annual population growth in each year of Ontario’s demographic scenarios.
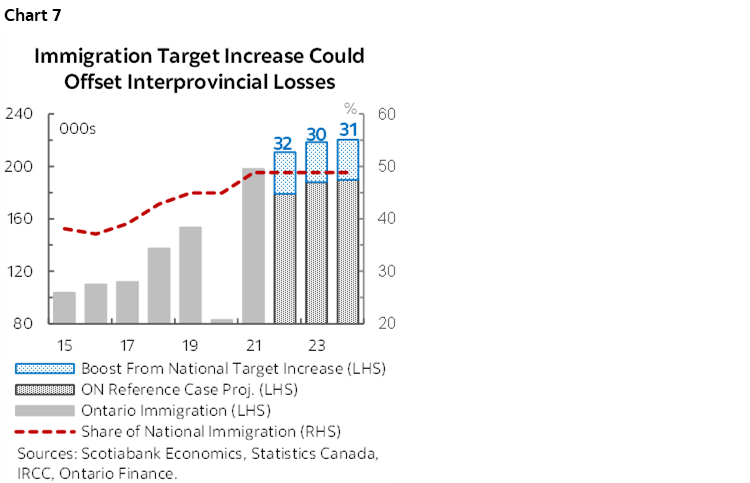
In any case, boosts to national immigration targets—and an apparent rise in Ontario’s draw to newcomers—could compensate for “worst case” interprovincial headcount losses. Newcomer admissions since the pandemic’s onset have been dominated by temporary residents already in Canada who were granted permanent resident status. Over this period, Ontario has seen its share of national immigrant landings rise from 45% in 2019 to 49% in 2021; however, even before COVID-19, the 45% portion represented a marked increase from rates in the high 30s in the mid-2010s. If recently announced national-level admissions targets are met, and if Ontario maintains its 49% share of those admissions, the province would bring in about 30k more immigrants per year than predicted in its reference demographic scenario over 2022–25 (chart 7), That would about make up for even the net interprovincial losses of 31k per year in our worst case scenario.
FINAL THOUGHTS
It is not yet clear if the shift in Ontario interprovincial migration will prove to be a permanent one. On the one hand, adoption of telework and housing affordability challenges will likely persist; this could bolster the cost of living advantages that exist in smaller jurisdictions within Canada. Surging crude values should also improve the draw of Alberta and other net oil-producing provinces. However, Ontario’s cultural diversity and large, diversified economy should continue to attract workers from within Canada and newcomers. The province continues to offer wages above the national average, and Toronto remains a major financial services and technology sector hub. Moreover, easing of public health restrictions may contribute to diminished net outflows to other provinces and territories, so long as virus infection rates stay manageable.
Even if the macroeconomic drag proves transitory, or can be offset by immigration, interprovincial headcount losses should still reinforce the need to step up efforts to improve housing affordability. Recommendations from Ontario’s Housing Affordability Task Force—chaired by Scotiabank’s CEO and Group Head of Global Banking and Markets—included eliminating zoning rules that ban construction of high-density residential building types, increasing housing density around transit stations, and scrapping restrictive local land use rules that attempt to preserve “neighbourhood character.” Steps should be taken to implement these measures expeditiously. Fundamentally, while remote work may afford more flexibility for workers, policymakers should still make every effort to ensure Ontarians are able to continue to work in their home province if they so choose.
1 Results did not change materially under varying assumptions about the age distribution of interprovincial migrants.
DISCLAIMER
This report has been prepared by Scotiabank Economics as a resource for the clients of Scotiabank. Opinions, estimates and projections contained herein are our own as of the date hereof and are subject to change without notice. The information and opinions contained herein have been compiled or arrived at from sources believed reliable but no representation or warranty, express or implied, is made as to their accuracy or completeness. Neither Scotiabank nor any of its officers, directors, partners, employees or affiliates accepts any liability whatsoever for any direct or consequential loss arising from any use of this report or its contents.
These reports are provided to you for informational purposes only. This report is not, and is not constructed as, an offer to sell or solicitation of any offer to buy any financial instrument, nor shall this report be construed as an opinion as to whether you should enter into any swap or trading strategy involving a swap or any other transaction. The information contained in this report is not intended to be, and does not constitute, a recommendation of a swap or trading strategy involving a swap within the meaning of U.S. Commodity Futures Trading Commission Regulation 23.434 and Appendix A thereto. This material is not intended to be individually tailored to your needs or characteristics and should not be viewed as a “call to action” or suggestion that you enter into a swap or trading strategy involving a swap or any other transaction. Scotiabank may engage in transactions in a manner inconsistent with the views discussed this report and may have positions, or be in the process of acquiring or disposing of positions, referred to in this report.
Scotiabank, its affiliates and any of their respective officers, directors and employees may from time to time take positions in currencies, act as managers, co-managers or underwriters of a public offering or act as principals or agents, deal in, own or act as market makers or advisors, brokers or commercial and/or investment bankers in relation to securities or related derivatives. As a result of these actions, Scotiabank may receive remuneration. All Scotiabank products and services are subject to the terms of applicable agreements and local regulations. Officers, directors and employees of Scotiabank and its affiliates may serve as directors of corporations.
Any securities discussed in this report may not be suitable for all investors. Scotiabank recommends that investors independently evaluate any issuer and security discussed in this report, and consult with any advisors they deem necessary prior to making any investment.
This report and all information, opinions and conclusions contained in it are protected by copyright. This information may not be reproduced without the prior express written consent of Scotiabank.
™ Trademark of The Bank of Nova Scotia. Used under license, where applicable.
Scotiabank, together with “Global Banking and Markets”, is a marketing name for the global corporate and investment banking and capital markets businesses of The Bank of Nova Scotia and certain of its affiliates in the countries where they operate, including; Scotiabank Europe plc; Scotiabank (Ireland) Designated Activity Company; Scotiabank Inverlat S.A., Institución de Banca Múltiple, Grupo Financiero Scotiabank Inverlat, Scotia Inverlat Casa de Bolsa, S.A. de C.V., Grupo Financiero Scotiabank Inverlat, Scotia Inverlat Derivados S.A. de C.V. – all members of the Scotiabank group and authorized users of the Scotiabank mark. The Bank of Nova Scotia is incorporated in Canada with limited liability and is authorised and regulated by the Office of the Superintendent of Financial Institutions Canada. The Bank of Nova Scotia is authorized by the UK Prudential Regulation Authority and is subject to regulation by the UK Financial Conduct Authority and limited regulation by the UK Prudential Regulation Authority. Details about the extent of The Bank of Nova Scotia's regulation by the UK Prudential Regulation Authority are available from us on request. Scotiabank Europe plc is authorized by the UK Prudential Regulation Authority and regulated by the UK Financial Conduct Authority and the UK Prudential Regulation Authority.
Scotiabank Inverlat, S.A., Scotia Inverlat Casa de Bolsa, S.A. de C.V, Grupo Financiero Scotiabank Inverlat, and Scotia Inverlat Derivados, S.A. de C.V., are each authorized and regulated by the Mexican financial authorities.
Not all products and services are offered in all jurisdictions. Services described are available in jurisdictions where permitted by law.