

KEY TAKEAWAYS
- The automotive sector ended the third quarter of 2026 with mixed signals, showing resilience in both light and heavy vehicles.
- Light vehicle sales maintained a favourable trajectory, growing 4.5% year over year in Q3-26 and 5.0% in the first nine months of the year, supported by domestic market resilience amid a more favourable economic outlook, despite more moderate consumption.
- Light vehicle production and exports posted negative results, also weighing on year-to-date performance, given their exposure to production adjustments and shifts in external demand.
- Heavy vehicles showed a more favourable year-to-date performance, with positive growth, although this benefited from a low comparison base and remained dependent on the country's investment environment.
- Looking ahead, factors contributing to heightened uncertainty will need to be monitored to assess the sector's momentum toward year-end.
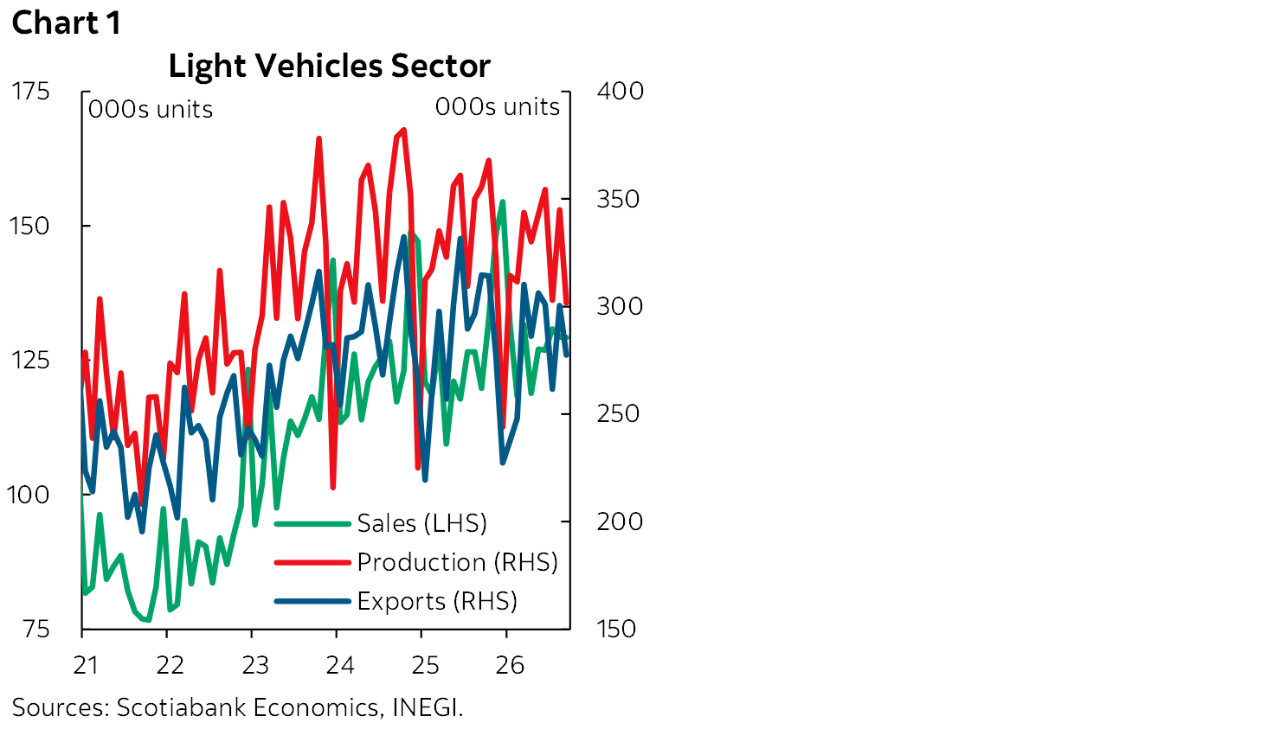
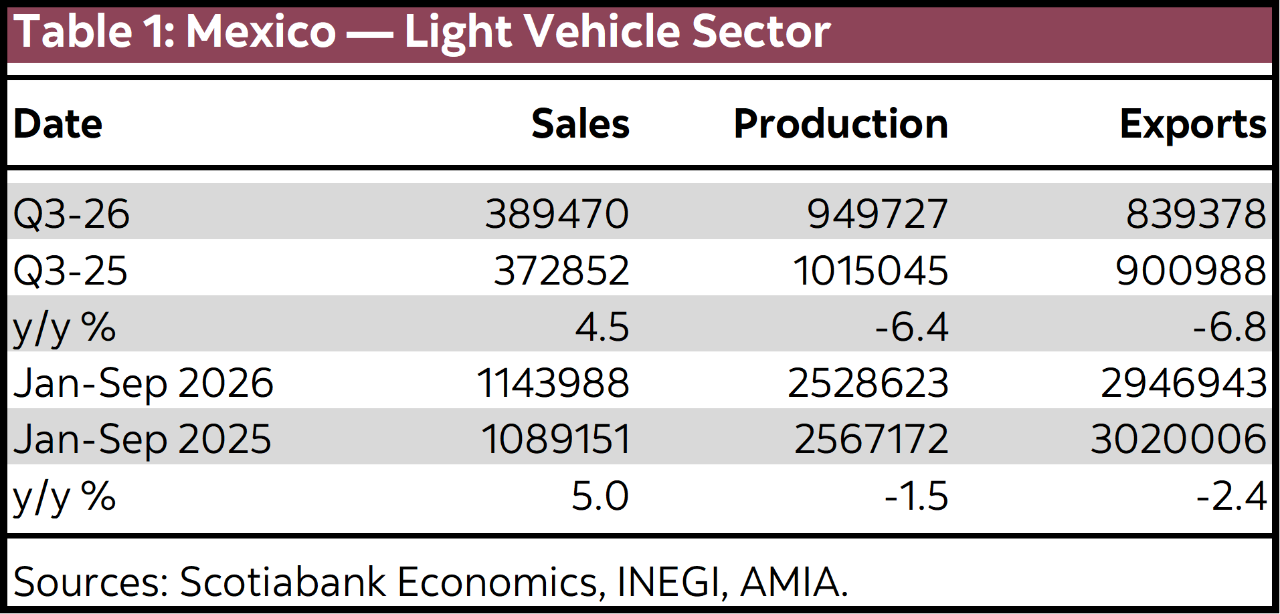
During the third quarter of 2026, the automotive sector continued to show mixed signals (chart 1 and table 1). In the light vehicle market, sales delivered a positive and resilient performance despite moderate employment and consumption conditions in recent months. Meanwhile, vehicle production and exports recorded sharp declines, reflecting earlier production adjustments and weaker external demand. Heavy vehicles continued to recover, supported by an improvement in domestic investment, which has returned to positive growth in recent months.
LIGHT VEHICLES
- Mixed results for the automotive market during the quarter.
During the third quarter of 2026 (Q3-26), 389,470 light vehicles sales showed an increase of 4.5% compared with the same period last year and above the 372,868 units sold in the second quarter of 2026 (Q2-26). This brought January–September sales to 1,143,988 units, representing year-to-date growth of 5.0%, compared with an increase of just 0.4% in the same period a year earlier. The domestic market thus showed solid momentum during the period, despite moderating growth in consumption and formal employment.
Sales by brand and country of origin; China’s share nears 20%
Among brands affiliated with the Mexican Automotive Industry Association (AMIA) and reporting to INEGI (tables 2 and 3, at the back), Nissan remained the market leader, with an 18.0% share and 69,981 units sold in Q3-26, representing year-over-year growth of 2.7%. General Motors followed with a 12.8% share, 49,719 units and year-over-year growth of 3.4%. Volkswagen ranked third, with an 8.9% market share and 34,764 units, up 4.2% year over year. Toyota, Kia and Mazda also remained among the most significant competitors in the domestic market. Meanwhile, brands that do not report to INEGI, most of which are Chinese, showed favourable trends according to estimates from the Mexican Association of Automotive Distributors (AMDA).
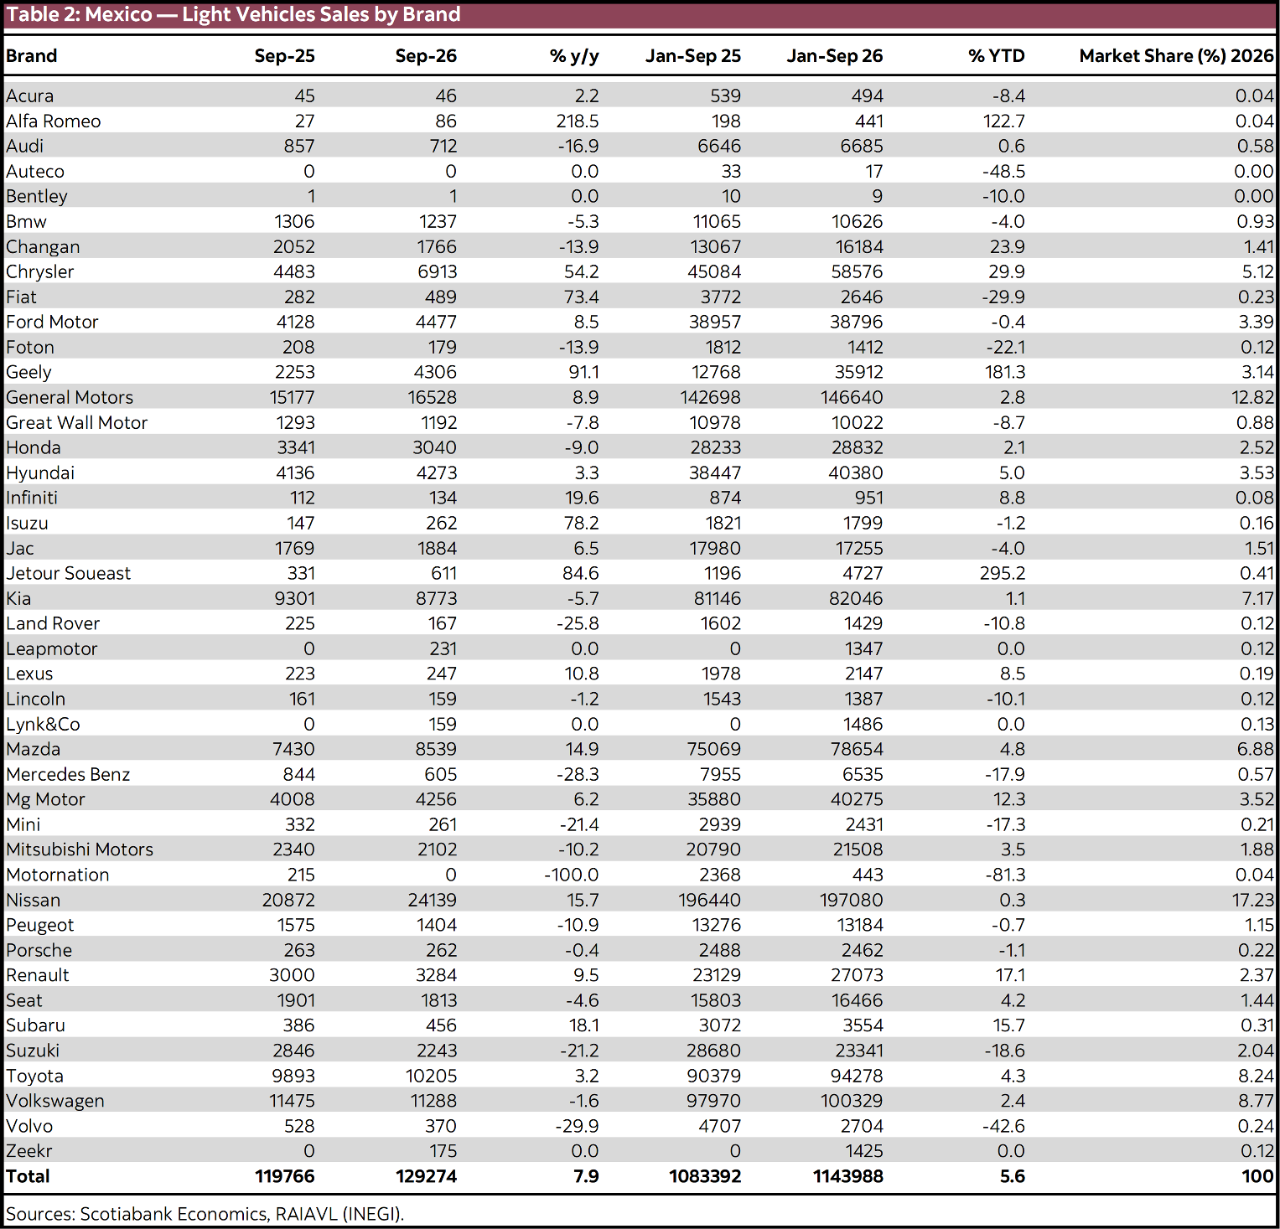
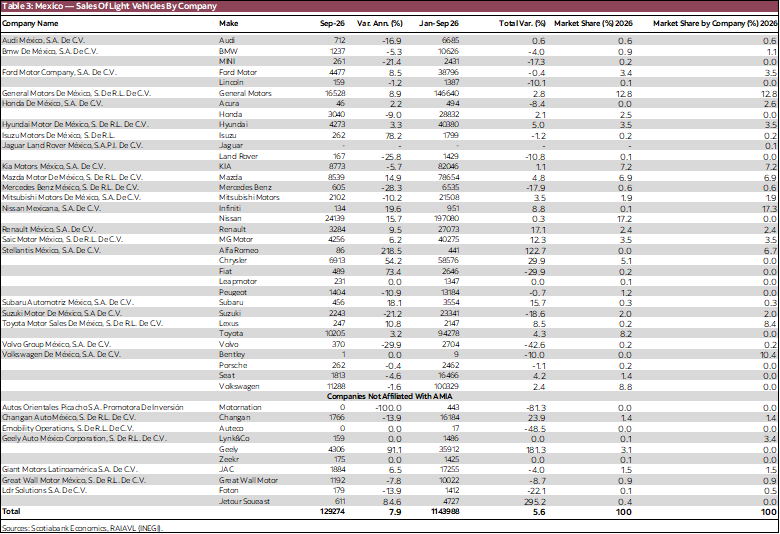
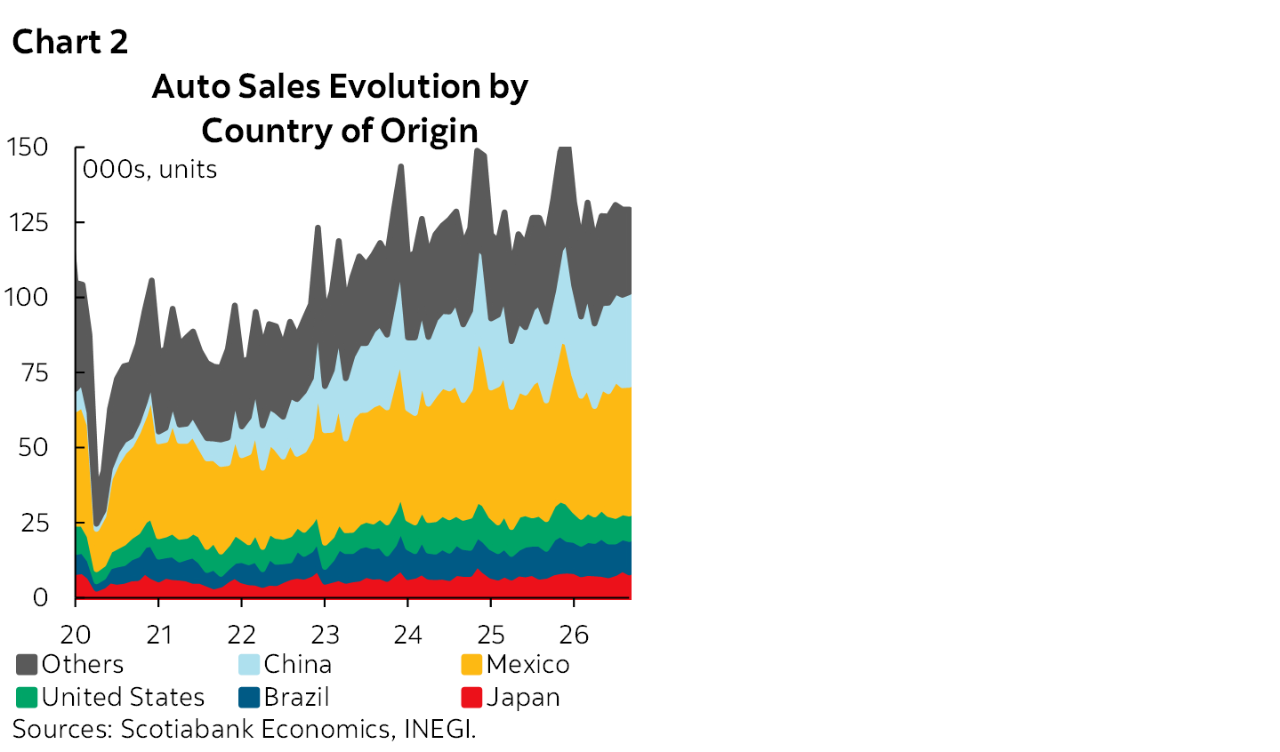
According to the association, Chinese brands accounted for 17% of total sales when brands not reporting to INEGI were included (chart 2). AMDA noted divergent performance among non-reporting Chinese brands: BYD recorded a year-to-date decline of -4.7% in the first three quarters, compared with growth of 181.3% (35,912 units) for Geely. The entry of new competitors thus remained an important driver of sales, also influencing vehicle prices, which increased more slowly than overall inflation.
SUVs lead sales by segment, but subcompacts grow the most
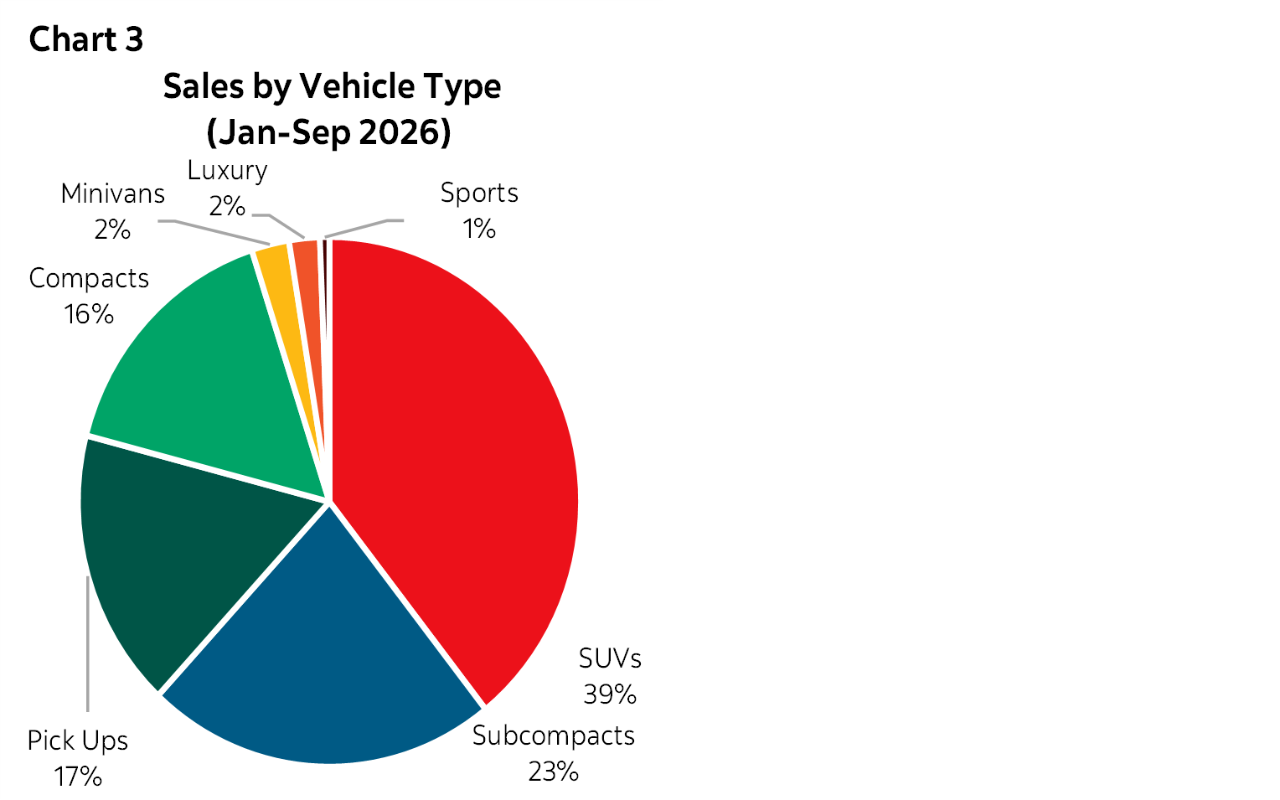
By segment (chart 3), SUVs led domestic sales in Q3-26, with 156,843 units, accounting for 40.3% of sales and increasing 4.7% year over year. Subcompacts followed, with sales slightly above half those of SUVs, at 85,349 units, a 21.9% market share and year-over-year growth of 8.4%. Pickups ranked third, with 68,340 units, growth of 6.7% and a 17.5% market share. Compact cars ranked fourth, with 60,499 units sold and a 15.5% market share. Finally, minivans, luxury cars and sports cars accounted for just 4.7% of domestic sales.
Auto production posts first sub-1mn Q3 in ten years (ex-pandemic)
On the production side, 949,727 vehicles were manufactured in Q3-26, a year-over-year change of -6.4% compared with the same period last year, and below the 1,027,382 vehicles produced in Q2-26. In the first nine months of the year, production totaled 2,528,623 units, a change of -1.5% compared with the same period last year. Production has declined for five consecutive months, with the contraction deepening in September to -15.1%, its weakest reading since March 2024.
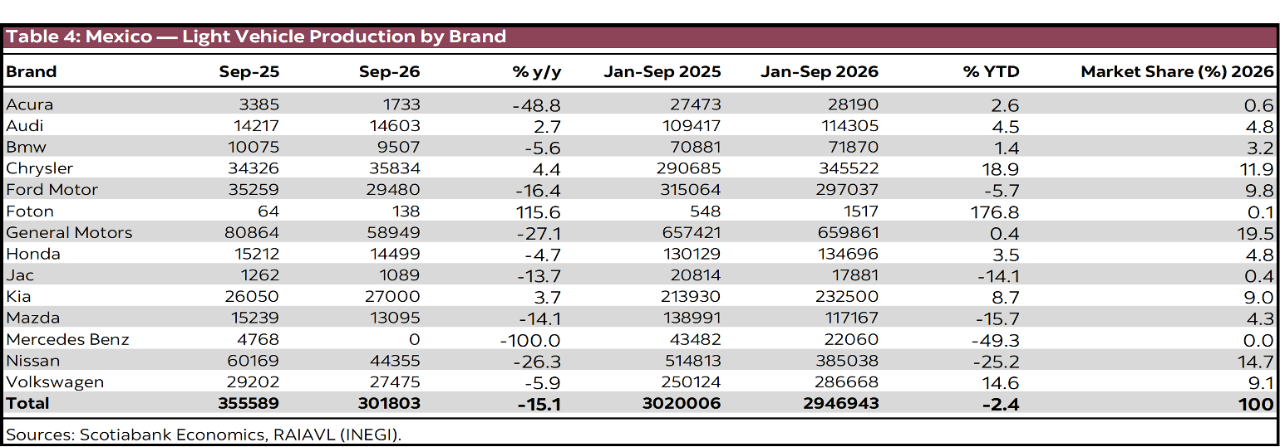
By brand (table 4, at the back), General Motors led production with 214,203 units, representing a 22.6% share and a year-over-year change of -3.2%. Nissan followed with a 13.8% share and 131,466 units, a decline of -24.1%, partly explained by the closure of its Morelos plant at the beginning of the year. Chrysler recorded a quarterly decline of -7.0%, despite growing 34.9% in the first half of the year following an operational expansion; it ranked third with a 10.9% share. Ford and Volkswagen each held a 9.3% share, with declines of -3.2% and -2.7%, respectively.
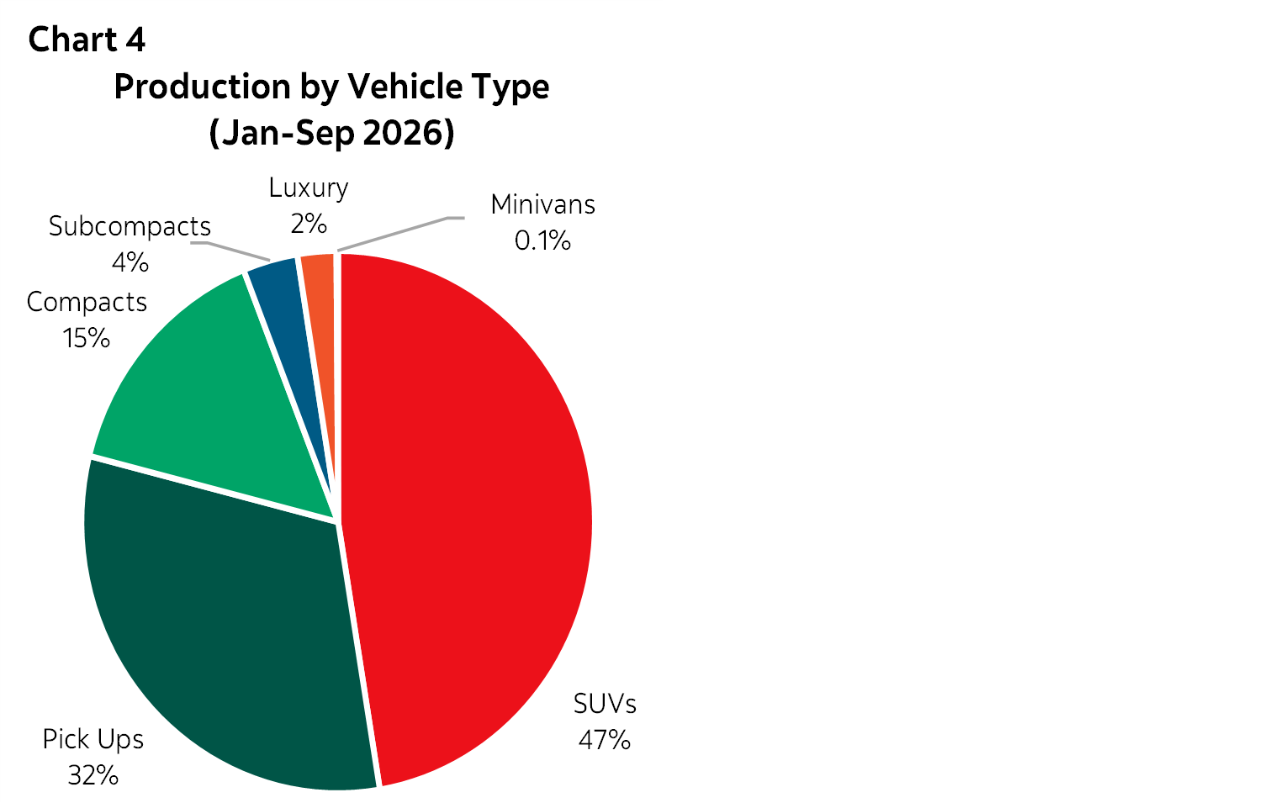
By segment (chart 4), SUVs also led production, accounting for 47.4% of the total, with 450,643 units manufactured, a decline of 16%. Pickups followed with a 30.4% share, totaling 288,393 units during the quarter and growing 13.6% year over year. Compact cars accounted for 15.2% of quarterly production, totaling 143,977 units, a decline of -11.9%.
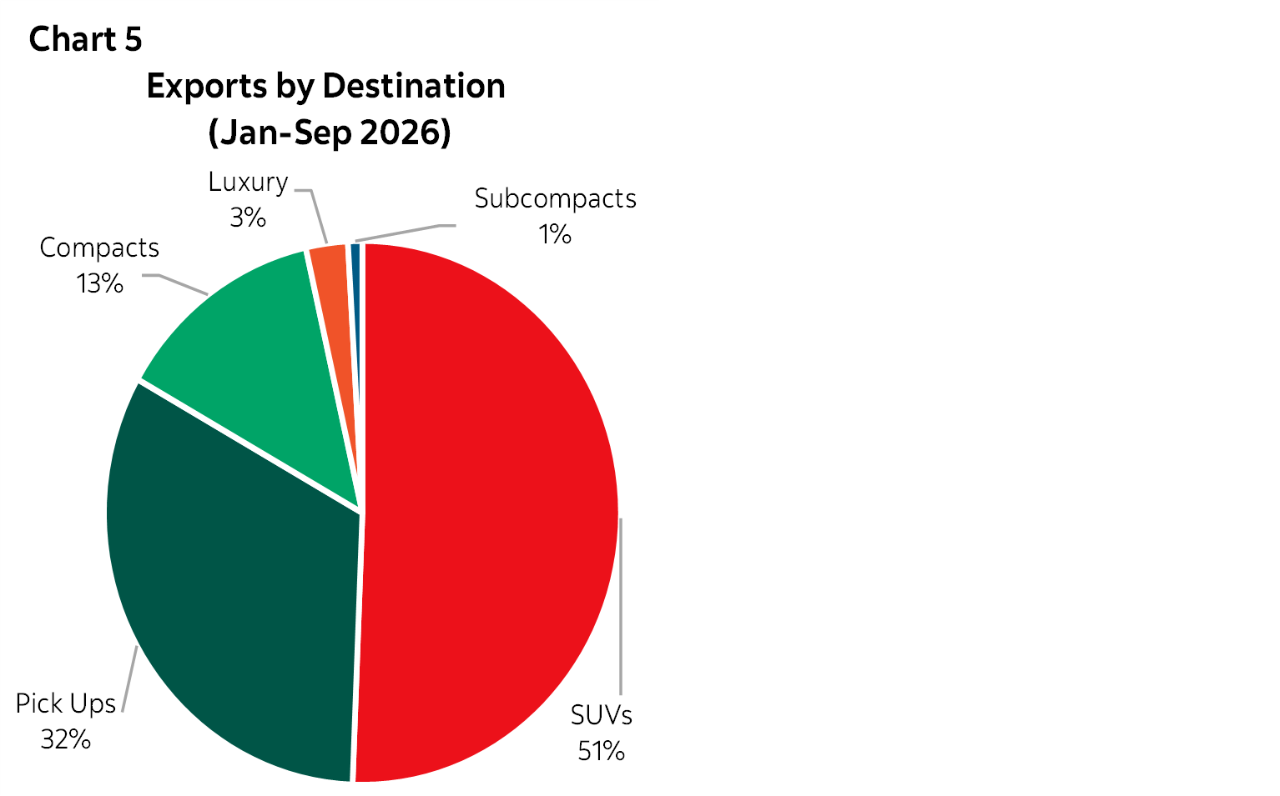
Exports also performed negatively during the quarter: 839,378 units were exported, a year-over-year change of -6.8% compared with Q3 2025 and below the Q2-26 total of 893,614 units (table 5, at the back). Year-to-date exports totaled 2,946,943 units, a decline of -2.4%. Over these nine months, the United States remained the main destination for Mexican automotive exports (chart 5), accounting for 76% of the total, followed by Canada at 12%, Germany at 3% and Brazil at 2%. Other countries accounted for the remaining 7%.
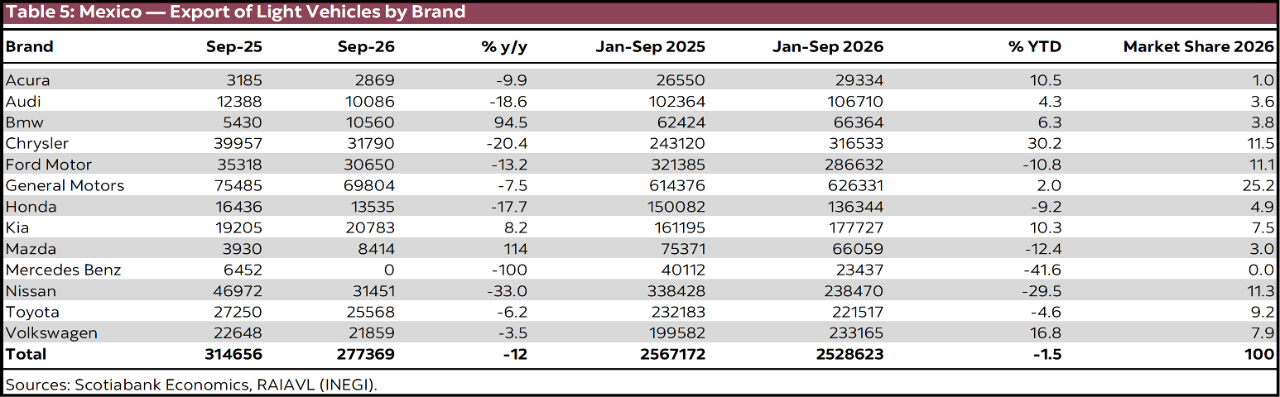
Our previous update noted that exports fell -9.2% in July, and the decline has deepened in recent months, reaching -11.3% in September. This can be explained by shifts in external demand, particularly developments in the United States. U.S. vehicle sales have entered a mature phase, with more moderate year-over-year changes following a period of post-pandemic normalization, as suggested by a tight inventory-to-sales ratio of 1.2 and year-over-year growth of 0.3% in U.S. sales during the third quarter. We therefore believe Mexican automotive exports could remain broadly flat in the near term, in line with a slowdown in the U.S. market.
HEAVY VEHICLES
The heavy vehicle segment has shown some recovery in recent months (chart 6, and tables 6-8, at the back). As discussed in previous reports, growth rates in this segment have benefited from a low comparison base, reflecting substantial weakness a year earlier. Recent increases have not been sufficient to indicate a genuine recovery, as sales, production and exports remain below the levels recorded before the declines in 2024.
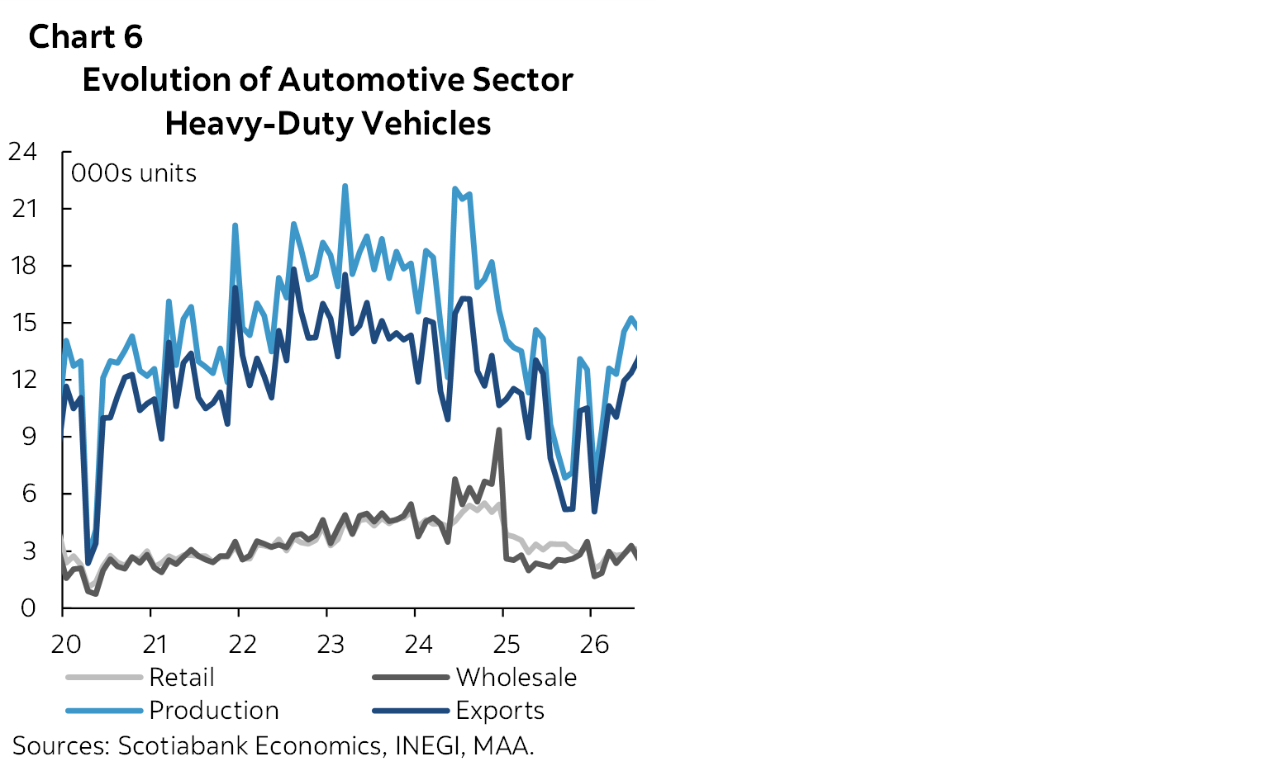
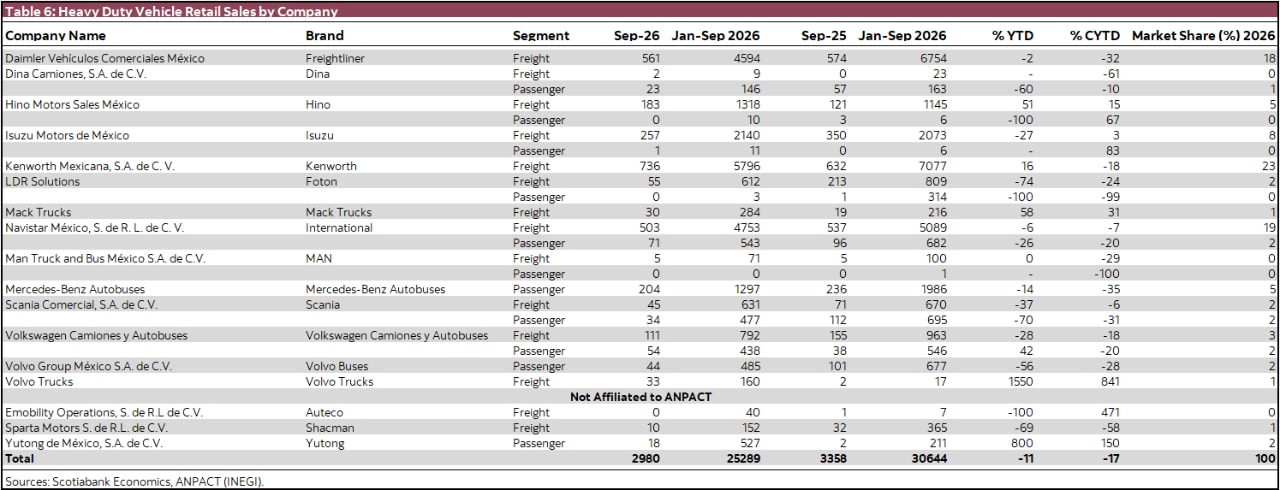
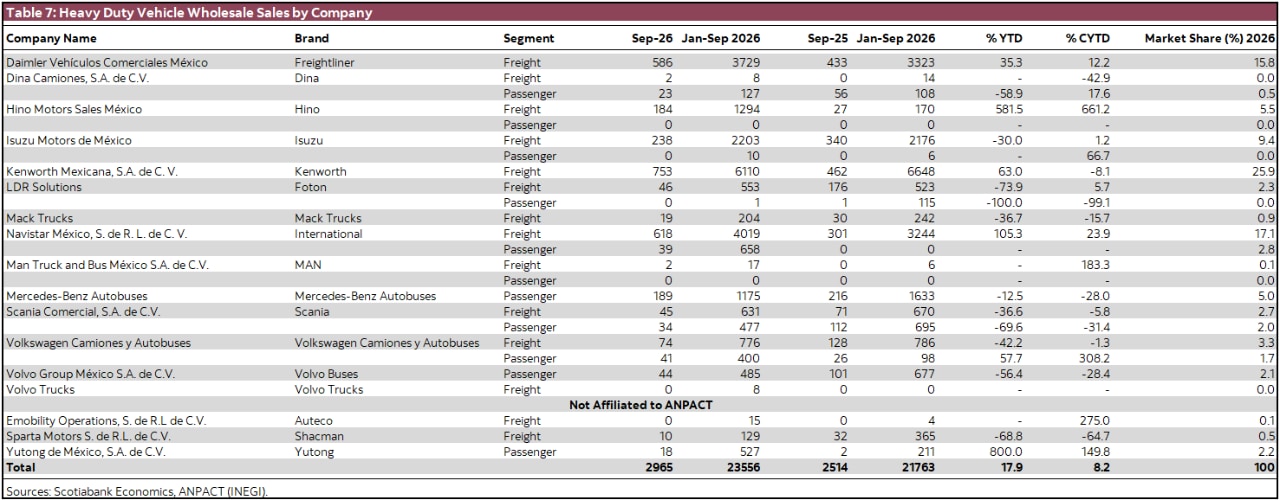
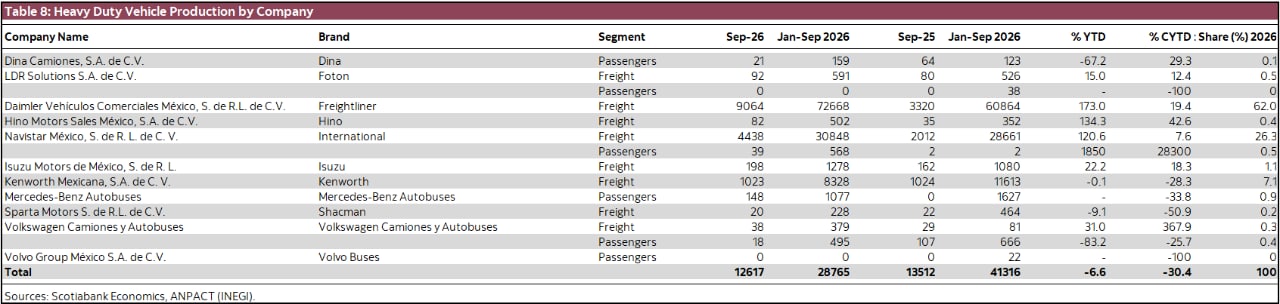
During Q3-26, almost all indicators posted favourable results. Retail sales totaled 9,582 units, a year-over-year change of -5.0%, although they exceeded the 8,795 units recorded in Q2-26. Wholesale sales grew 25.5% year over year to 9,075 units. Production and exports reached 49,167 and 42,930 units, with year-over-year increases of 99.0% and 118.3%, respectively. Year to date, retail sales remained weak, totaling 25,654 units, a decline of -16.3%. In contrast, the other components showed a recovery: wholesale sales totaled 24,051 units, an increase of 10.5%; production reached 120,043 units, up 13.1%; and exports totaled 100,830 units, an increase of 14.8%.
Just as the cumulative weakness in heavy vehicles is closely linked to the low-investment environment that prevailed for more than a year and a half, the segment's recovery is similarly tied to investment. Since April, gross fixed investment has increased by an average of 5.27% year over year, following 19 consecutive months of declines. This recovery has also been evident in machinery and equipment, potentially reflecting fleet replacement and purchases of new transport vehicles by the private sector. While the improvement in recent indicators is a positive sign following a period of contraction, momentum will need to be sustained in the coming months to establish that the sector is heading toward a recovery rather than prolonged stagnation, particularly in domestic sales. Investment in machinery and equipment and external demand—primarily from the United States—will therefore be key to driving production and exports.
CONCLUSION
Overall, Mexico's automotive sector is heading toward year-end with mixed signals. In light vehicles, the entry of new competitors continues to provide meaningful support amid moderating consumption and household income, despite the implementation of tariffs on Chinese vehicles. Meanwhile, heavy vehicle sales have recently benefited from fleet replacement, although they remain well below 2024 levels. Vehicle production and exports, however, remain dependent on momentum in the U.S. market, where demand is slowing. As a result, activity could remain broadly flat in the near term, also weighed down by international uncertainty.
DISCLAIMER
This report has been prepared by Scotiabank Economics as a resource for the clients of Scotiabank. Opinions, estimates and projections contained herein are our own as of the date hereof and are subject to change without notice. The information and opinions contained herein have been compiled or arrived at from sources believed reliable but no representation or warranty, express or implied, is made as to their accuracy or completeness. Neither Scotiabank nor any of its officers, directors, partners, employees or affiliates accepts any liability whatsoever for any direct or consequential loss arising from any use of this report or its contents.
These reports are provided to you for informational purposes only. This report is not, and is not constructed as, an offer to sell or solicitation of any offer to buy any financial instrument, nor shall this report be construed as an opinion as to whether you should enter into any swap or trading strategy involving a swap or any other transaction. The information contained in this report is not intended to be, and does not constitute, a recommendation of a swap or trading strategy involving a swap within the meaning of U.S. Commodity Futures Trading Commission Regulation 23.434 and Appendix A thereto. This material is not intended to be individually tailored to your needs or characteristics and should not be viewed as a “call to action” or suggestion that you enter into a swap or trading strategy involving a swap or any other transaction. Scotiabank may engage in transactions in a manner inconsistent with the views discussed this report and may have positions, or be in the process of acquiring or disposing of positions, referred to in this report.
Scotiabank, its affiliates and any of their respective officers, directors and employees may from time to time take positions in currencies, act as managers, co-managers or underwriters of a public offering or act as principals or agents, deal in, own or act as market makers or advisors, brokers or commercial and/or investment bankers in relation to securities or related derivatives. As a result of these actions, Scotiabank may receive remuneration. All Scotiabank products and services are subject to the terms of applicable agreements and local regulations. Officers, directors and employees of Scotiabank and its affiliates may serve as directors of corporations.
Any securities discussed in this report may not be suitable for all investors. Scotiabank recommends that investors independently evaluate any issuer and security discussed in this report, and consult with any advisors they deem necessary prior to making any investment.
This report and all information, opinions and conclusions contained in it are protected by copyright. This information may not be reproduced without the prior express written consent of Scotiabank.
™ Trademark of The Bank of Nova Scotia. Used under license, where applicable.
Scotiabank, together with “Global Banking and Markets”, is a marketing name for the global corporate and investment banking and capital markets businesses of The Bank of Nova Scotia and certain of its affiliates in the countries where they operate, including; Scotiabank Europe plc; Scotiabank (Ireland) Designated Activity Company; Scotiabank Inverlat S.A., Institución de Banca Múltiple, Grupo Financiero Scotiabank Inverlat, Scotia Inverlat Casa de Bolsa, S.A. de C.V., Grupo Financiero Scotiabank Inverlat, Scotia Inverlat Derivados S.A. de C.V. – all members of the Scotiabank group and authorized users of the Scotiabank mark. The Bank of Nova Scotia is incorporated in Canada with limited liability and is authorised and regulated by the Office of the Superintendent of Financial Institutions Canada. The Bank of Nova Scotia is authorized by the UK Prudential Regulation Authority and is subject to regulation by the UK Financial Conduct Authority and limited regulation by the UK Prudential Regulation Authority. Details about the extent of The Bank of Nova Scotia's regulation by the UK Prudential Regulation Authority are available from us on request. Scotiabank Europe plc is authorized by the UK Prudential Regulation Authority and regulated by the UK Financial Conduct Authority and the UK Prudential Regulation Authority.
Scotiabank Inverlat, S.A., Scotia Inverlat Casa de Bolsa, S.A. de C.V, Grupo Financiero Scotiabank Inverlat, and Scotia Inverlat Derivados, S.A. de C.V., are each authorized and regulated by the Mexican financial authorities.
Not all products and services are offered in all jurisdictions. Services described are available in jurisdictions where permitted by law.