- Well over half of the increase in inflation observed in Canada reflects global factors and supply challenges. The impact of these factors is largely transitory, but they have impacted inflation expectations and monetary policy as a result.
- Purely domestic factors account for a small, but important, share of inflation. Pandemic support programs for firms and households are creating the excess demand that the country is experiencing. Absent from these support measures, Canada would still be in excess supply.
- While the resulting increase in the output gap only accounts for less than half a percentage point of the rise in inflation since the end of 2019, it accounts for up to 125 basis points of the total tightening expected by the Bank of Canada.
- In other words, the Bank of Canada’s policy rate would not need to be above neutral were it not for these programs.
There is some debate regarding the drivers of inflation in Canada and as a consequence the Bank of Canada’s ability to lower it. Some view inflation as mostly transitory and tributary to factors that are beyond the reach or influence of Canadian policymakers. If this were true, then attempts by the BoC to respond to these inflationary pressures would place an undue burden on Canadian firms and households as it tamps down economic activity to lower inflation.
We use our macroeconometric forecasting model to identify the causes of the rise in inflation since the end of 2019 and the required monetary response. A number of key observations flow from our work:
a. Around 50% of the increase in inflation observed since the end of 2019 can be ascribed to global or foreign factors. These include US inflation, commodity prices and movements in the exchange rate.
b. Supply challenges that largely reflect developments at the global level account for another 35% of the rise in inflation.
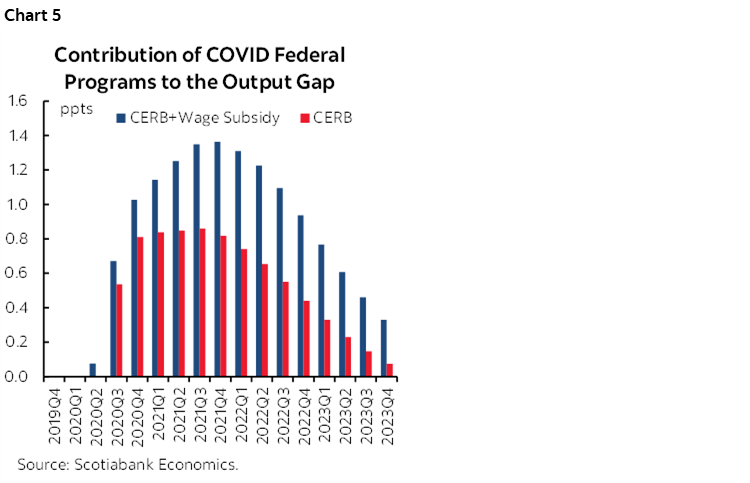
c. The welcome, but likely exaggerated, fiscal support provided by the Federal government in response to the pandemic: the Canada Emergency Response Benefit, the Canada Recovery Benefit, the Canada Wage Subsidy, and the Canada Rent Relief Program had a major impact on the output gap. We estimate that these programs raised the output gap by about 1.3 percentage points, implying that the excess demand we see now in Canada would not be present without these supports.
d. While the impact of these programs on the output gap is large, the empirical impact of the output gap on inflation is modest, leading us to estimate that government transfers account for around 0.45 percentage points of the rise in inflation we have observed since the end of 2019.
e. While 0.45% is small given the size of the other factors driving inflation, it still necessitates a substantial monetary response. We estimate that up to 125bps of the total rise of 400bps that we currently expect (from 0.25% at the start of the tightening phase to our expected endpoint of 4.25%) is in response to pandemic support measures.
Our outlook assumes a gradual decline in inflation over the next 12–18 months. Inflation should average about 6.8% this year, then fall to 4.0% next year and return to the Bank of Canada’s 2 percent target in 2024. Much of the reduction in inflation stems from a reversal of the global factors that have pushed inflation up in Canada and elsewhere. These factors (largely commodity prices and supply bottlenecks) have mostly unwound the gains made over the last year and appear to be slowly working their way through to inflation. That is expected to continue. Tighter monetary policy will also impact inflation, as it helps slow the domestic economy, which is now clearly in excess demand. We forecast that the BoC will end the tightening cycle with a terminal rate of 4.25%. This rate path, along with formidable headwinds coming from Europe and China, is expected to lead to a very mild recession, akin to a stall in growth, in the first half of 2022. The economy is then expected to resume growing at a very modest pace, leading to growth of around half a percent in 2023.
OUR EMPIRICAL APPROACH
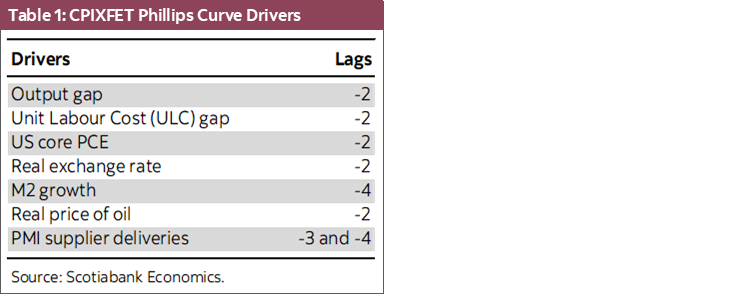
In the Scotiabank Canada/US macroeconomic model, Canadian core inflation (CPI excluding food, energy, and taxes or CPIXFET1) is a function of one lag to capture nominal rigidities, a lead to represent forward-looking expectations and 7 keys drivers that are sources of shocks. These drivers are listed in Table 1. They include domestic variables like the output gap, unit labour costs and money supply (i.e., M2). In addition, supply constraints/bottlenecks (i.e., captured by the PMI supplier delivery index), international core inflation pressures (proxied by the US core PCE inflation), the exchange rate and the price of oil also play a role.2 In “normal times”, the most important drivers are the output gap, unit labour costs, the exchange rate and the price of oil. In times of important widespread global inflation pressure and supply constraints such as what we have been experiencing, the PMI supplier delivery and the US core inflation become very important drivers of inflation. In our model, total CPI inflation is forecast by combining the CPIXFET forecast with the price of oil.
IDENTIFYING THE SOURCES OF THE RISE IN INFLATION
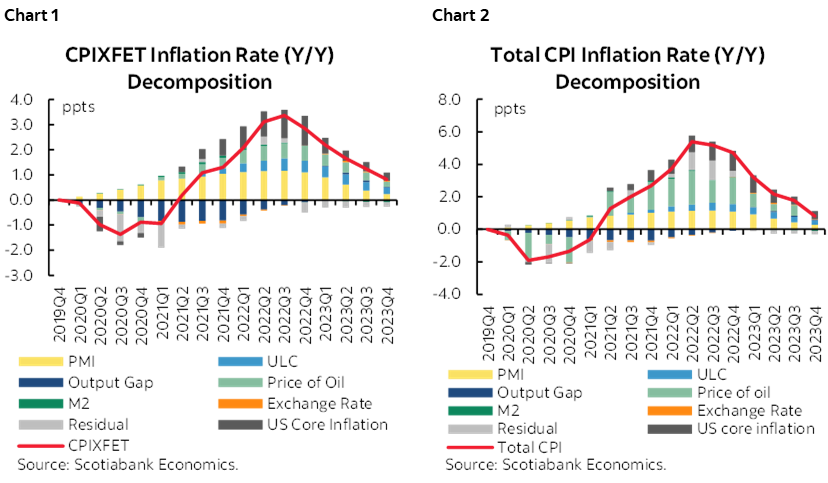
We can decompose the historical and forecasted paths of CPIXFET and total CPI into the contributions of the key 7 inflation drivers by simulating our model.3 Charts 1 and 2 show the cumulative impact of these drivers on CPIXFET and total CPI since 2019Q4 and until the end of 2023. The inflation rates are deviations from the 2% BoC inflation target. The model cannot, of course, explain all the movements in inflation and there is, at times, a sizeable residual. Note that the impacts identified in these charts reflect the direct impact of each variable on inflation through the Phillips curve, but also the indirect impact of some variables on the macroeconomic outlook. For example, oil prices have a direct impact on inflation, but also ultimately impact the output gap, which then affects inflation through this additional indirect channel.
FROM THE DECOMPOSITION OF CPIXFET, WE COULD DRAW THE FOLLOWING CONCLUSIONS:
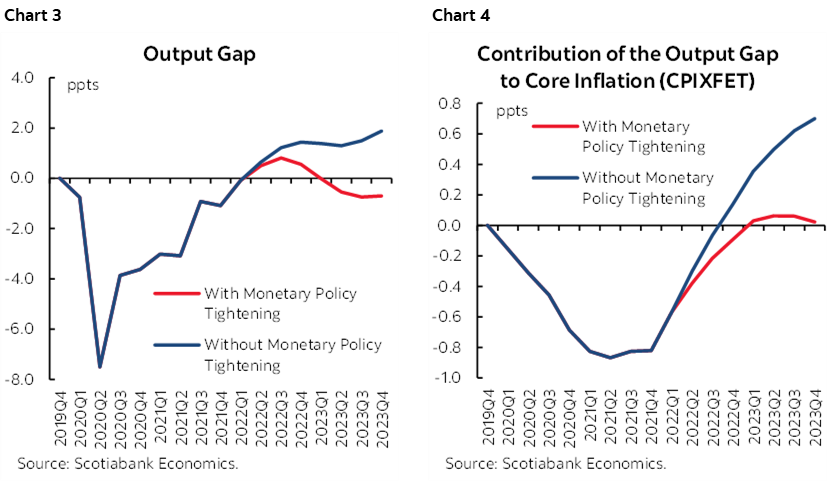
- During the confinement phase of Covid and beyond, the economy was in excess supply and therefore the output gap was pushing inflation down. In 2022, an excess demand opened (+0.75% in 2022Q3), and the contribution of the output gap became slightly positive. The positive contribution is small and short-lived because the expected mild recession in early 2023 will eventually push the economy into excess supply again. This is mainly the result of the monetary policy tightening. If the Bank of Canada hadn’t tightened its monetary policy, the size and the persistence of the excess demand cycle would have been a lot larger (see chart 3) and we would have been forecasting a persistent and substantially higher inflation rate, both over recent history and in 2023 (see chart 4).
- As wages gradually catch up with inflation, the contribution of unit labour costs to core inflation has risen and should be positive through 2023.
- Supply constraints and bottlenecks matter. Since Covid, there is an important rising positive contribution of the PMI supplier deliveries that culminated in mid-2022. The recent improvement of the supply constraints captured by the PMI explains why the contribution of the PMI to core inflation is fading and will disappear through 2023. This improvement is key to explaining why we are expecting a fall in CPIXFET inflation in 2023.
- Global inflation pressures play a very important role in explaining the recent rise of inflation and its persistence through the next year. The contribution of US core inflation peaked in the second half of 2022 but will continue to put upward, but diminishing, pressure on Canadian inflation throughout 2023.
- The rise in the price of oil is also playing a role because it increases the input cost of producing goods and services.
- It is interesting to note the positive residual in 2022Q2 and 2022Q3. This coincides with the war in Ukraine. This is probably not a coincidence, as the war increased the prices of inputs of production not included in the model, like metal prices. It could also be linked to the positive effect of the monetary policy tightening on rents—another driver not fully accounted for by the model.
The total CPI decomposition chart mostly mirrors the CPIXFET decomposition. There are two notable exceptions. First, as expected, the contribution of oil prices is larger than that of CPIXFET. Second, the residuals in 2022Q2 and 2022Q3 are larger. This is also expected because the war in Ukraine increased food prices which are excluded from the measure of core inflation we use.
At the core inflation in 2022Q3, the purely international factor (US inflation, oil prices and a large share of the residual) explains around 50% of the deviation of inflation from the target, with the supply constraints (i.e., PMI) at 35% and the domestic factors at only 15%. Since we know that much of the supply constraints affecting Canadian firms are global in nature, this means that the proportion of inflation that is driven by international factors is well above 50%.
From the Bank of Canada’s perspective, the effect of international price shocks and supply bottlenecks on inflation is difficult to tackle through domestic monetary policy. In the current context, the relative importance of these shocks is far more important than observed over history. Therefore, policy reaction functions calibrated to history might not be appropriate or optimal to tackle these shocks. In fact, our simulations show that using such a reaction function to fight the effect of these types of shocks on inflation might create an important decline in economic activity in exchange for a relatively small reduction of the inflation. We have long accounted for this in our forecast, as markets have also seemed to, since the total rise in rates that we predict is substantially lower than if the BoC responded to all the factors driving inflation up. That being said, these foreign and supply factors have impacted inflation expectations and that has required a monetary response. Roughly speaking, we estimate that this factor required the removal of extraordinary monetary accommodation and a return to a neutral policy stance (our estimate of the neutral policy rate is 2.5%).
THE IMPACT OF PANDEMIC SUPPORT MEASURES ON INFLATION AND INTEREST RATES
The Federal government provided generous supports to firms and households to help them navigate the impacts of the pandemic. The Canada Emergency Response Benefit and its successor Canada Recovery Benefit provided $98 billion in assistance to households as captured in Statistics Canada’s System of Macroeconomic Accounts. On the business side, the Canada Emergency Wage Subsidy and the Temporary Wage Subsidy provided $97 billion in support to firms. Our analysis focuses on these programs, though other smaller programs provided a modest amount of additional support.
These programs had a large and welcome impact on the economy. We simulated the impact of these programs using outlay data through 2022Q2 and estimate that these transfers increased the output gap by 1.3 percentage points at its peak (chart 5).4 This was, of course, largely an intended consequence of the programs, but the economic and employment response of these programs created more inflationary pressures than would otherwise have occurred. It bears noting that the Canadian economy would likely still be in excess supply in the absence of these support programs, implying that our economy would be operating below its capacity.
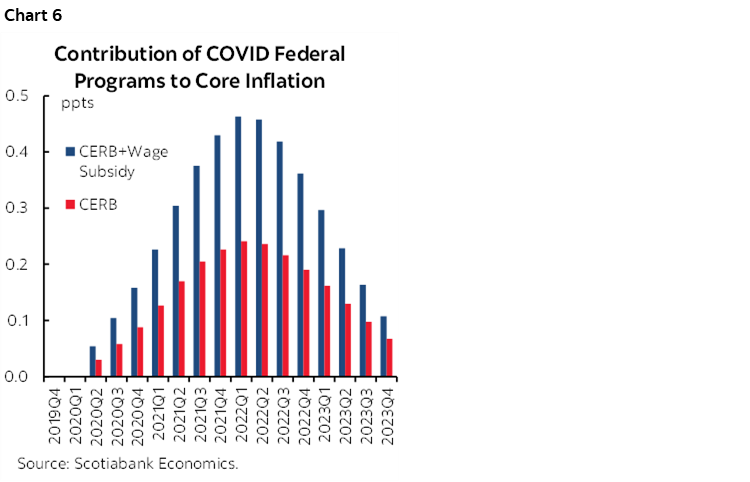
This impact on the output gap created an inflationary impulse that is being addressed by the Bank of Canada. Our analysis suggests that the increase in the output gap attributable to these programs added up 0.45 percentage points to the level of core inflation relative to 2019Q4 (chart 6). This is of course a small fraction of the 3.4 percentage point increase in core inflation observed over this time frame, but it is nevertheless significant. It should be noted that this is likely an overestimation of the impact as we have no way of accounting for the impact wage subsidies might have had on unit labour costs. It stands to reason that a temporarily lower cost of labour would lower unit labour costs, but we are unable to estimate this impact. As chart 6 shows, the impact of wage subsidies is reasonably low in relation to the direct transfers to households even though we believe the impact of those subsidies is overestimated.
We estimate that offsetting the inflationary impulse of the pandemic support programs alone will have required up to a 125 basis point rise in the BoC’s policy rate by the time it is done tightening. Since we forecast a terminal rate of 4.25% for the BoC, the response to these support measures accounts for up to 30% of the total rise in rates expected in this cycle. If we add to this the effect of the recently announced provincial and federal inflation-related transfers, that share increases to 38%.
CONCLUSION
Canadian inflation is driven largely by global inflation pressures and supply constraints. The source of this inflation implies a muted monetary policy reaction relative to a surge in inflation associated with domestic factors. At a minimum, these inflationary shocks and their impact on inflation expectations require a normalization of policy, meaning a return to a neutral policy rate. We assume this rate is 2.5% and the BoC estimates that it lies somewhere between 2 and 3%.
Given the increase in the output gap owing to pandemic support programs, the BoC must raise its policy by about 125bps beyond the BoC’s estimate of the upper range of its neutral rate estimate.
1 Earlier work finds that CPI excluding food, energy and indirect taxes is the best indicator of future inflation out of a range of inflation measures.
2 Results are robust to pre-Covid sample estimation.
3 In the simulations we assume that the policy rate stays at the lower bound until the BoC started to raise interest rates which are allowed to move thereafter.
4 The economic impact of these programs was estimated by incorporating the CERB and CRB payments into disposable income in our model. For the wage subsidies, we relied on employment impacts estimated by Statistics Canada to estimate the impact on the unemployment rate, which affects a broad range of variables in our model.
DISCLAIMER
This report has been prepared by Scotiabank Economics as a resource for the clients of Scotiabank. Opinions, estimates and projections contained herein are our own as of the date hereof and are subject to change without notice. The information and opinions contained herein have been compiled or arrived at from sources believed reliable but no representation or warranty, express or implied, is made as to their accuracy or completeness. Neither Scotiabank nor any of its officers, directors, partners, employees or affiliates accepts any liability whatsoever for any direct or consequential loss arising from any use of this report or its contents.
These reports are provided to you for informational purposes only. This report is not, and is not constructed as, an offer to sell or solicitation of any offer to buy any financial instrument, nor shall this report be construed as an opinion as to whether you should enter into any swap or trading strategy involving a swap or any other transaction. The information contained in this report is not intended to be, and does not constitute, a recommendation of a swap or trading strategy involving a swap within the meaning of U.S. Commodity Futures Trading Commission Regulation 23.434 and Appendix A thereto. This material is not intended to be individually tailored to your needs or characteristics and should not be viewed as a “call to action” or suggestion that you enter into a swap or trading strategy involving a swap or any other transaction. Scotiabank may engage in transactions in a manner inconsistent with the views discussed this report and may have positions, or be in the process of acquiring or disposing of positions, referred to in this report.
Scotiabank, its affiliates and any of their respective officers, directors and employees may from time to time take positions in currencies, act as managers, co-managers or underwriters of a public offering or act as principals or agents, deal in, own or act as market makers or advisors, brokers or commercial and/or investment bankers in relation to securities or related derivatives. As a result of these actions, Scotiabank may receive remuneration. All Scotiabank products and services are subject to the terms of applicable agreements and local regulations. Officers, directors and employees of Scotiabank and its affiliates may serve as directors of corporations.
Any securities discussed in this report may not be suitable for all investors. Scotiabank recommends that investors independently evaluate any issuer and security discussed in this report, and consult with any advisors they deem necessary prior to making any investment.
This report and all information, opinions and conclusions contained in it are protected by copyright. This information may not be reproduced without the prior express written consent of Scotiabank.
™ Trademark of The Bank of Nova Scotia. Used under license, where applicable.
Scotiabank, together with “Global Banking and Markets”, is a marketing name for the global corporate and investment banking and capital markets businesses of The Bank of Nova Scotia and certain of its affiliates in the countries where they operate, including; Scotiabank Europe plc; Scotiabank (Ireland) Designated Activity Company; Scotiabank Inverlat S.A., Institución de Banca Múltiple, Grupo Financiero Scotiabank Inverlat, Scotia Inverlat Casa de Bolsa, S.A. de C.V., Grupo Financiero Scotiabank Inverlat, Scotia Inverlat Derivados S.A. de C.V. – all members of the Scotiabank group and authorized users of the Scotiabank mark. The Bank of Nova Scotia is incorporated in Canada with limited liability and is authorised and regulated by the Office of the Superintendent of Financial Institutions Canada. The Bank of Nova Scotia is authorized by the UK Prudential Regulation Authority and is subject to regulation by the UK Financial Conduct Authority and limited regulation by the UK Prudential Regulation Authority. Details about the extent of The Bank of Nova Scotia's regulation by the UK Prudential Regulation Authority are available from us on request. Scotiabank Europe plc is authorized by the UK Prudential Regulation Authority and regulated by the UK Financial Conduct Authority and the UK Prudential Regulation Authority.
Scotiabank Inverlat, S.A., Scotia Inverlat Casa de Bolsa, S.A. de C.V, Grupo Financiero Scotiabank Inverlat, and Scotia Inverlat Derivados, S.A. de C.V., are each authorized and regulated by the Mexican financial authorities.
Not all products and services are offered in all jurisdictions. Services described are available in jurisdictions where permitted by law.