ASSESSING THE NATIONAL MARKET’S MAY PERFORMANCE AHEAD OF THE BANK OF CANADA’S RATE DECISION
Canada’s housing market has been showing signs of gathering steam over the last couple of months. April’s sales activity surpassed expectations as it recorded a staggering double-digit increase following two smaller monthly increases in February and March. National data are published with a short lag to the data reported for the country’s major real estate markets. We do not formally report on these “early” data on a regular basis, but are doing so now given the importance we believe housing market developments should play in the Bank of Canada’s June 7 decision. Please refer to Derek Holt’s Global Week Ahead for a full rundown of the factors underlying our view that the Bank of Canada will raise rates this week.
From a housing perspective, the acceleration observed in April, and compounded in May, suggested housing-related activity may stop being the drag on growth it had been for much of last year. The Bank of Canada can ill afford for the most interest-sensitive segment of our economy to roar ahead when it is actively trying to cool the economy and inflation.
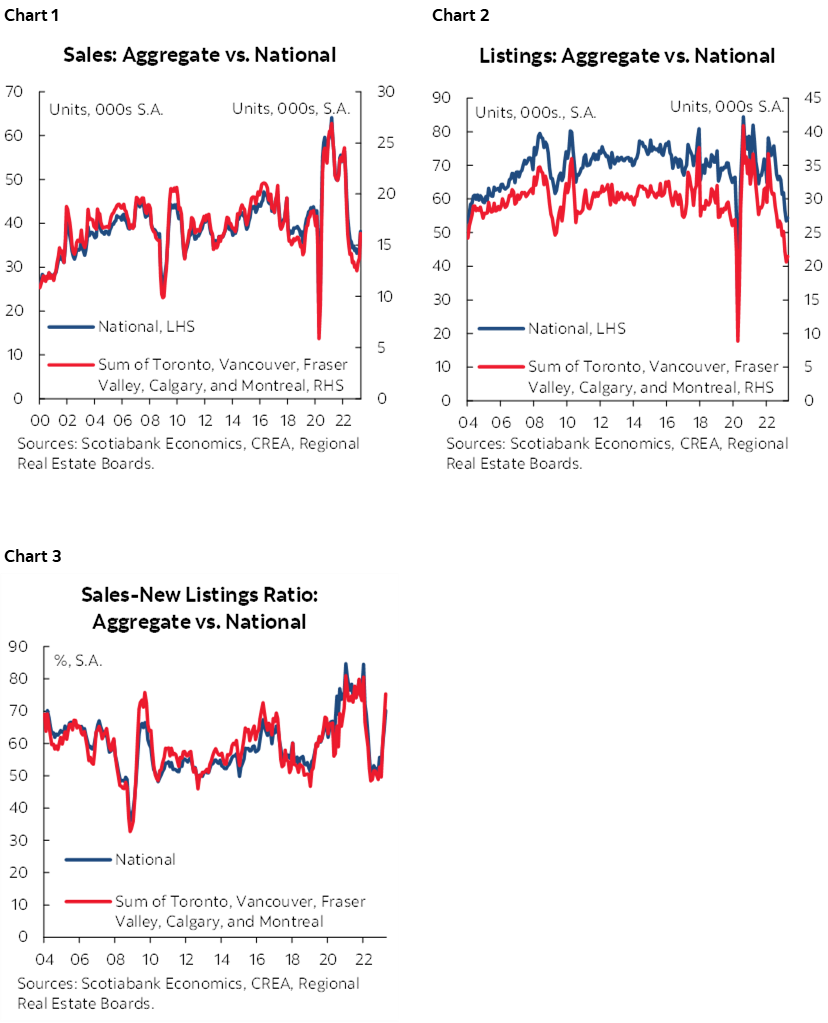
Regional releases for the month of May from Toronto, Vancouver, Calgary, Fraser Valley (the market that has been driving much of the recent national strength), and Montreal point to a continued acceleration in the housing market. These markets provide an approximation of the national market’s May performance as movements at the national level have largely tracked the aggregate performance of these regional markets over history (charts 1, 2 and 3).
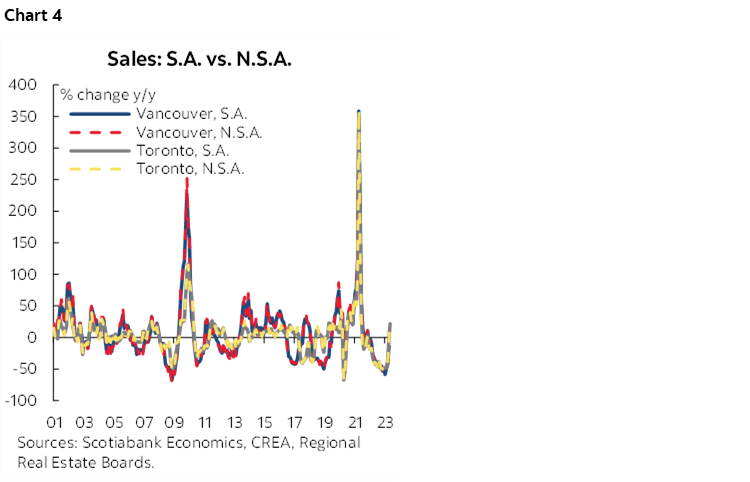
Here, where only not seasonally adjusted (NSA) year-over-year changes were reported by a regional board, we estimate the seasonally adjusted (SA) month-over-month changes by applying the same year-over-year growth to last year’s SA data. In principle, the year-over-year growth should be relatively similar whether seasonally adjusted or not as it would be referencing the same time of year and season. Indeed, when charting SA and NSA y/y % for the different regions, the two move closely together (chart 4 shows the different growth rates for Vancouver and Toronto sales as an example).
Regional May results are reported in table 1.

Home sales seem to have increased in all the reported major regional markets in May, pointing to an aggregate performance in May that is almost 10% stronger than in April. Given how closely the national market tracks the aggregate of these regional markets, this points to incoming strength at the national level when the national data are released mid June. The good news is that it seems the return of buyers to the market over the past couple of months has triggered a return of some sellers to the market as well. New listings had been dropping dramatically as sales picked up steam, and they recorded only a small increase of 1.6% in April when sales had recorded a double-digit increase. May’s regional results however point to a much larger increase in listings of 23%.
April’s level of listings was 26% below the month’s 2000–19 average. The estimated aggregate monthly increase in May points to an implied aggregate that is 13% below the month’s 2000–19 average—still low but an improvement from April.
There is less of a standardization in the regional reporting of prices as different regional boards report different price measures (average sales price, MLS home price index, MLS benchmark price index), therefore these are not reported in the table. However, it is the case that regardless of the chosen price measure, all markets reported monthly increases in their respective price measures—indicating a monthly price gain at the national level, consistent with persistent tightness in the market despite May’s increase in listings, as listings remain low in the face of pent-up demand and strong immigration and population growth.
Nonetheless, the larger increase in listings relative to sales suggests a bit of easing in the sales-to-new listings ratio to 66.9%, down from an aggregate of 75.4% in April (this is the sum of sales across the reported regional markets divided by the sum of their new listings, the national sales-to-new listings ratio in April was 70.2%). This is still above the ratio’s long-term average of 55%, however, and points to continued pressure on prices at least in the short-run. But if this trend of increasing listings and an easing sales-to-new listings ratios proves to be true and sustainable at the national level, it could mean less pressure on prices than otherwise would be as demand picks up.
If the national data for the month of May is in line with the regional aggregate estimated here, the housing market would be acting as a strong driver of economic growth in Q2 via residential investment and consumption of goods and services related to housing. Combined with April’s flash guidance from Statistics Canada and strength in higher frequency data so far this quarter, this points to significant upside risk to the Bank of Canada’s forecast of 1% Q/Q in 2023Q2, which is based on as assumption that the rebound of the housing market won’t occur until the second half of 2023. This supports the case for an additional hike by the Bank of Canada to thwart the impact of a premature recovery in the housing market on excess demand and inflationary pressures, not to mention stability concerns.
DISCLAIMER
This report has been prepared by Scotiabank Economics as a resource for the clients of Scotiabank. Opinions, estimates and projections contained herein are our own as of the date hereof and are subject to change without notice. The information and opinions contained herein have been compiled or arrived at from sources believed reliable but no representation or warranty, express or implied, is made as to their accuracy or completeness. Neither Scotiabank nor any of its officers, directors, partners, employees or affiliates accepts any liability whatsoever for any direct or consequential loss arising from any use of this report or its contents.
These reports are provided to you for informational purposes only. This report is not, and is not constructed as, an offer to sell or solicitation of any offer to buy any financial instrument, nor shall this report be construed as an opinion as to whether you should enter into any swap or trading strategy involving a swap or any other transaction. The information contained in this report is not intended to be, and does not constitute, a recommendation of a swap or trading strategy involving a swap within the meaning of U.S. Commodity Futures Trading Commission Regulation 23.434 and Appendix A thereto. This material is not intended to be individually tailored to your needs or characteristics and should not be viewed as a “call to action” or suggestion that you enter into a swap or trading strategy involving a swap or any other transaction. Scotiabank may engage in transactions in a manner inconsistent with the views discussed this report and may have positions, or be in the process of acquiring or disposing of positions, referred to in this report.
Scotiabank, its affiliates and any of their respective officers, directors and employees may from time to time take positions in currencies, act as managers, co-managers or underwriters of a public offering or act as principals or agents, deal in, own or act as market makers or advisors, brokers or commercial and/or investment bankers in relation to securities or related derivatives. As a result of these actions, Scotiabank may receive remuneration. All Scotiabank products and services are subject to the terms of applicable agreements and local regulations. Officers, directors and employees of Scotiabank and its affiliates may serve as directors of corporations.
Any securities discussed in this report may not be suitable for all investors. Scotiabank recommends that investors independently evaluate any issuer and security discussed in this report, and consult with any advisors they deem necessary prior to making any investment.
This report and all information, opinions and conclusions contained in it are protected by copyright. This information may not be reproduced without the prior express written consent of Scotiabank.
™ Trademark of The Bank of Nova Scotia. Used under license, where applicable.
Scotiabank, together with “Global Banking and Markets”, is a marketing name for the global corporate and investment banking and capital markets businesses of The Bank of Nova Scotia and certain of its affiliates in the countries where they operate, including; Scotiabank Europe plc; Scotiabank (Ireland) Designated Activity Company; Scotiabank Inverlat S.A., Institución de Banca Múltiple, Grupo Financiero Scotiabank Inverlat, Scotia Inverlat Casa de Bolsa, S.A. de C.V., Grupo Financiero Scotiabank Inverlat, Scotia Inverlat Derivados S.A. de C.V. – all members of the Scotiabank group and authorized users of the Scotiabank mark. The Bank of Nova Scotia is incorporated in Canada with limited liability and is authorised and regulated by the Office of the Superintendent of Financial Institutions Canada. The Bank of Nova Scotia is authorized by the UK Prudential Regulation Authority and is subject to regulation by the UK Financial Conduct Authority and limited regulation by the UK Prudential Regulation Authority. Details about the extent of The Bank of Nova Scotia's regulation by the UK Prudential Regulation Authority are available from us on request. Scotiabank Europe plc is authorized by the UK Prudential Regulation Authority and regulated by the UK Financial Conduct Authority and the UK Prudential Regulation Authority.
Scotiabank Inverlat, S.A., Scotia Inverlat Casa de Bolsa, S.A. de C.V, Grupo Financiero Scotiabank Inverlat, and Scotia Inverlat Derivados, S.A. de C.V., are each authorized and regulated by the Mexican financial authorities.
Not all products and services are offered in all jurisdictions. Services described are available in jurisdictions where permitted by law.