Next Week's Risk Dashboard
- Gullible markets?
- US core PCE inflation probably rose a little less than core CPI
- Eurozone CPI starts the march to the next ECB meeting
- CDN GDP and serial shocks
- China PMIs could continue to stabilize
- Deadline to avoid a US government shutdown
- Banxico outlook complicated by the Fed’s shift
- BanRep expected to hold again on elevated inflation
- BoT may deliver another hike
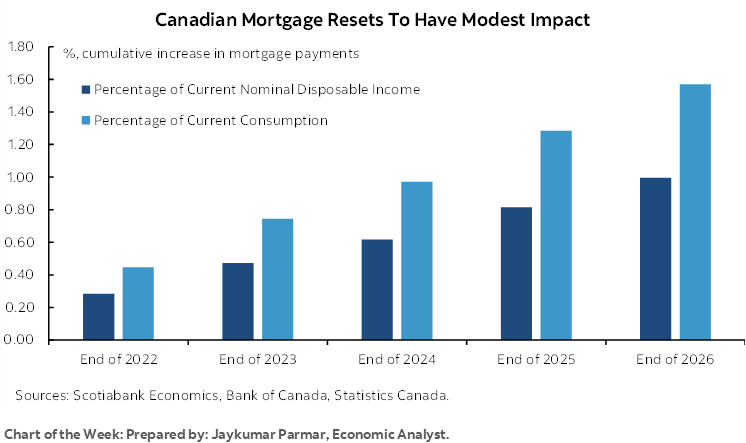
- Canada’s economy should be able to handle mortgage rate resets
Chart of the Week
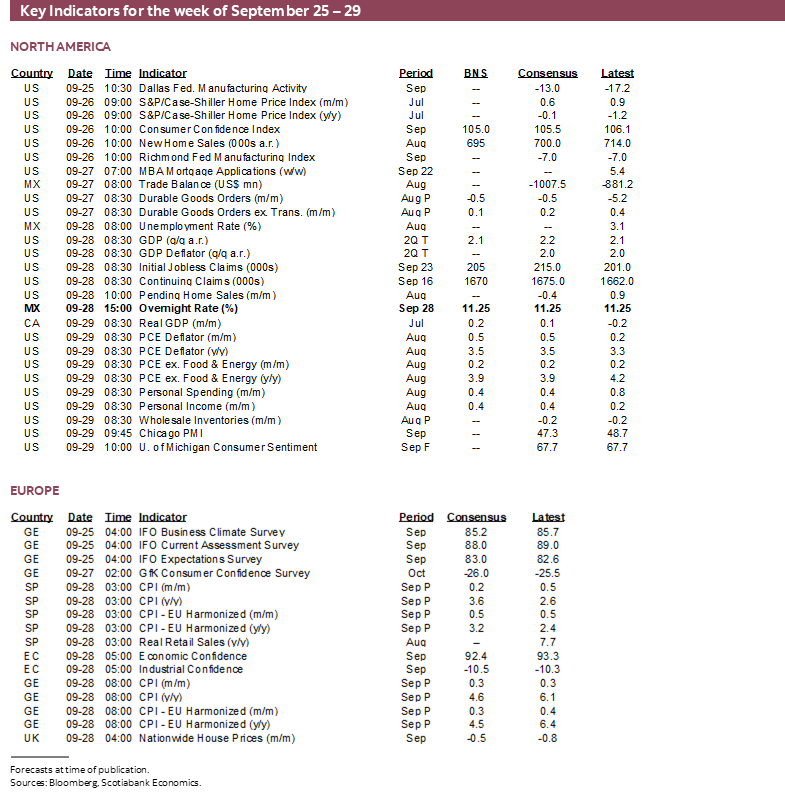
The coming week should offer much lighter calendar-based risk to global markets than the past week that was heavily driven by a deluge of communications from major global central banks. There will be a small number of central banks weighing in, but none of them have the potential to impact the global market tone and few if any are expected to change anything. Data risk will be highly skewed to Friday with potentially important releases out of the US, Eurozone, Canada and China.
The Federal Reserve was the prime culprit for this past week’s upheaval across global financial markets that had the bond market at its epicenter. It may be fairer to say that market gullibility was the main culprit.
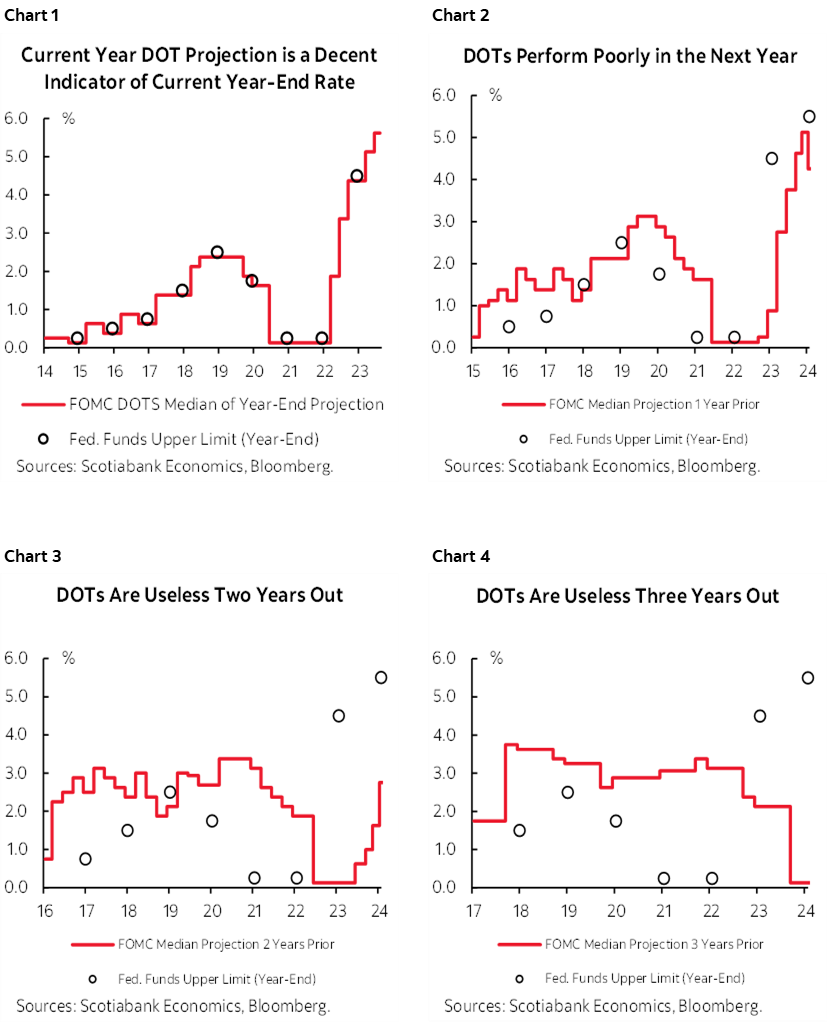
I’m surprised by the extent to which markets believed the Fed’s fortune tellers and palm readers this past week. Most of us know better than to assign much importance to the FOMC’s randomly scribbled dots that depicted a higher for longer bias toward the policy rate including reducing projected easing next year to 50bps from twice that previously. The evidence is clear in that the dots outside of the current year tend to perform poorly as guides to what actually happens to the Fed’s main policy tool. This is backed by charts 1 – 4 that track what actually happens to the fed funds policy rate relative to what the dots predicted in each of the current year, one-year out, two-years out and three-years ahead. Yet markets chose to chase the dots in driving Treasury curve steepener trades.
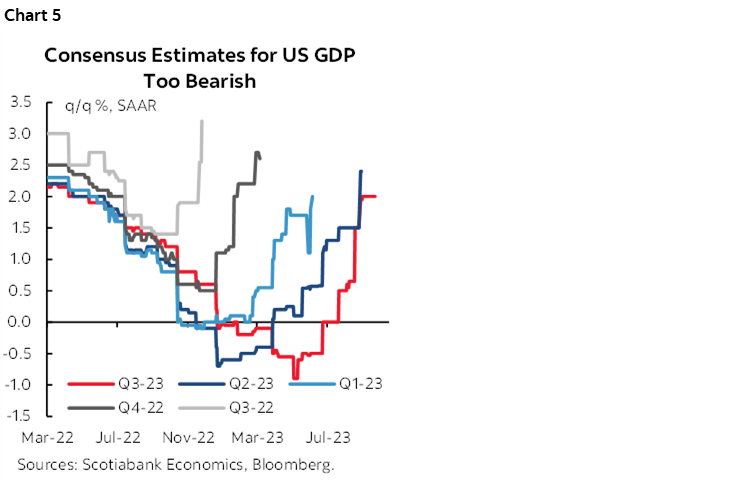
Potentially rethinking the wisdom of having done so may be the biggest off-calendar market risk into the coming week. The US 10-year yield at just shy of 4½% strikes me as pricing in a beautiful world in which inflation is magically crushed while the sensitivity of growth to interest rates is assumed to be negligible. At some point—and I know that consensus keeps pushing it out for five quarters in a row and counting so far (chart 5)—we are bound to see more evidence of the effects of higher borrowing costs especially if they go higher. The US economy has a number of things in its favour today relative to its past, such as stronger consumer finances, but it isn’t totally rate inelastic. Pain is the point of monetary tightening even if some central bankers have adopted a ‘who me’ posture that to most economists sounds a tad deceitful. Without some pain—perhaps quite a bit—monetary policy won’t do its job in getting inflation durably lower.
When and how this point arrives is uncertain. It could unfold gradually, but history often counsels being prepared for it to arrive suddenly whether through a rapid change in sentiment and/or by coming in one day and getting walloped by an unexpectedly weak report.
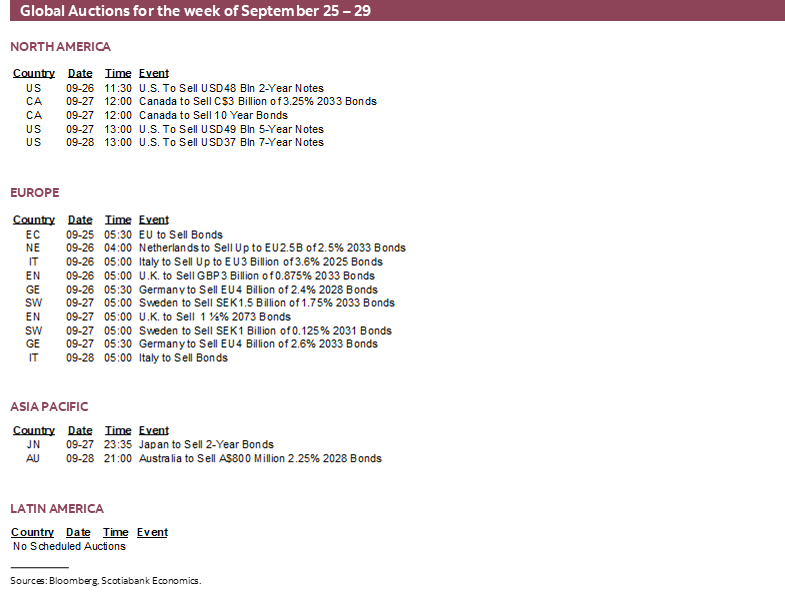
Other off-calendar risks that will be monitored by markets will be further developments in the US autoworkers strike and toward a US government shutdown that could arrive into next weekend and the following week. After House Speaker McCarthy signed a deal making his job dependent upon the whims of a narrow extreme minority, they are now blocking passage of funding bills and with former President Trump egging them on. Aside from the modest transitory hit to the economy that may unfold, the effects could disrupt the availability of key economic releases including the next payrolls report on October 6th. An extended government shutdown would cloud the Fed’s ability to read underlying developments affecting its dual mandate at a rather inopportune moment as it considers further policy tightening.
CENTRAL BANKS—BUCKING LATAM NEIGHBOURS
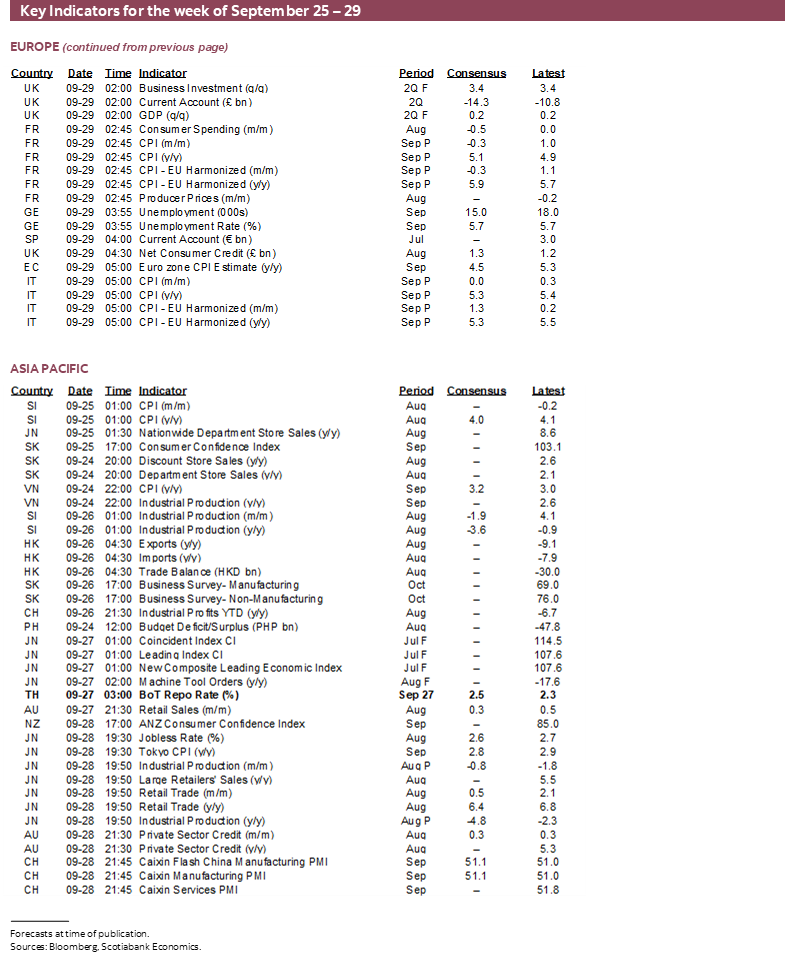
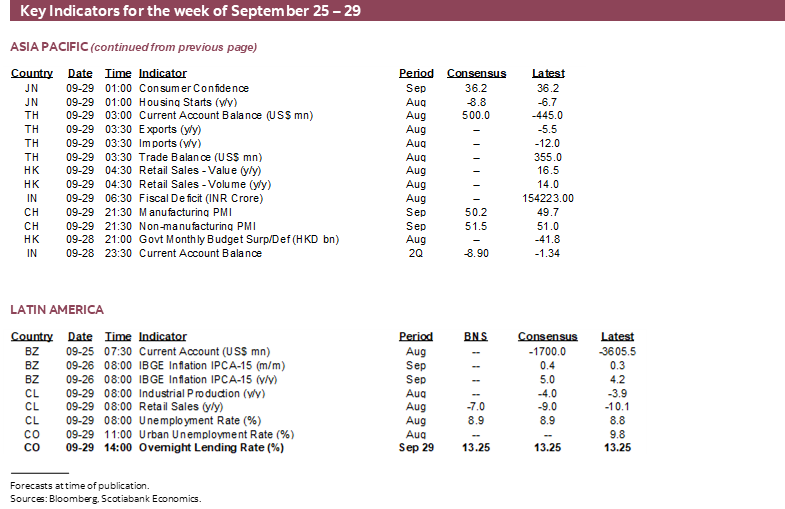
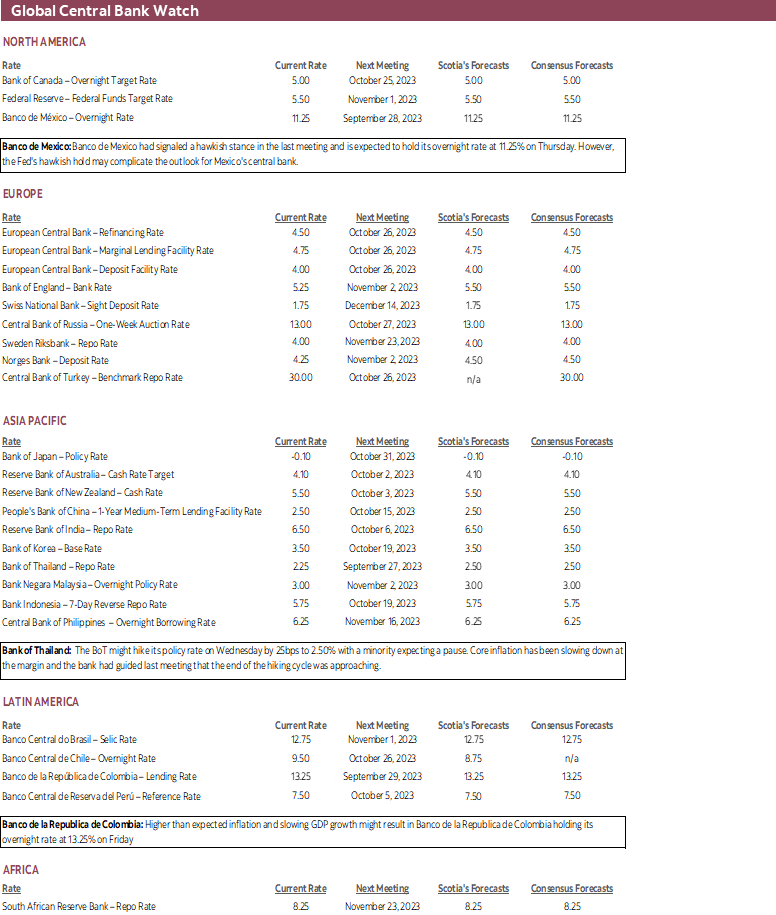
Major central banks that have the power to rock global central banks are out of the way for another cycle. Important decisions will still come from central banks in Mexico, Colombia and Thailand.
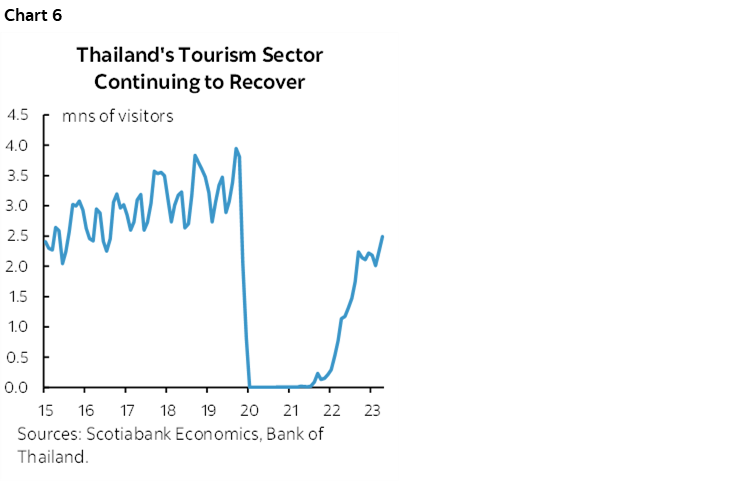
The Bank of Thailand may hike its policy rate by 25bps to 2.5% on Wednesday. That would extend the tightening cycle that began about a year ago and that has taken the policy rate up by about 175bps so far. What leans against further tightening in support of a solid minority expecting a pause is that core inflation has been ebbing from a peak of 3.2% y/y last December to 0.8% now and not just due to base effects; the pressures have ebbed at the margin in month-ago terms. Guidance that was offered at the last decision on August 2nd suggested that the end of the hiking cycle was approaching, and further decisions would be data dependent. Since then, however, a new administration has guided that there will be increased stimulus coming into the new year. The tourism sector has also continued to recover (chart 6).
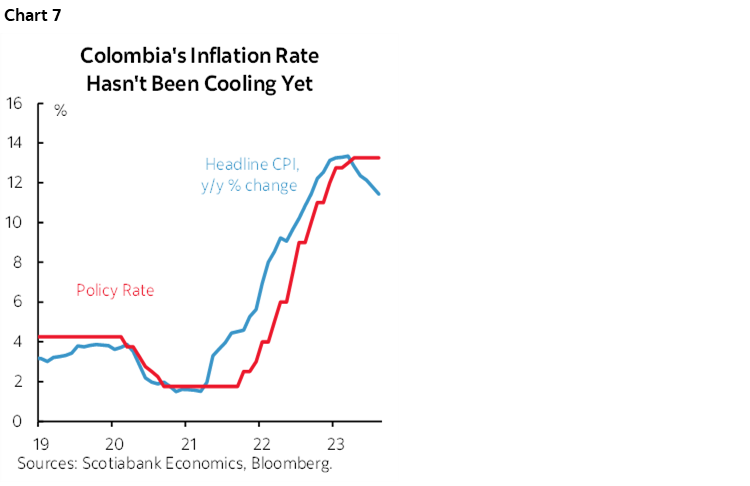
Colombia’s central bank is expected to hold its overnight rate unchanged at 13.25% on Friday. That would extend a pause dating back to April after a protracted hiking campaign that began in October 2021 when many other global central banks were still napping. Unlike some of its other LatAm neighbours, Colombian inflation hasn’t been cooling. Month-over-month seasonally unadjusted prices have continued to post some of the biggest gains for like months in history and this has contributed toward keeping the year-over-year rate elevated and over 11% (chart 7).
Banxico doesn’t have to always follow the Fed, but the recent hawkish hold by the FOMC complicates the outlook for Mexico’s central bank. It is expected to leave its overnight rate unchanged at 11.25% again on Thursday. GDP growth has been running at a solid pace for seven consecutive quarters averaging at about 1% q/q SA nonannualized and with only modest variations from quarter to quarter. The country is among the nearshoring beneficiaries. The peso had been materially appreciating through much of the past year until stalling out over recent months and may be vulnerable to further Fed tightening.
GLOBAL MACRO—FRIDAY’S FABULOUS FOUR
There will be four main economic indicators that will garner most of the week’s attention and all of them arrive on Friday. They speak to conditions in China, the US, Eurozone and Canada. While there will be quite a few other readings across multiple markets over the course of the week, these are the ones that I think deserve the most emphasis.
US Core PCE Inflation—CPI, Only Lighter
The Federal Reserve’s preferred inflation reading for the month of August will be released on Friday along with figures on consumer spending, incomes and the saving rate.
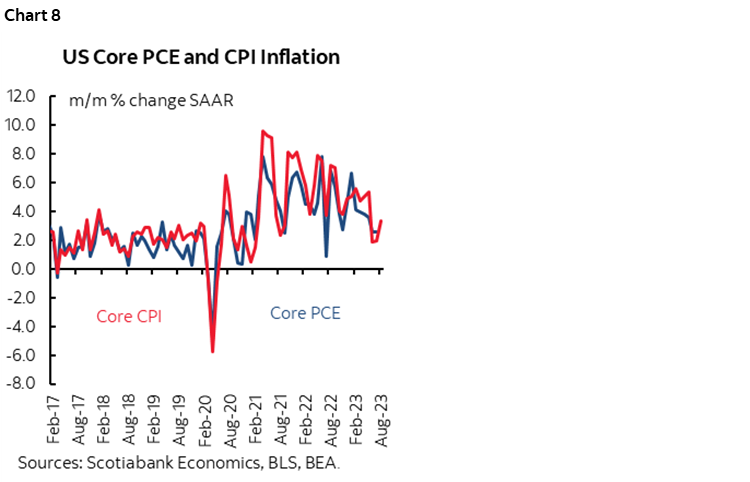
Core PCE inflation could come in a little lighter than the already known 0.3% m/m SA rise in core CPI inflation for the same month (recap here). PCE can tend to track beneath CPI for both headline and core gauges (chart 8). This is due to different methodologies including weights on the various components. For example, PCE has a much lower weight on shelter compared to CPI and shelter was among the drivers of the slightly firmer than expected core CPI reading. Furthermore, recall that core CPI was up 0.3% m/m SA with generous rounding up and so the bar for core PCE to be softer is set fairly low.
Consumption and incomes probably both posted mild gains in nominal terms but little to nothing in inflation-adjusted terms.
Eurozone Inflation—Buoyed by Energy, But Passing Time
In some sense, September’s CPI inflation report may only be about scorekeeping given the ECB’s recent set of mixed messages that has markets pricing no further hikes. The language in the latest statement did, however, leave the door open to the possibility of further data dependent tightening albeit the overall assessment read very much like it was written by a fractured committee.
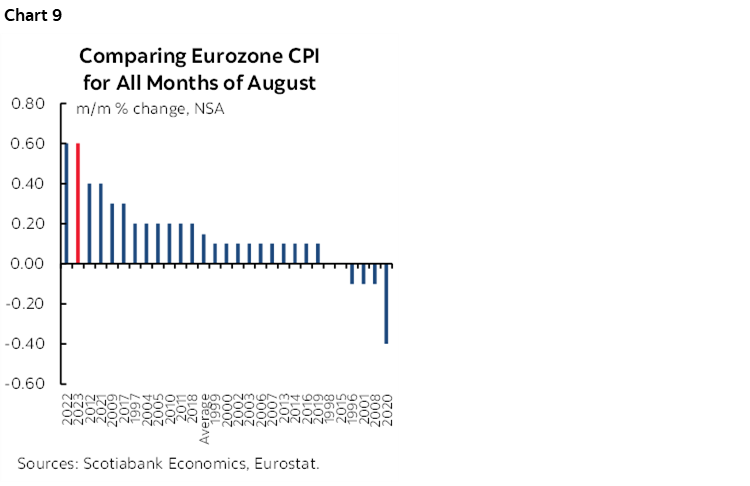
Headline Eurozone inflation could pop higher due to higher gasoline prices. Gas is tracking another 2% m/m NSA rise in September after 4% m/m NSA in August, both of which are seasonally unusual. A headline rise of around ½% m/m seems reasonable, but key will be core inflation given a year-to-date string of monthly readings that have been above seasonal norms such as in August (chart 9). Watch readings out of Germany and Spain on Thursday that may drive refreshed market estimates, before France and Italy release the next morning.
Nevertheless, CPI will be only one print along the path to the next ECB decision that is not due until October 26th including another inflation report due the week before the decision.
Canada’s Economy—Serial Shocks
GDP for July and preliminary guidance for August will be provided by Statistics Canada on Friday. Statcan had previously guided on September 1st that July GDP was tracking little change. Since then, several indicators suggest upside risk to this guidance.
A simple regression equation of value-added GDP against correlated measures of activity volumes indicates modest growth that I’ve tamped down to an estimated 0.2% m/m SA gain. Hours worked were mildly higher and so were other readings while proxies for service sector activity seemed buoyant.
One reason for tamping down the estimate is due to a back-of-the-envelope attempt at roughly estimating the impact of the BC port strike that would have temporarily weighed against growth.
We will be looking for guidance from the agency on the extent of this disruption. For example, July’s small dip in retail sales volumes was probably distorted by the strike given that Statcan indicated “approximately 17% of Canadian retailers reported that their business activities in July had been affected by the strike at the ports in British Columbia.” Also recall other caveats around the negative signal in retail sales volumes that include the fact it does not capture any services-related spending. Thus, in a relatively more normal summer that harkened back to pre-pandemic activities, none of what was spent on travel packages, airlines, hotels, vehicle rentals, tickets to attend movies, concerts and sporting events, eating out and entertainment at restaurants and bars, or financial services was captured in the numbers. For this, we need more complete and lagging services data.
While Q2 was heavily distorted by wildfires, as well as strikes and labour turmoil in the Federal civil service and other sectors, July probably extended those shocks given the port strike and record rainfall.
It’s impossible to ascribe recent economic weakness as solely or even primarily due to the impact of higher borrowing costs as the BoC has tended to do. Q4 of last year was mostly about a record inventory draw down, the shut Keystone pipeline, weather that impacted the peak holiday travel and shopping season and train derailments among other factors. Q1 rebounded, and then Q2 stumbled again on the aforementioned shocks. We won’t have a better feel for how much of a role higher rates may be playing until these shocks dissipate, and even then it may be difficult to arrive at such judgement since the country could be shaking off the shocks as a partial offset to lagging effects of rate hikes.
Is China’s Economy Bottoming Out?
China will update the state’s version of purchasing managers’ indices on Friday night, September 29th. An erratic release schedule sometimes sees the data coming out when more people are paying attention and sometimes on the weekends when fewer may be doing so.
It is feasible that slipping the estimates into the weekend with fewer watching could result in a better set of readings flying beneath the radar into the Monday market open. China’s efforts to apply policy stimulus may begin to bear more fruit. The composite PMI stopped falling in August’s reading following a string of declines dating back to March.
Whether or not September’s readings build upon momentum could be impactful to assessments of Q3 GDP growth and how domestic and world markets view downside risks to China’s economy.
CANADIAN MORTGAGE RESETS
A common narrative is that Canada has more indebted households than many other countries and hence greater vulnerability to higher borrowing costs than some other countries like the US because of shorter mortgage terms that reset more rapidly than in the US with its very long terms. The combination could derail the economy, limit potential for further rate hikes to control inflation and spark a policy reversal by the Bank of Canada.
There are some truths to the conventional narrative, but I’ve long viewed this less alarmingly than other colleagues on the street. The economy should be reasonably well positioned to withstand the effects notwithstanding the valid point that the high level macroeconomic consequences understate the challenges that will be faced by some households and some lenders more than others.
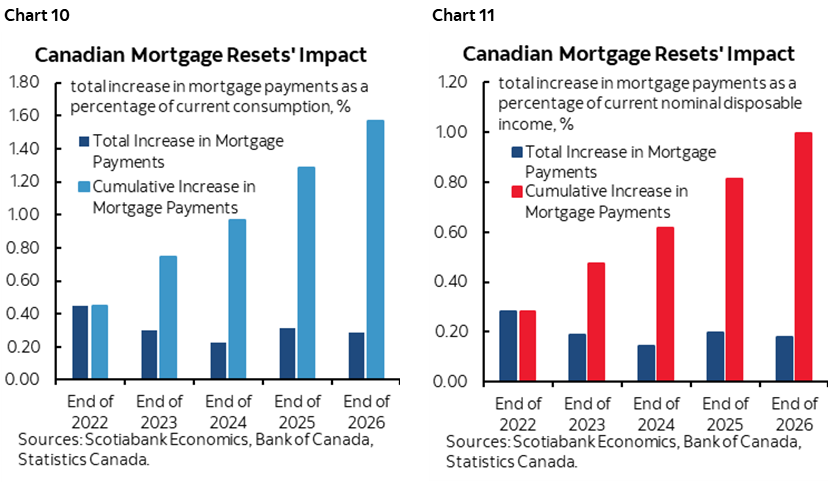
Chart 10 shows our rough estimates of the rolling cumulative amount by which total mortgage payments by all mortgage holders will go up by year through to 2026 expressed as a fraction of disposable income earned by all Canadians frozen at present incomes that I’ll revisit in a moment. Chart 11 shows the cumulative increase in mortgage payments as a share of current total consumer spending. By 2026, this approach shows that the cumulative shock to mortgage payments equals about 1% of current nominal disposable income and about 1½% of current consumption.
The shares of income and consumption are likely to be smaller than shown. That’s partly because of the assumption that incomes and consumption have been frozen at present levels. Aggregate nominal income is very likely to rise due to inflation, wage adjustments, population and employment gains over time even if a soft patch lies ahead, and possible net transfers from governments.
As Canadian borrowers extend amortization through rising proposals as bankruptcies remain toward record lows, the effects will offset at least some of this payments shock.
A key risk is the outlook for the job market that has thus far outpaced expectations, but there are other risk mitigants that are often unique to the Canadian mortgage system to also consider. One-third of outstanding residential mortgage credit is insured which has pros and cons but is a safety backstop. Banks are well capitalized. Mortgages are not generally put in off-balance sheet conduits that compound high leverage. The funding model is relatively more stable in Canada than other banking systems with less reliance upon core deposits. Lenders generally have full recourse as opposed to jingle mail mortgages. Lenders and borrowers exist in a system that is often more collaborative in nature. Even in the depths of past shocks like the harsh recession of the early 1990s, Canadians still paid their mortgages as the delinquency ratio remained very low.

DISCLAIMER
This report has been prepared by Scotiabank Economics as a resource for the clients of Scotiabank. Opinions, estimates and projections contained herein are our own as of the date hereof and are subject to change without notice. The information and opinions contained herein have been compiled or arrived at from sources believed reliable but no representation or warranty, express or implied, is made as to their accuracy or completeness. Neither Scotiabank nor any of its officers, directors, partners, employees or affiliates accepts any liability whatsoever for any direct or consequential loss arising from any use of this report or its contents.
These reports are provided to you for informational purposes only. This report is not, and is not constructed as, an offer to sell or solicitation of any offer to buy any financial instrument, nor shall this report be construed as an opinion as to whether you should enter into any swap or trading strategy involving a swap or any other transaction. The information contained in this report is not intended to be, and does not constitute, a recommendation of a swap or trading strategy involving a swap within the meaning of U.S. Commodity Futures Trading Commission Regulation 23.434 and Appendix A thereto. This material is not intended to be individually tailored to your needs or characteristics and should not be viewed as a “call to action” or suggestion that you enter into a swap or trading strategy involving a swap or any other transaction. Scotiabank may engage in transactions in a manner inconsistent with the views discussed this report and may have positions, or be in the process of acquiring or disposing of positions, referred to in this report.
Scotiabank, its affiliates and any of their respective officers, directors and employees may from time to time take positions in currencies, act as managers, co-managers or underwriters of a public offering or act as principals or agents, deal in, own or act as market makers or advisors, brokers or commercial and/or investment bankers in relation to securities or related derivatives. As a result of these actions, Scotiabank may receive remuneration. All Scotiabank products and services are subject to the terms of applicable agreements and local regulations. Officers, directors and employees of Scotiabank and its affiliates may serve as directors of corporations.
Any securities discussed in this report may not be suitable for all investors. Scotiabank recommends that investors independently evaluate any issuer and security discussed in this report, and consult with any advisors they deem necessary prior to making any investment.
This report and all information, opinions and conclusions contained in it are protected by copyright. This information may not be reproduced without the prior express written consent of Scotiabank.
™ Trademark of The Bank of Nova Scotia. Used under license, where applicable.
Scotiabank, together with “Global Banking and Markets”, is a marketing name for the global corporate and investment banking and capital markets businesses of The Bank of Nova Scotia and certain of its affiliates in the countries where they operate, including; Scotiabank Europe plc; Scotiabank (Ireland) Designated Activity Company; Scotiabank Inverlat S.A., Institución de Banca Múltiple, Grupo Financiero Scotiabank Inverlat, Scotia Inverlat Casa de Bolsa, S.A. de C.V., Grupo Financiero Scotiabank Inverlat, Scotia Inverlat Derivados S.A. de C.V. – all members of the Scotiabank group and authorized users of the Scotiabank mark. The Bank of Nova Scotia is incorporated in Canada with limited liability and is authorised and regulated by the Office of the Superintendent of Financial Institutions Canada. The Bank of Nova Scotia is authorized by the UK Prudential Regulation Authority and is subject to regulation by the UK Financial Conduct Authority and limited regulation by the UK Prudential Regulation Authority. Details about the extent of The Bank of Nova Scotia's regulation by the UK Prudential Regulation Authority are available from us on request. Scotiabank Europe plc is authorized by the UK Prudential Regulation Authority and regulated by the UK Financial Conduct Authority and the UK Prudential Regulation Authority.
Scotiabank Inverlat, S.A., Scotia Inverlat Casa de Bolsa, S.A. de C.V, Grupo Financiero Scotiabank Inverlat, and Scotia Inverlat Derivados, S.A. de C.V., are each authorized and regulated by the Mexican financial authorities.
Not all products and services are offered in all jurisdictions. Services described are available in jurisdictions where permitted by law.