Next Week's Risk Dashboard
- US core inflation could be another hot one
- Analysts are bearish toward Q3 earnings
- FOMC minutes to continue downplaying pivot talk
- UK jobs rolling?
- Will Chile’s central bank call it quits after one more hike?
- Bank of Korea expected to keep tightening
- Banxico minutes likely to reinforce a follow-the-Fed bias
- US retail sales likely to be another soft one
- Indian CPI to get a food lift but not from a usual source
- China’s core inflation still <1%
- Scandinavian underlying inflation likely to be hot
- Brazilian inflation is probably still tumbling
- Other global macro
Chart of the Week
This week may prove to be a tad inconvenient to the best laid plans set by so-called progressives. One of their pet theories is that greedy corporations are driving inflation and pocketing the proceeds. Most serious observers would say that’s rubbish and point to the varied and complex combination of demand-driven and supply chain effects upon inflation. This week could further weaken the merits of the progressives’ take on things if Wednesday’s US core inflation print lands as expected while the earnings season gets off to what analysts fear will be a soft one.
US CPI INFLATION—SOFT HEADLINE, STRONG CORE AGAIN?
The obsession of our times will get its next fix on Thursday when US CPI for September arrives. It’s expected to be another hot one on a core basis even while headline inflation likely stalls.
I went with a bottom-of-consensus 0.1% m/m for headline CPI and it wouldn’t take much at all to get a negative. That could knock the year-over-year reading to below 8% (7.9%) for the first time since February.
For core CPI, I’ve estimated a rise of about ½% m/m in seasonally adjusted terms which could lift the year-over-year rate higher to 6.6% (6.3% prior) for the hottest reading since August 1982.
The drivers are as follows:
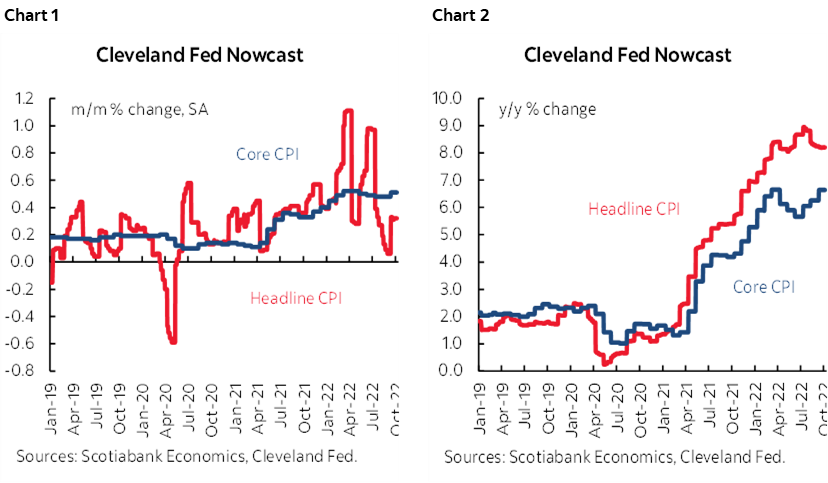
- The Cleveland Federal Reserve’s ‘nowcast’ tracks inflation on a daily basis throughout each month. It has performed fairly well over time, but not infallibly so. Charts 1 and 2 show that it is tracking a ½% m/m rise in core but is higher than my estimate for headline inflation.
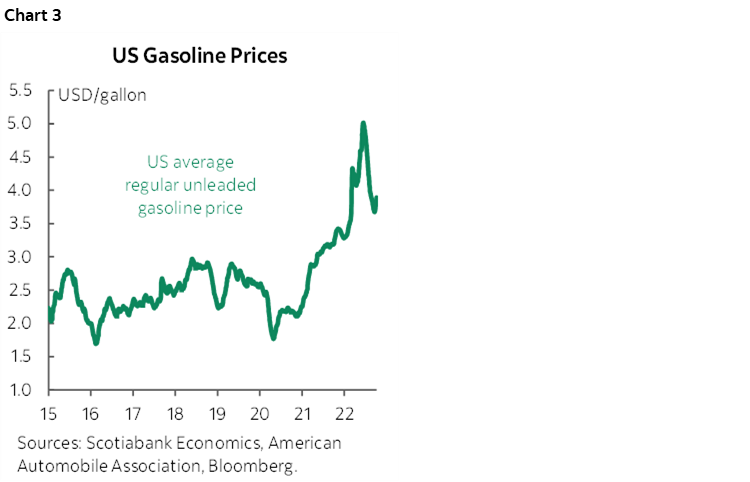
- Gasoline prices moved sharply lower again during September (chart 3). On a weighted-contribution basis this should knock about a half percentage point from the month-over-month CPI reading. While it’s early, gas prices are beginning to creep higher again in October partly on the back of the OPEC+ production cuts and perhaps extreme weather events.
- Natural gas prices fell again and may knock a small additional amount off of the piped utility component of CPI.
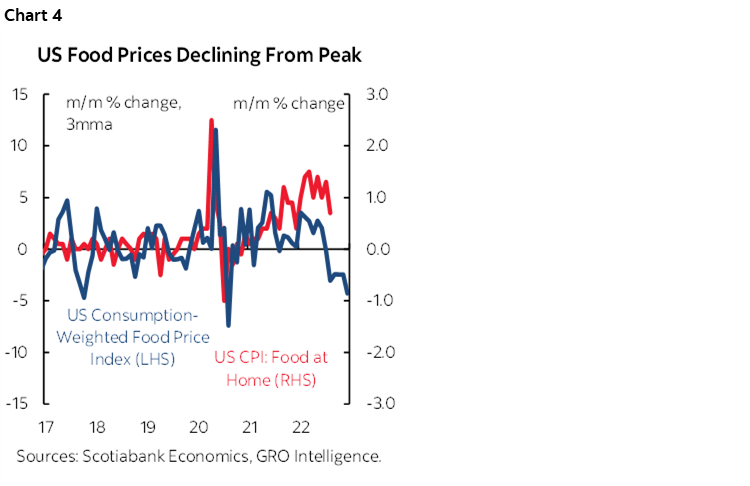
- Food prices may also begin to come under downward pressure at least temporarily until drought conditions in Europe and the US begin to weigh upon several categories. Chart 4 shows that a market-based measure of food prices aligned toward using US consumption weights has sharply fallen of late. Translating market prices into retail food-at-home CPI is fraught with difficulties, however, and this is indicated by the fact that the food-at-home CPI category’s sharp rise over the pandemic has not been well correlated with the direction of monthly changes in the market-based measure.
- JD Power figures for new and used vehicle prices adjusted for seasonality also pushed somewhat lower and are estimated to be a mild drag on headline and core CPI.
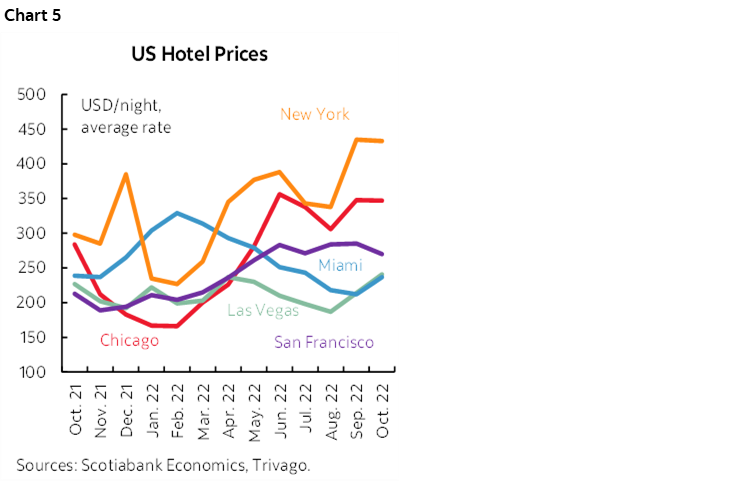
- Our tracking of service prices continues to point toward another significant gain in support of what has been the trend of accelerating service prices versus goods. The Trivago hotel price index (chart 5) shows higher prices in New York, Chicago and Vegas, flat prices in San Francisco and slightly lower prices in Miami.
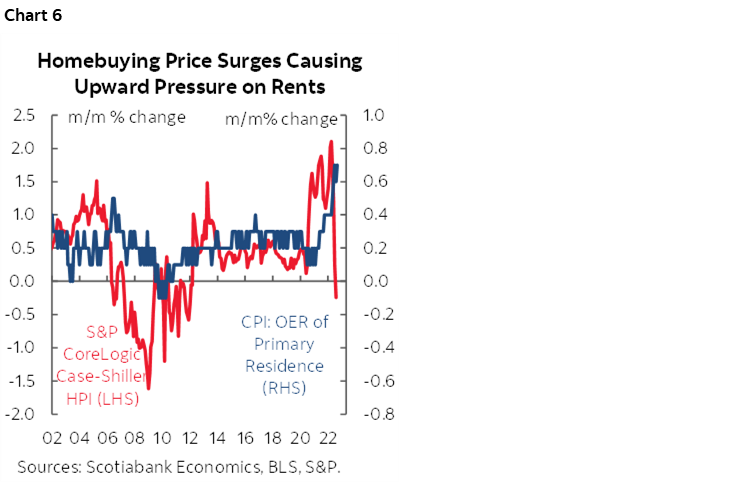
- The recent softening of repeat sale home prices may begin to show up in weakening owners’ equivalent rent but probably not just yet (chart 6).
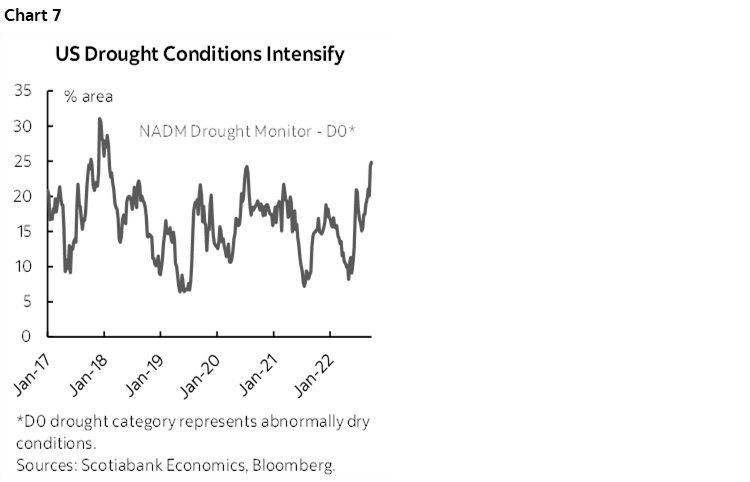
Having said all of that, while US monetary policy remains overly obsessed with the latest backward-looking readings, policy remains concerned about the perceived composition of inflation risk. The tightness of the US labour market is likely to be dented into 2023 but perhaps not quickly and materially enough to bring wage-price cycle dynamics to a cooler point as soon as the FOMC would like. Global food and energy prices may come under additional upward pressure through winter months and represent renewed passthrough effects into the core CPI and core PCE baskets. Drought conditions in the US are presently tracking toward their most elevated readings since they spiked into the winter of 2017–18 (chart 7).
US EARNINGS EXPECTED TO BE WEAKEST IN TWO YEARS
A fresh US earnings season begins this week and may inform next steps for stocks.
Fifteen S&P500 firms release in a modest start to the season. As usual, the early focus is upon financials toward the end of the week. BlackRock kicks it off on Thursday, followed by an onslaught of reports from JP Morgan, Morgan Stanley, Citigroup, Wells Fargo, PNC Financial and US Bancorp on Friday.
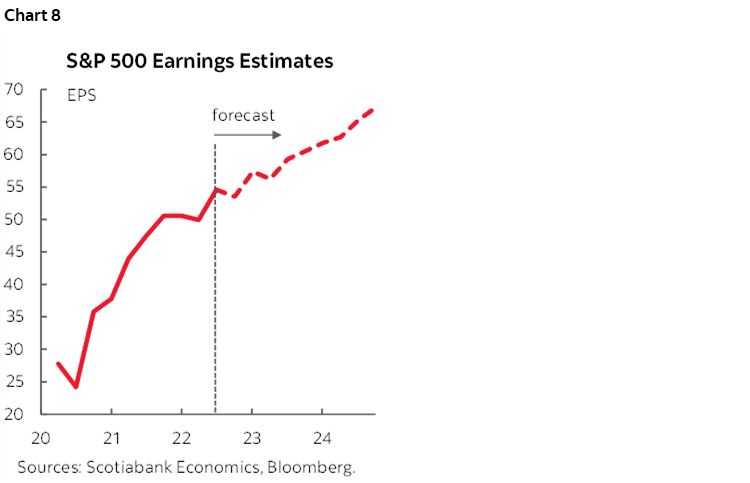
Analysts are expecting same-quarter seasonally unadjusted earnings to be up by only about 3% y/y from about 10% in Q2 as the softening economy and higher borrowing costs bite (chart 8). FactSet (full preview here) expects the softest earnings growth by this measure since the early days of recovery in 2020Q3.
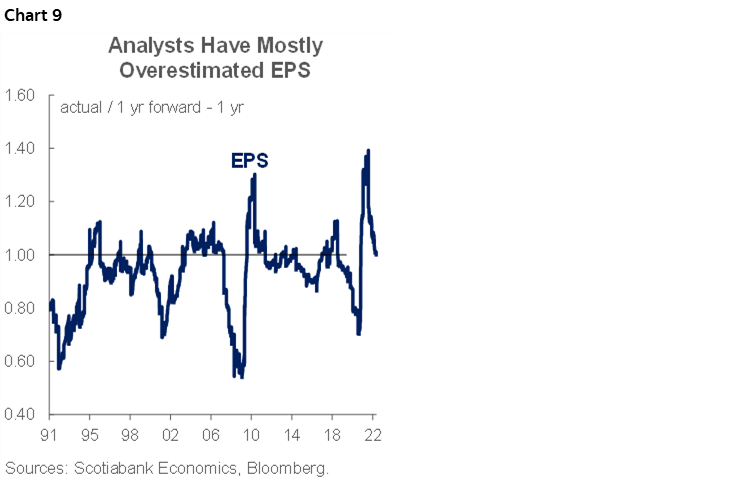
Having said that, recall that since SOX legislation, analysts have generally lowballed actual earnings growth into the start of most seasons while still nevertheless tending to overestimate one-year forward earnings per share (chart 9). The start of the season’s focus upon financials may not inform whether that’s true this time around as opposed to monitoring the season’s progress over the coming weeks.
MORE LOST JOBS IN THE UK?
UK labour market figures will be updated on Tuesday and at risk is further evidence of softening that may influence market pricing for Bank of England moves including into the November meeting. That decision nevertheless likely rests much more upon the accelerated concern toward the outlook for core inflation in the wake of the Truss administration’s extremely expansionary fiscal policy moves. A hike of at least 100bps is likely to be delivered.
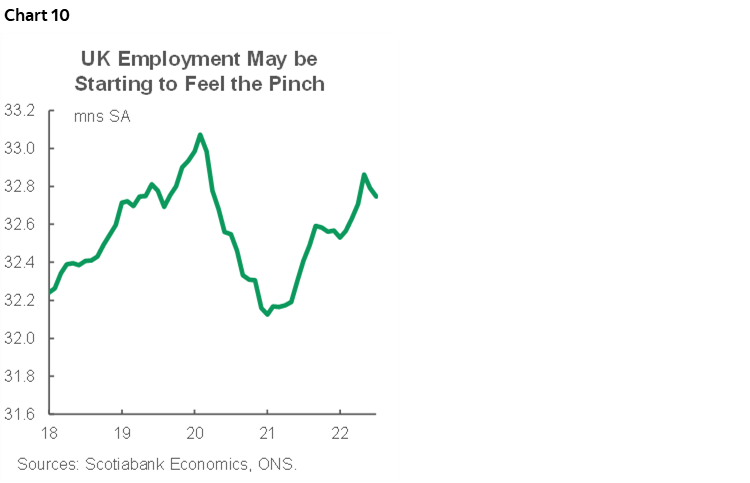
Total UK employment has slipped for two months now and shed 117,000 positions (chart 10). The UK has yet to fully recover to pre-pandemic levels of employment. The number of payroll employees in August surprised to the upside, +71k vs. +60k consensus, but off-payroll and hence principally smaller businesses have not fared as well. Labour supply challenges helped to drive the unemployment rate further into record low territory of 3.6%. Job vacancies, another indicator of labour market tightness, have come off their peak but remain elevated at 1.27 million, roughly 50% higher than 2019 levels. Labour demand continues to outpace supply and competing factors will dictate how fast people re-enter the workforce.
On the one hand, high inflation may keep folks trickling back into work but on the other, the UK government’s lofty fiscal support package might have the opposite effect while also fuelling prices further. Lastly, wage pressures continue to mount, surprising to the upside in four of the last five months, with further acceleration expected. Wage growth currently sits at 5.2% y/y for the 3-months ending July, the highest level since August 2021.
CENTRAL BANKS—IF THE FED’S NOT PIVOTING, THEN THE REST WON’T!
This week is unlikely to bring forward significant developments across major central banks but there could be a few noteworthy developments.
Wednesday’s minutes to the FOMC meeting on September 20th – 21st (recap here) are likely to reinforce messaging from the deluge of Fed speakers who have been leaning against a) pivot talk, and b) rate cut possibilities next year. A pivot seems insensible to expect for some time yet. The leaning against market tendencies to flirt with rate cuts next year could reflect the committee’s unease toward inflation risk and/or concern that it doesn’t wish to encourage easier financial market conditions before it thinks the job is done in combatting inflation.
Banxico minutes to the September 29th meeting land on Thursday. The central bank hiked by 75bps at that meeting for a third consecutive time and met expectations that it would follow the Federal Reserve’s identically sized hike. While there has been some debate around this across Banxico officials, the tone of the minutes is likely to leave behind the continued impression that further policy moves will emulate the Fed’s hikes.
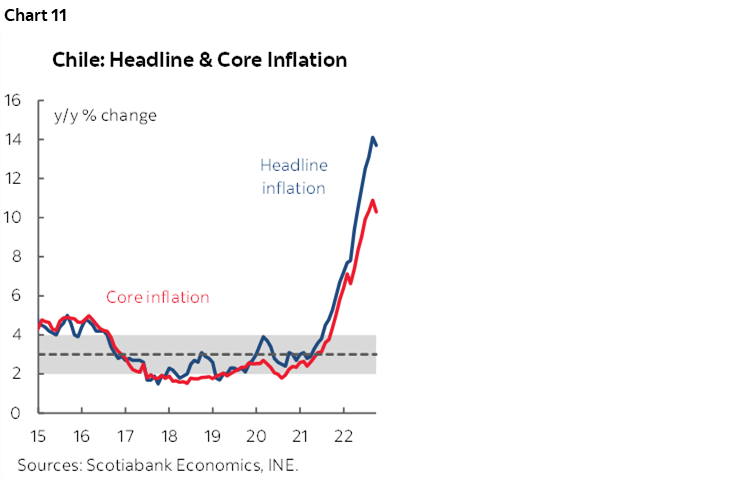
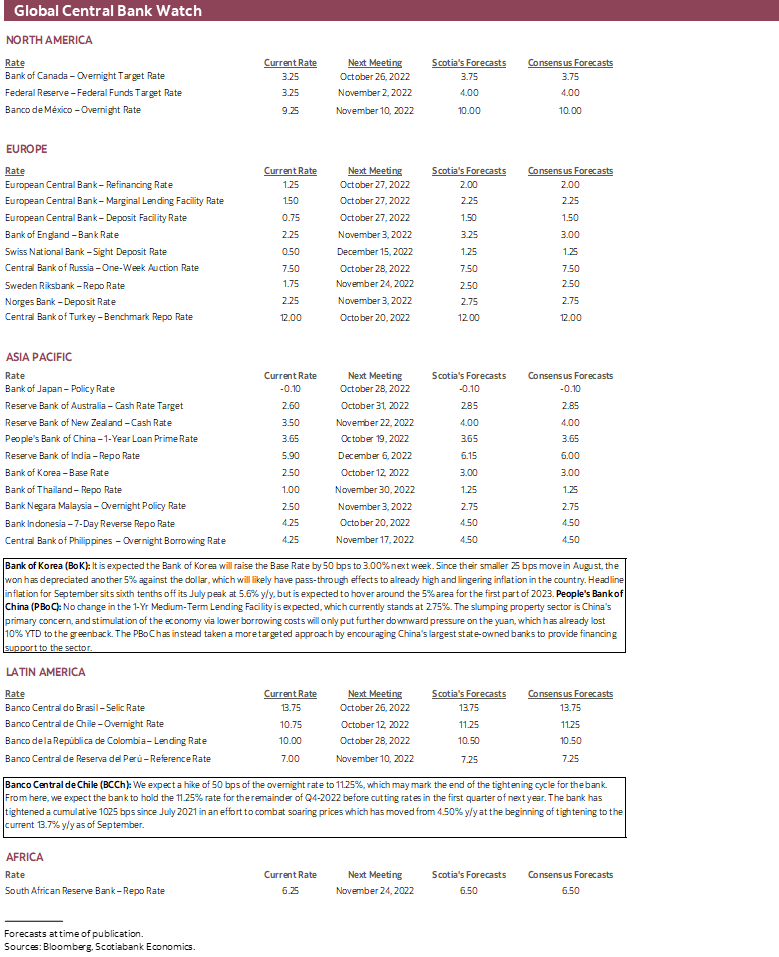
Chile’s central bank is widely expected to hike its overnight rate by another 50bps to 11.25% on Wednesday. Banco Central de Chile is expected to either signal the end of the hiking cycle or turn toward a decision-by-decision data dependent stance. A caution against this thinking is that the peso has weakened by another roughly 5% to the USD since the last decision on September 6th and the FOMC’s hawkish September meeting. That could well ignite another up-leg in inflationary pressures (chart 11).
The Bank of Korea is expected to hike another 50bps to a Base Rate of 3% toward the end of the week. As elsewhere, currency weakening on the back of the Federal Reserve’s expedited hiking campaign has driven the won 5% weaker to the USD since the last BoK policy decision in early August.
OTHER GLOBAL MACRO
The rest of the US calendar’s line-up will pale by comparison to CPI, FOMC minutes and earnings. Friday’s releases stand the best chance at mattering if at all as retail sales are expected to be on the soft side again. I’ve estimated a +0.1% m/m rise and -0.2% ex-autos. US consumers probably continued to rotate away from goods spending that is reflected in retail sales toward services that largely fall outside of retail sales. The University of Michigan’s consumer sentiment reading for October (Friday) might gain on lower gasoline prices given its emphasis upon cash flow measures. Weekly claims (Thursday) and producer prices for September (Wednesday) round out the line-up; core producer prices are expected to rise by 0.3% m/m and almost 7 ½% y/y
CPI readings will also be updated by several other countries. China (Thursday night ET) is expected to climb closer toward the CCP’s 3% target but only due to commodity and yuan influences as core inflation ex-food and energy continues to trend lower to sub-1% readings.
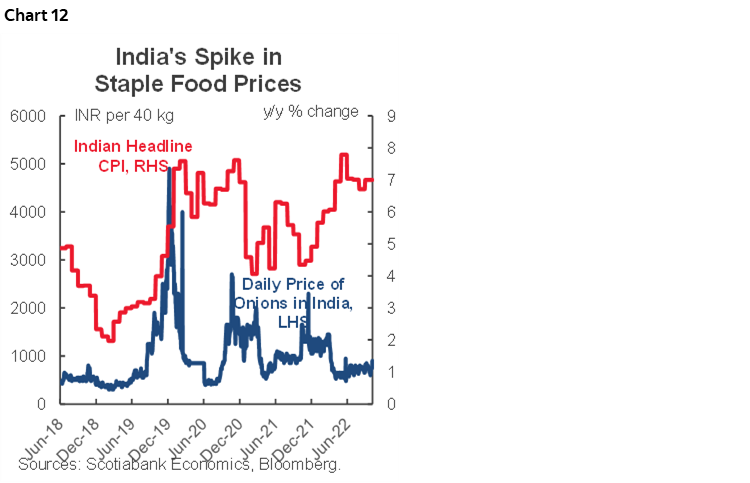
India’s CPI inflation rate (Wednesday) is expected to climb higher again with estimates ranging between 7.2–7.5% y/y. The culprit is likely to be higher food prices but this time not so much through onion prices—a staple in the Indian diet—that typically spike and lift CPI by around this time of the year into monsoon season (chart 12).
Hot inflation readings are likely to arrive in Scandinavia. Norway’s September update (Monday) is expected to register a rebound in underlying CPI to about +¾% m/m after the prior month’s decline. Sweden’s underlying CPI is forecast to rise by a similar amount (Thursday).
Brazilian inflation (Tuesday) might witness continued relief with September’s prices expected to fall and bring the year-over-year reading down toward from a peak of 12.1% in April toward 7% this week. That could reinforce the central bank’s decision to hold its Selic rate in September and therefore halt its hike cycle.
Other release highlights will focus upon China’s export figures toward the end of the week, Eurozone industrial output and trade figures on Wednesday, and a series of UK economic indicators on Wednesday covering industrial output, the services sector, trade, and August GDP.
Canada will start the week off with markets shut for Thanksgiving on Monday. That will leave much of the rest of the week to recover from bloated bellies as the week’s line-up will be very light. Manufacturing shipments are likely to decline when August’s figures are reported on Friday; Statcan has already guided that they fell by 1.8% m/m in its flash reading on September 23rd, but other details may inform future momentum such as new orders. The same day also brings out wholesale trade figures that are expected to rebound in keeping with flash guidance on September 26th that tentatively registered a 0.8% rise.
DISCLAIMER
This report has been prepared by Scotiabank Economics as a resource for the clients of Scotiabank. Opinions, estimates and projections contained herein are our own as of the date hereof and are subject to change without notice. The information and opinions contained herein have been compiled or arrived at from sources believed reliable but no representation or warranty, express or implied, is made as to their accuracy or completeness. Neither Scotiabank nor any of its officers, directors, partners, employees or affiliates accepts any liability whatsoever for any direct or consequential loss arising from any use of this report or its contents.
These reports are provided to you for informational purposes only. This report is not, and is not constructed as, an offer to sell or solicitation of any offer to buy any financial instrument, nor shall this report be construed as an opinion as to whether you should enter into any swap or trading strategy involving a swap or any other transaction. The information contained in this report is not intended to be, and does not constitute, a recommendation of a swap or trading strategy involving a swap within the meaning of U.S. Commodity Futures Trading Commission Regulation 23.434 and Appendix A thereto. This material is not intended to be individually tailored to your needs or characteristics and should not be viewed as a “call to action” or suggestion that you enter into a swap or trading strategy involving a swap or any other transaction. Scotiabank may engage in transactions in a manner inconsistent with the views discussed this report and may have positions, or be in the process of acquiring or disposing of positions, referred to in this report.
Scotiabank, its affiliates and any of their respective officers, directors and employees may from time to time take positions in currencies, act as managers, co-managers or underwriters of a public offering or act as principals or agents, deal in, own or act as market makers or advisors, brokers or commercial and/or investment bankers in relation to securities or related derivatives. As a result of these actions, Scotiabank may receive remuneration. All Scotiabank products and services are subject to the terms of applicable agreements and local regulations. Officers, directors and employees of Scotiabank and its affiliates may serve as directors of corporations.
Any securities discussed in this report may not be suitable for all investors. Scotiabank recommends that investors independently evaluate any issuer and security discussed in this report, and consult with any advisors they deem necessary prior to making any investment.
This report and all information, opinions and conclusions contained in it are protected by copyright. This information may not be reproduced without the prior express written consent of Scotiabank.
™ Trademark of The Bank of Nova Scotia. Used under license, where applicable.
Scotiabank, together with “Global Banking and Markets”, is a marketing name for the global corporate and investment banking and capital markets businesses of The Bank of Nova Scotia and certain of its affiliates in the countries where they operate, including; Scotiabank Europe plc; Scotiabank (Ireland) Designated Activity Company; Scotiabank Inverlat S.A., Institución de Banca Múltiple, Grupo Financiero Scotiabank Inverlat, Scotia Inverlat Casa de Bolsa, S.A. de C.V., Grupo Financiero Scotiabank Inverlat, Scotia Inverlat Derivados S.A. de C.V. – all members of the Scotiabank group and authorized users of the Scotiabank mark. The Bank of Nova Scotia is incorporated in Canada with limited liability and is authorised and regulated by the Office of the Superintendent of Financial Institutions Canada. The Bank of Nova Scotia is authorized by the UK Prudential Regulation Authority and is subject to regulation by the UK Financial Conduct Authority and limited regulation by the UK Prudential Regulation Authority. Details about the extent of The Bank of Nova Scotia's regulation by the UK Prudential Regulation Authority are available from us on request. Scotiabank Europe plc is authorized by the UK Prudential Regulation Authority and regulated by the UK Financial Conduct Authority and the UK Prudential Regulation Authority.
Scotiabank Inverlat, S.A., Scotia Inverlat Casa de Bolsa, S.A. de C.V, Grupo Financiero Scotiabank Inverlat, and Scotia Inverlat Derivados, S.A. de C.V., are each authorized and regulated by the Mexican financial authorities.
Not all products and services are offered in all jurisdictions. Services described are available in jurisdictions where permitted by law.