Next Week's Risk Dashboard
- The bond sell-off may be revealing its own limits
- US CPI to test the soft patch
- US Q3 earnings season kicks off
- FOMC minutes to reinforce hawkish bias, but stale
- China/SK return from Golden Week
- China CPI’s bumpy path away from alleged deflation
- UK data dump to inform Q3 growth tracking
- A US House Speaker vote could inform shutdown risk
- Global macro readings
- US, Canadian markets shut on Monday
Chart of the Week
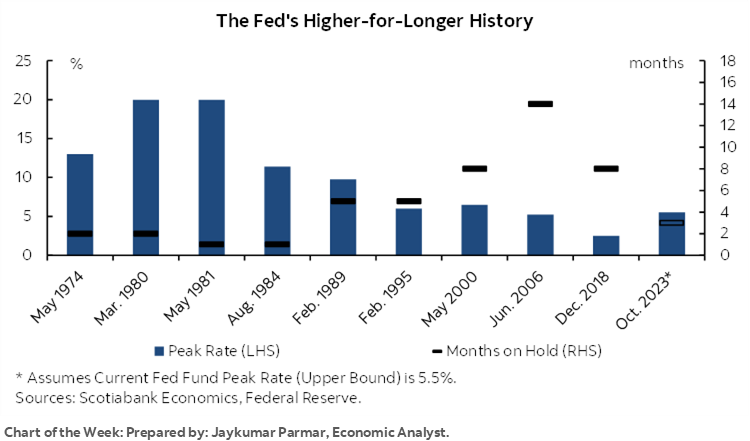
A sell off in US Treasuries that began in May has since attracted a pile-on of folks suddenly making it sound obvious that longer-dated yields must march even higher yet. If there is one thing about the bond market it is its ability to humble the folks who throw around billions of dollars trading it especially given its tendency to overshoot and undershoot equilibrium levels.
A case can nevertheless be made for how we have approached the outer limit of a selloff with the risk-reward relationship probably more skewed toward lower rather than higher yields going forward. The bond sell-off may be revealing its own limits.
I’ll walk through some of the drivers, but first, some of this week’s developments could further inform this view. Over the back half of the week, we’ll get US CPI, FOMC minutes, and the start of the Q3 US earnings season that commences with banks as per the norm. Also of note may be the return of market participants in China and South Korea from Golden Week both in financial markets and in terms of the evidence on holiday spending; the US 10-year note’s yield climbed 20bps while they were away. Wednesday’s planned vote on a new Speaker in the House of Representatives could further inform risk of a government shutdown when the current funding extension expires on November 17th.
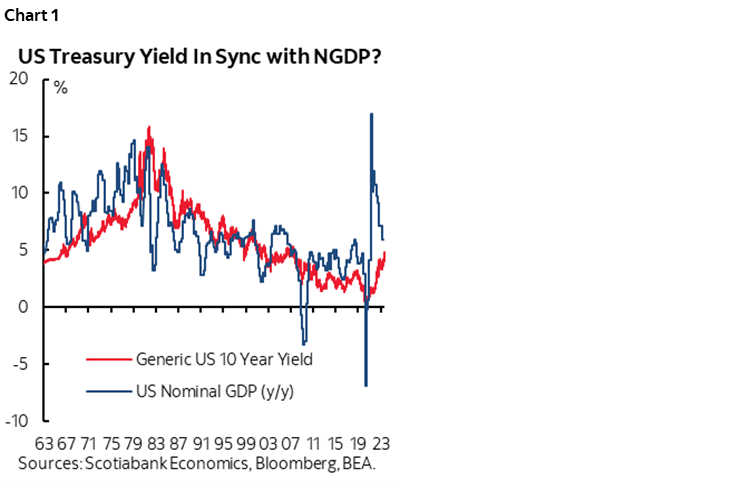
Beyond week-by-week developments are the more fundamental drivers. A starting point is that over time, the 10-year US Treasury yield should ride roughly in concert with nominal GDP (NGDP) growth especially in a forward-looking expectations sense. Chart 1 shows the history in contemporaneous terms. It’s a very rough guide at any one point in time, but I don’t find it to be obvious that the 10-year Treasury yield is underestimating current or expected NGDP growth, and it is more likely to be overestimating it. What markets are therefore partly struggling with now is the estimate for expected nominal GDP growth in future.
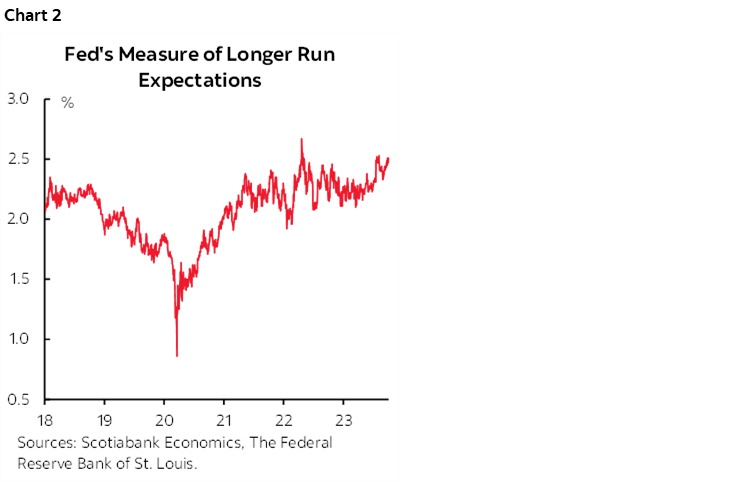
One component of this is what markets expected for inflation. Ideally this would be for the overall GDP price deflator, but over time we can use consumer prices. The market’s measure of longer-run inflation expectations has pivoted higher toward 2½% using the Fed’s preferred 5yr5yr forward breakeven rate (chart 2). That’s up about 20bps since early September and about 35–40bps from summertime lows. It’s hard to be strongly of the opinion that this could move higher as justification for higher longer-term nominal bond yields given enormous uncertainties that far out.
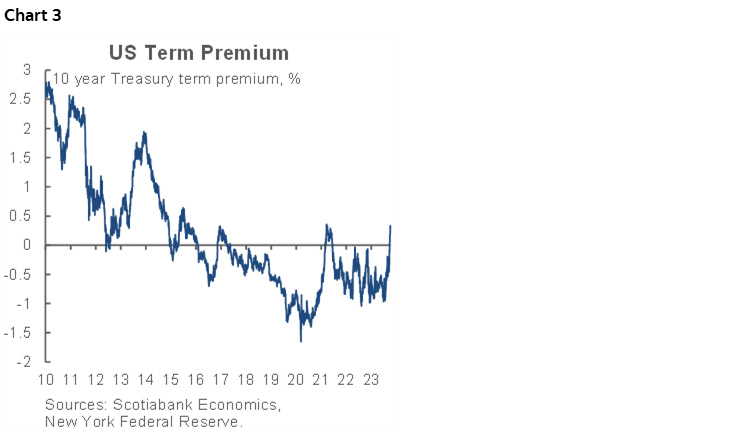
Another component is what the market is signalling in terms of expected future inflation-adjusted GDP growth. The market’s expected future economic growth has driven much of the rise in the 10-year term premium. This measure has climbed by about 130bps since summer and hence back to peaks last seen in 2021 in the early days of the pandemic recovery (chart 3). It could well have further to run in a longer-run sense, but the Fed’s ownership of the bond market during prior heights post-GFC through 2014 was much lower than today’s by trillions of dollars and so perhaps the term premium should remain well below prior heights. Furthermore, the higher the term premium goes, the more likely the FOMC is to begin leaning toward tapering quantitative tightening.
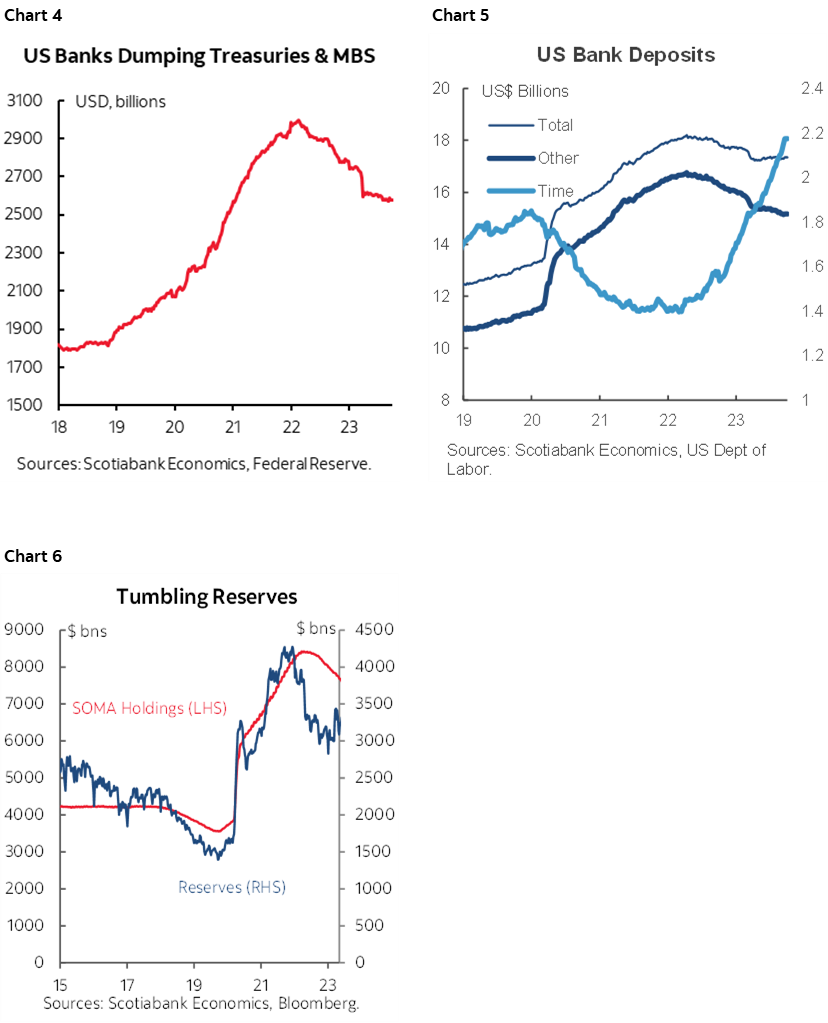
Why? Because it could be the case that the rise in the term premium is revealing a higher than previously thought level of ample reserves in the US banking system. Perhaps US banks are revealing a preference toward maintaining reserves over US$3T where they have been stuck for quite a while and in order to achieve this the banks are being forced to liquidate their Treasury holdings and hence drive yields higher. The forced selling of Treasuries and agency MBS (chart 4) amid funding constraints that have driven liquid deposits lower as clients extend duration (chart 5) may well be signalling that an ample reserves framework has to be pegged above US$3T and hence where it is now (chart 6).
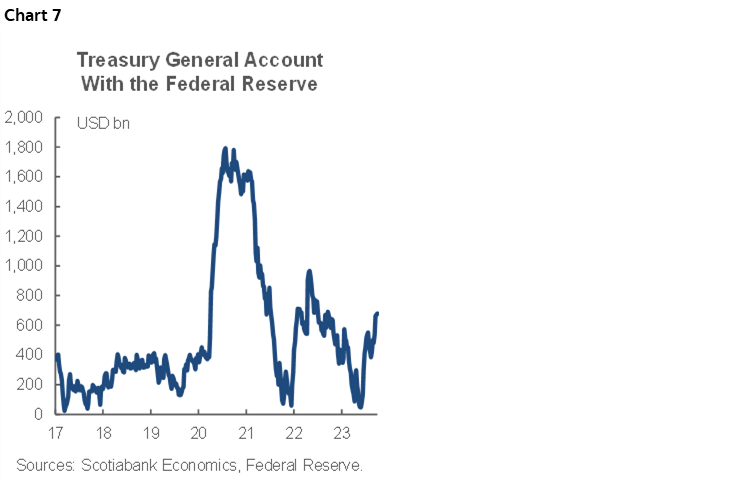
This forced selling is occurring alongside ramped up issuance pressures since the late-July Treasury refunding plans (and Fitch’s downgrade that same day) guided expectations for bigger and more frequent auctions. Much of the ramped-up issuance is designed to replenish the Treasury’s liquid cash holdings at the Federal Reserve after the debt ceiling fracas depleted them (chart 7). This is temporary issuance overshoot of the longer-run pressures from overly stimulative fiscal policy. The threat of another government shutdown in November may be adding further nearer term issuance pressures to raise cash levels higher yet. As this factor eventually matures, so should issuance and so should at least some of the supply pressure on markets.
Given this combination of reduced demand for Treasuries and agency MBS from banks that are signalling a preferred level of reserves plus raised issuance, the Fed should perhaps be open to contemplating a tapering of its targeted pace of roll off of maturing Treasuries and MBS from its balance sheet. Should it court a tapering dialogue earlier than previously expected then this would mean less supply coming back into the market off the Fed’s balance sheet and hence less upward pressure upon yields.
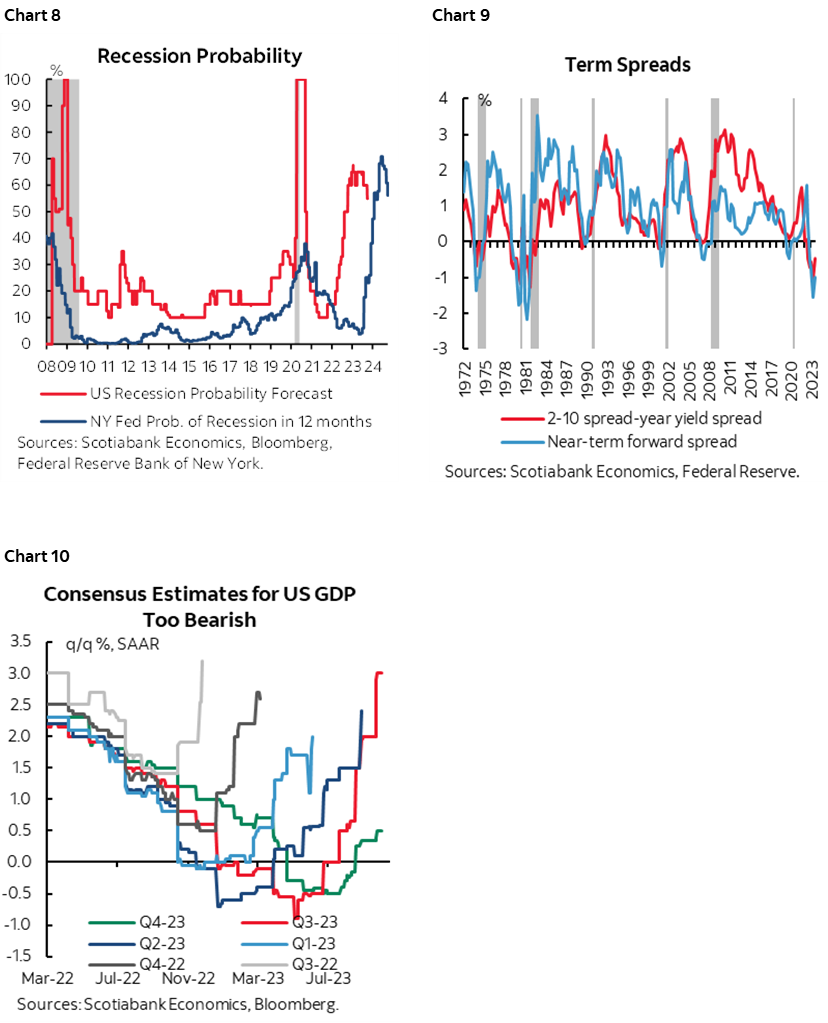
Treasury yields (and the term premium) have climbed in part as the market’s assessment of recession risk has declined somewhat while 2s10s and an arguably superior predictor of recession risk derived from short-term yields have remained inverted (charts 8, 9). A reduction in recession probabilities derived from markets is supported, for now, by the fact economists are extending the pattern of revising up expectations for quarterly GDP growth (chart 10) after having done so in each of the past five quarters. The latest blow-out jobs report may also lean this way, although wage growth has joined the inflation soft patch (recap here). Nevertheless, the bond market is attaching among the highest probabilities on record to experiencing a recession over the coming year and there are no Nobel prizes awarded to folks who figure out what Treasury yields tend to do in recessions. Our forecast is for GDP growth to stall out over ‘23Q4–’24Q3.
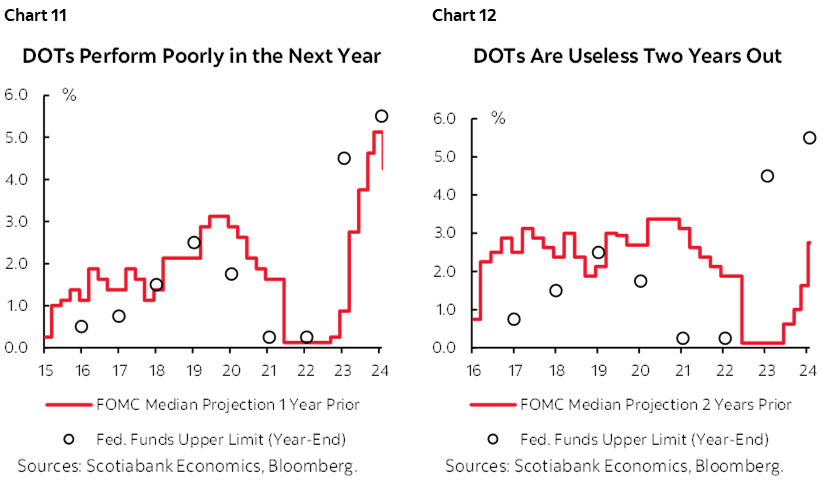
Treasury yields have also climbed on a leap of faith by assuming that the FOMC’s made-up ‘dots’ will ultimately prove to be an accurate assessment of where the policy rate is headed in future. As charts 11–12 show, I wouldn’t bank on that. The dots are a made up means of guessing at where the fed funds target rate will land. They also contained an impure motive designed to manipulate markets away from pressuring the Fed to ease before it has greater conviction to do so.
Indeed, there is a dance going on between the bond market and the FOMC’s 12–to–7 support for one more hike this year. As some FOMC officials signal that the rise in bond yields is a substitute for a 25bps fed funds hike, the implication may be that we won’t see another hike in which case higher-for-longer isn’t quite as high and Treasury yields could adjust lower. More on this in the section below on the FOMC minutes.
An added Fed consideration to the yield curve is the neutral policy rate. It’s probably higher than the FOMC estimates (2.5%) but unless we’re talking about something much higher than, say, 3% or 3.25%, then the 10-year Treasury is probably cheap.
What the Bank of Japan may do and how it impacts the attractiveness and carry into Treasuries has likely been an added catalyst to the selloff. Markets are pricing about 20bps of BoJ hikes through to next summer. At this point that is perhaps reasonable given uncertainties around whether any hikes may be delivered at all. My hunch leans against pushing it further. The case for raising the target rate from -0.1% to something positive is informed by serial weakening in the yen and trend strength in oil prices notwithstanding this past week’s setback, both of which pass through to CPI with lengthy lags, and how these and other factors drive the next round of Shunto Spring wage negotiations.
There are many, many other considerations to a bond yield forecast and its drivers, not least of which are the technical and flow factors I haven’t touched, such as duration swings across important ETFs and the composition of Treasury sales as well as the aggregate volume.
The overall takeaway to the bigger picture considerations described above can be summed up by saying that in my opinion, the drivers of the 10-year US Treasury yield suggest we may be at or very near a peak. The sensitivity of the one-way movement to one bad payrolls report or series of deteriorating indicators into next year could well drive a violent positioning swing in the other direction that the bond market is prone to doing.
U.S. CPI—TESTING THE SOFT PATCH
Another US CPI inflation reading arrives on Thursday, this time for the month of September. It’s the last CPI reading before the next FOMC decision on November 1st and therefore it could be impactful to markets that are pricing little to no chance at a hike at that meeting.
I have estimated 0.3% m/m SA increases in headline CPI and core CPI excluding food and energy prices. Year-over-year rates are expected to ebb somewhat to 3.6% from 3.7% for headline CPI, and to 4.1% from 4.3% for core.
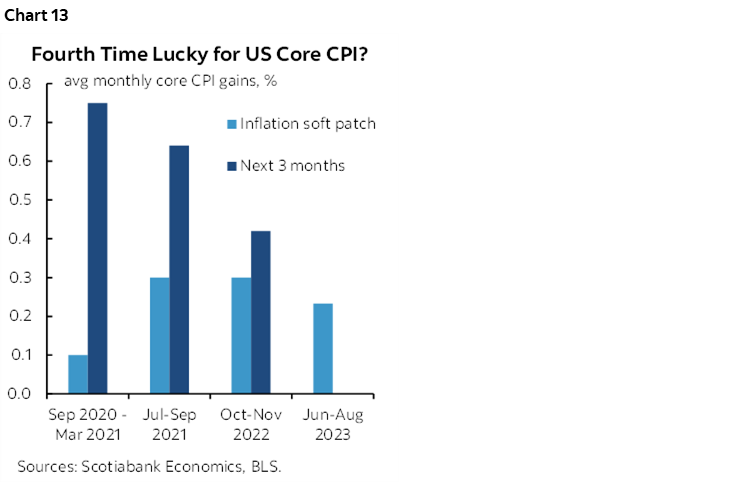
Following three months of relatively soft core CPI readings that have averaged 0.2% m/m, the market sensitivity lies in whether this has just been another temporary soft patch like three others thus far in the pandemic (chart 13), or something more durable. It’s uncertain how long it may take to test this matter. Those three prior soft patches have lasted anywhere between two (October–November 2022), three (July–September 2021) and seven (September 2020 to March 2021) months.
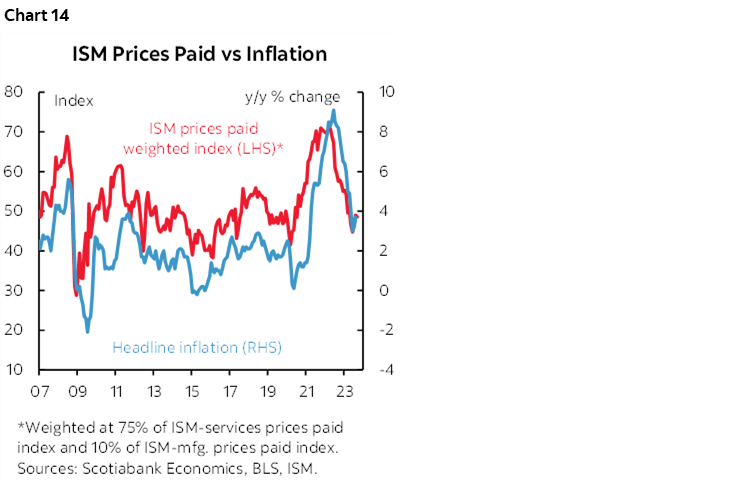
One reason for expecting a similar headline CPI reading as the prior month’s 3.7% y/y rise is derived from the price signals in ISM readings. A weighted average of the price subindices in ISM-services and ISM-manufacturing correlates reasonably well with changes in y/y CPI inflation (chart 14). The stability in the average of those readings in September relative to August implies a similar year-over-year rate of headline inflation.
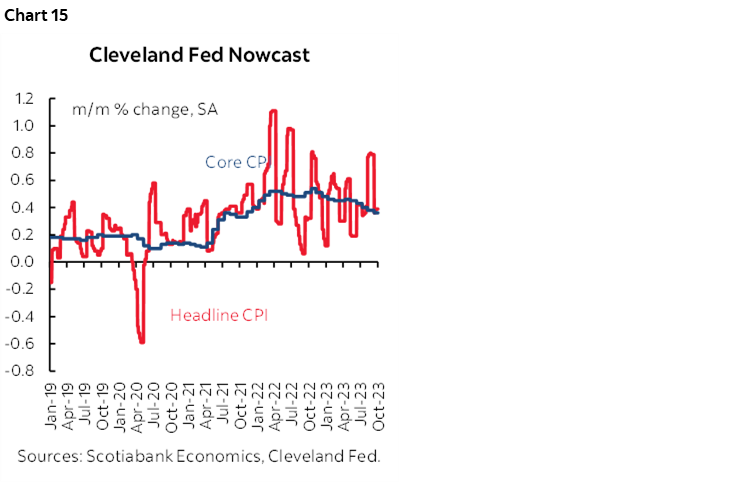
Inflation ‘nowcasts’ have not been terribly useful for some time now, but chart 15 depicts what they are showing according to the Cleveland Fed’s measures.
A bottom-up approach to estimating inflation is derived from several observations and assumptions on key categories.
A shift in year-ago base effects is likely to explain much of any softening in both headline and core measures. If nothing else changed other than base effects, then headline CPI would decelerate from about 3.67% y/y to 3.44% and core would go from 4.35% y/y to 4.06%. What matters, however, is evidence on inflationary pressures at the margin in month-over-month trend terms.
Owners’ equivalent rent carries about a one-quarter weighting in the CPI basket and is estimated to have risen by a further 0.4–0.5% m/m SA.
Rent carries about a 7.6% weight in the CPI basket and does not appear to have contributed materially to m/m inflation measures.
core services ex-energy and shelter carry a 24% weight and may be the biggest wildcard following August’s acceleration of 0.4% m/m SA.
Difficult to estimate are the lagging passthrough effects as they relate to three considerations. One is higher wages being passed on. Two is higher energy prices. Third could be a lift to seasonal price pressures as seasonal product lines change over at higher prices than the prior season that may not be adequately controlled through SA factors.
Gasoline prices were little changed in September over August but since it tends to be a seasonal down-month for prices we can estimate that gas prices were up by roughly 1% m/m SA. That could add less than a tenth to m/m headline inflation.
Vehicle prices were little changed in m/m seasonally unadjusted terms and in seasonally adjusted terms would only be expected to add at most 0.1% m/m SA to headline and core CPI inflation.
Food prices probably climbed modestly but not enough to add a material amount to CPI in m/m terms.
U.S. EARNINGS SEASON—NOT HARD TO BEAT
The US will enter the Q3 earnings season in full force as soon as the ink dries on US CPI.
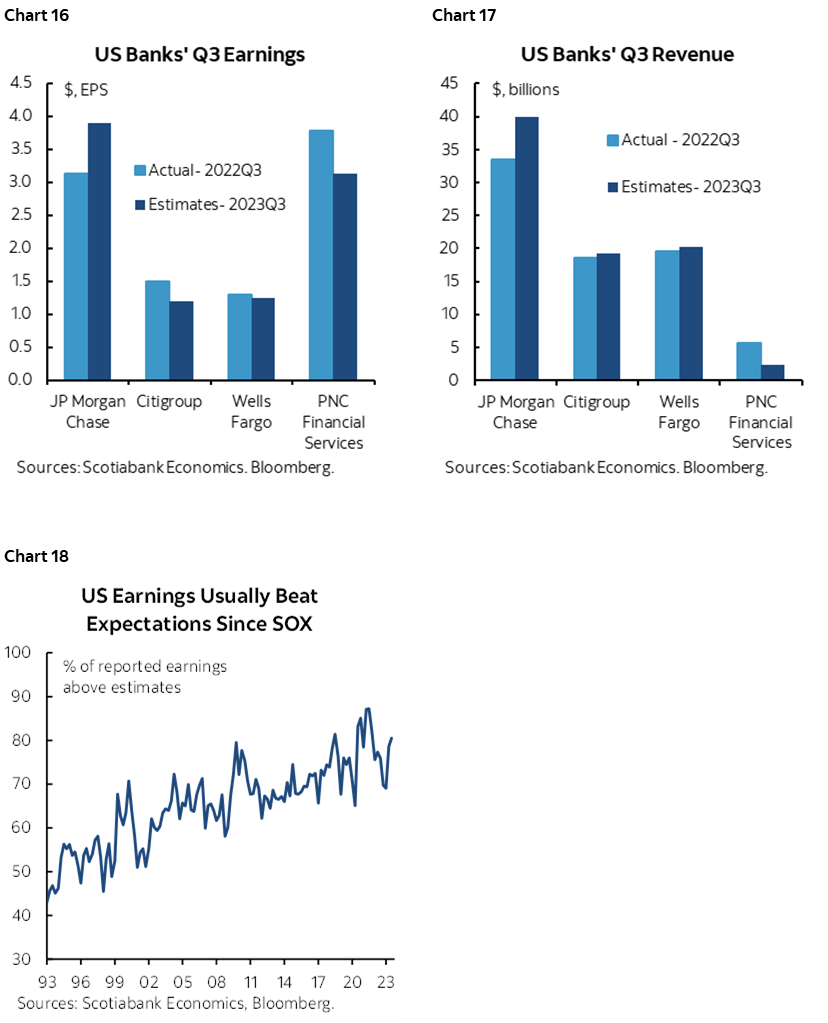
Friday will kick it off with the usual starting focus upon financials. JP Morgan Chase, Wells Fargo, Citigroup, BlackRock and PNC will release earnings reports and management guidance.
A generally soft overall earnings season is expected both for EPS and revenues (charts 16, 17) but always remember the effects of SOX legislation that hardwired pretty persistent beats to analysts’ expectations especially for earnings (chart 18).
CENTRAL BANKS—STALE FOMC MINUTES
We could almost get away with saying that there are no major central bank communications on tap this week, but the Federal Reserve is acting as somewhat of a spoiler.
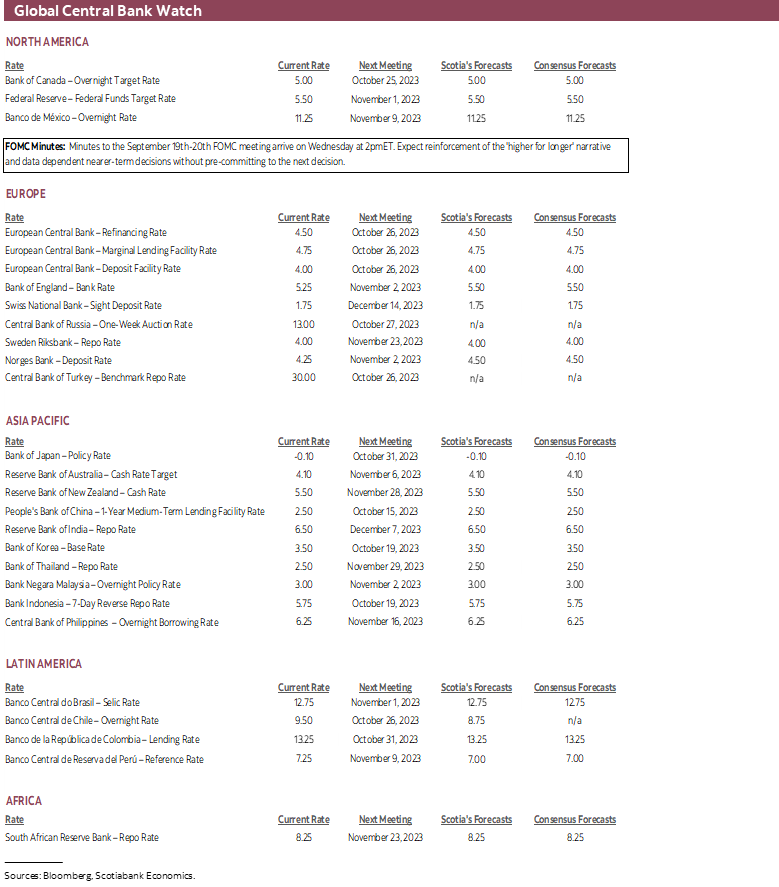
I say ‘somewhat’ because they are not slated to weigh in again until November 1st but on Wednesday at 2pmET they will release minutes to the prior two-day FOMC meeting on September 19th – 20th.
A recap of what transpired at the conclusion of that meeting is available here. Recall the main takeaways:
- Bonds sold off as higher rates were priced for a longer period and haven’t really stopped selling off since.
- there were very few statement changes.
- The language indicated that the Fed is “in a position to carefully assess the appropriate stance” and “we are in a position to proceed carefully, meeting by meeting,” and that “holding at this meeting does not mean we think we have reached the peak.”
- 12 out of 17 FOMC members indicated they lean toward one further 25bps rate hike this year, meaning at either the November 1st or December 13th decisions.
- next year’s projected rate cuts cut in half the amount to 50bps.
- Chair Powell emphasized stronger than expected GDP growth as a support to the higher-for-longer narrative. He also indicated that he wishes “to see that cooler inflation is about more than just three months. We want to see further rebalancing of the labour market.”
A similar sounding set of messages is likely to be delivered by the minutes without offering any greater pre-commitment to nearer-term data-dependent decisions.
Now the challenge here is whether the market reaction to all of that surprised the FOMC or not and hence whether the minutes will be stale on arrival. Recent comments from San Fran Fed President Daly suggest that the reaction was perhaps a surprise to them. She recently said that the bond selloff has a rate equivalence equal to about a 25bps fed funds increase. If others on the Committee agree and if this reaction is sustained, then the chicken-and-egg issue is that the FOMC may not think it needs to hike again in which case one of the reasons for the bond selloff gets struck out. Rally on, then come back again later…
The fundamental issue remains whether markets should even have believed the dots in the first place given their awful track record.
GLOBAL MACRO—CHINA’S VOLATILE PATH BACK FROM ALLEGED “DEFLATION”
The rest of the week’s highlights will mostly focus upon price and other signals from China’s economy, readings on the UK economy, and several other global inflation reports.
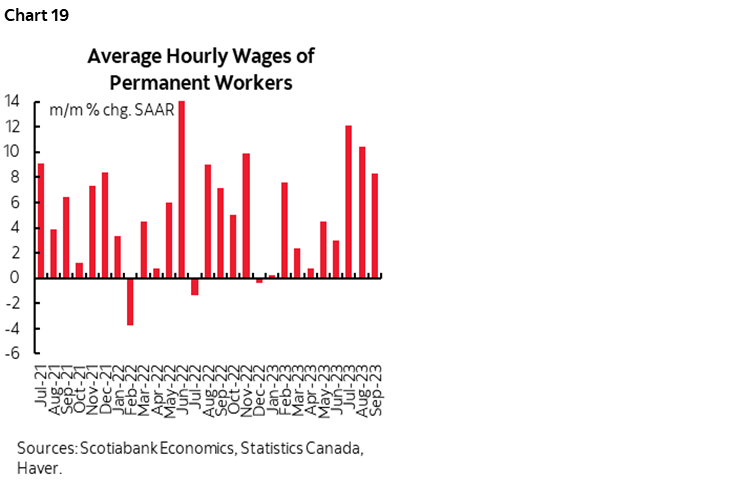
Canadian markets will start off the week on holiday for Canadian Thanksgiving. The rest of the week will see local markets driven by external events absent any domestic calendar-based risk, although wage settlement figures for August may arrive toward the end of the week. They may further inform the torrid rate of wage growth we’ve been seeing (chart 19) in the context of a buoyant job market (recap here).
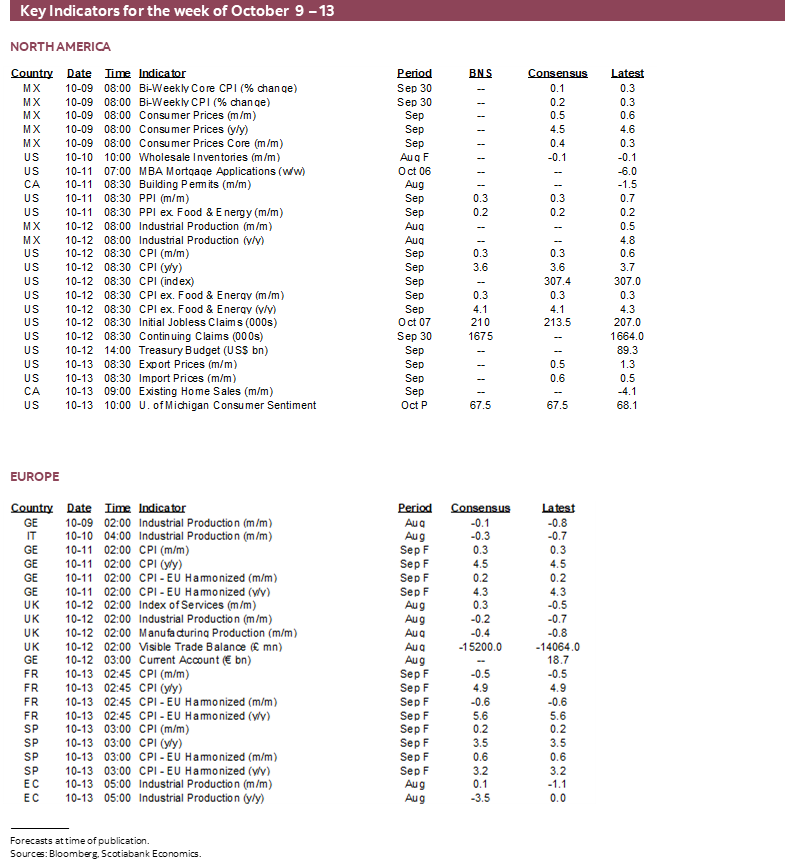
US markets will kick off the week on holiday for Columbus Day. The week’s main events will include the aforementioned FOMC minutes on Wednesday, CPI on Thursday and bank earnings on Friday. Added to this list could be a targeted vote in the House of Representatives to choose the next victim Speaker which may help to determine the risk of a government shutdown by the time the current funding extension expires on November 17th. Additional US data releases will only include NFIB small business sentiment (Tuesday), producer prices (Wednesday), weekly claims (Thursday) and University of Michigan consumer sentiment for October (Friday). There will also be a fair amount of Fed-speak throughout the week.
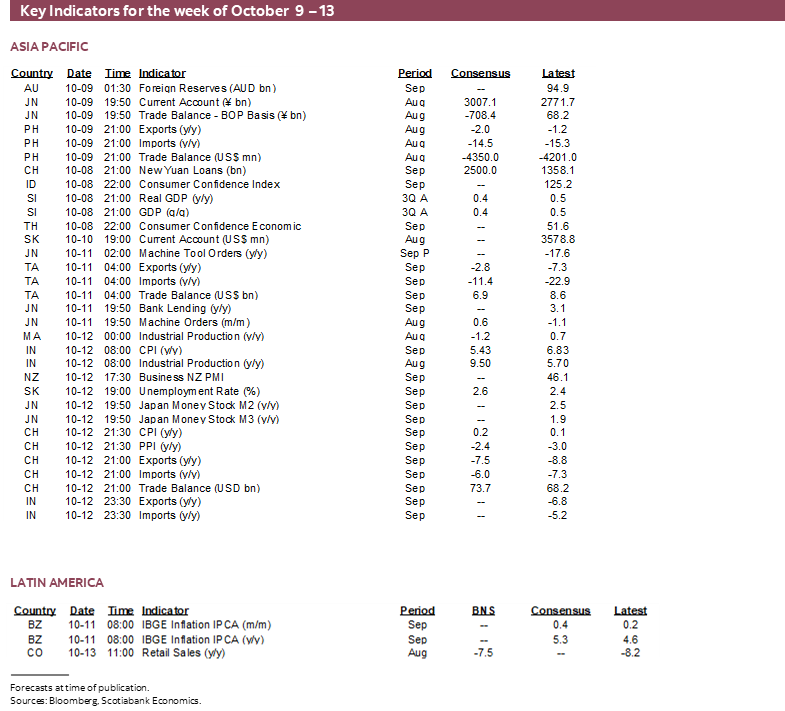
Is China in deflation? I don’t think so and have argued against it on multiple occasions while instead arguing that Chinese inflation would accelerate into 2024. Thursday evening (ET) will bring out the latest update of CPI for September. As the year-ago base effect shifts to the m/m increase in September 2022 from the prior month’s dip, there may be downside risk to the year-over-year rate unless stimulus effects and currency moves dominate. If so, then that’s likely to be an aberration along a rising trend.
China will also update exports for September late in the week and will update financing and money supply figures either this week or the following week.
A series of global inflation reports will also extend to Mexico (Monday), Norway (Tuesday), Japan and Brazil (Wednesday), India (Thursday) and Sweden (Friday). The somewhat tardy 1- and 3-year measures of CPI expectations in August will be released by the ECB on Wednesday.
The UK will update a series of macro readings that will further inform Q3 growth tracking on Thursday including monthly GDP, industrial output, the services index, construction activity and trade figures all for the month of August.
Finally, watch for Eurozone industrial output numbers during August on Friday. We already know that states such as France and Spain posted weak readings, but Monday’s German tally and Tuesday’s Italian reading will provide a better sense of the magnitude of the total decline.
DISCLAIMER
This report has been prepared by Scotiabank Economics as a resource for the clients of Scotiabank. Opinions, estimates and projections contained herein are our own as of the date hereof and are subject to change without notice. The information and opinions contained herein have been compiled or arrived at from sources believed reliable but no representation or warranty, express or implied, is made as to their accuracy or completeness. Neither Scotiabank nor any of its officers, directors, partners, employees or affiliates accepts any liability whatsoever for any direct or consequential loss arising from any use of this report or its contents.
These reports are provided to you for informational purposes only. This report is not, and is not constructed as, an offer to sell or solicitation of any offer to buy any financial instrument, nor shall this report be construed as an opinion as to whether you should enter into any swap or trading strategy involving a swap or any other transaction. The information contained in this report is not intended to be, and does not constitute, a recommendation of a swap or trading strategy involving a swap within the meaning of U.S. Commodity Futures Trading Commission Regulation 23.434 and Appendix A thereto. This material is not intended to be individually tailored to your needs or characteristics and should not be viewed as a “call to action” or suggestion that you enter into a swap or trading strategy involving a swap or any other transaction. Scotiabank may engage in transactions in a manner inconsistent with the views discussed this report and may have positions, or be in the process of acquiring or disposing of positions, referred to in this report.
Scotiabank, its affiliates and any of their respective officers, directors and employees may from time to time take positions in currencies, act as managers, co-managers or underwriters of a public offering or act as principals or agents, deal in, own or act as market makers or advisors, brokers or commercial and/or investment bankers in relation to securities or related derivatives. As a result of these actions, Scotiabank may receive remuneration. All Scotiabank products and services are subject to the terms of applicable agreements and local regulations. Officers, directors and employees of Scotiabank and its affiliates may serve as directors of corporations.
Any securities discussed in this report may not be suitable for all investors. Scotiabank recommends that investors independently evaluate any issuer and security discussed in this report, and consult with any advisors they deem necessary prior to making any investment.
This report and all information, opinions and conclusions contained in it are protected by copyright. This information may not be reproduced without the prior express written consent of Scotiabank.
™ Trademark of The Bank of Nova Scotia. Used under license, where applicable.
Scotiabank, together with “Global Banking and Markets”, is a marketing name for the global corporate and investment banking and capital markets businesses of The Bank of Nova Scotia and certain of its affiliates in the countries where they operate, including; Scotiabank Europe plc; Scotiabank (Ireland) Designated Activity Company; Scotiabank Inverlat S.A., Institución de Banca Múltiple, Grupo Financiero Scotiabank Inverlat, Scotia Inverlat Casa de Bolsa, S.A. de C.V., Grupo Financiero Scotiabank Inverlat, Scotia Inverlat Derivados S.A. de C.V. – all members of the Scotiabank group and authorized users of the Scotiabank mark. The Bank of Nova Scotia is incorporated in Canada with limited liability and is authorised and regulated by the Office of the Superintendent of Financial Institutions Canada. The Bank of Nova Scotia is authorized by the UK Prudential Regulation Authority and is subject to regulation by the UK Financial Conduct Authority and limited regulation by the UK Prudential Regulation Authority. Details about the extent of The Bank of Nova Scotia's regulation by the UK Prudential Regulation Authority are available from us on request. Scotiabank Europe plc is authorized by the UK Prudential Regulation Authority and regulated by the UK Financial Conduct Authority and the UK Prudential Regulation Authority.
Scotiabank Inverlat, S.A., Scotia Inverlat Casa de Bolsa, S.A. de C.V, Grupo Financiero Scotiabank Inverlat, and Scotia Inverlat Derivados, S.A. de C.V., are each authorized and regulated by the Mexican financial authorities.
Not all products and services are offered in all jurisdictions. Services described are available in jurisdictions where permitted by law.