Next Week's Risk Dashboard
- Treasury’s debt sales plan may be taken more in stride this week
- FOMC is expected to stay on hold amid upside risks to inflation
- US productivity to offset higher labour costs
- BoJ watchers on guard for policy tweaks
- BoE expected to hold as the macro environment sours
- Will US nonfarm payrolls repeat the prior big gain?
- BoC’s Macklem gets another chance. Two in fact.
- Canada’s economy is plodding along despite shocks aplenty
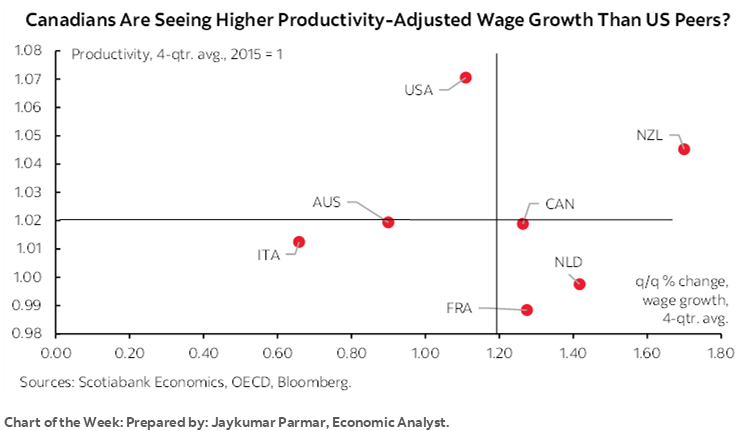
- Will acute Canadian wage pressures abate?
- Norges Bank expected to pause
- BanRep expect to extend its hold
- Brazil’s central bank likely to cut again
- Bank Negara playing defence on ringgit weakness
- China’s PMIs to inform Q4 growth momentum
- Eurozone CPI expected to continue easing
- GDP: Eurozone, Canada, Mexico, Peru, Sweden,
- CPI: Peru, SK, Indonesia, Switzerland
- Heavy earnings calendar
- Other Global Macro
Chart of the Week
THE QT AND REFUNDING TANGO
The coming week is going to be packed with global calendar-based developments alongside the ongoing potential for flaring geopolitical risks. As this note is being published, gold has risen to over US$2000/oz amid concern that developments in the Middle East could worsen in the near-term. Israel has announced that it is expanding military incursions into Gaza and the US, Iran and its puppets have been trading warnings. Pity the line-up of central bankers who must deliver decisions but the show must go on as they say. Multiple top-shelf macroeconomic indicators, the ongoing global earnings season and the US Treasury’s latest debt issuance plans will all combine to make for heightened market volatility.
US LABOUR MARKETS—THE PRODUCTIVITY DIVIDEND
When it comes to nonfarm payrolls during October, let’s just see the numbers when they arrive on Friday and then assess. I’ve pencilled in a gain of 200k alongside trend wage pressure at about 0.3% m/m SA. That’s not with enormous confidence given the scope for surprise (witness last month’s 336k rise). The 90% confidence interval on nonfarm payrolls is +/- 130k and so there is a very wide band of noise that typically envelopes all or most attempts at estimating change.
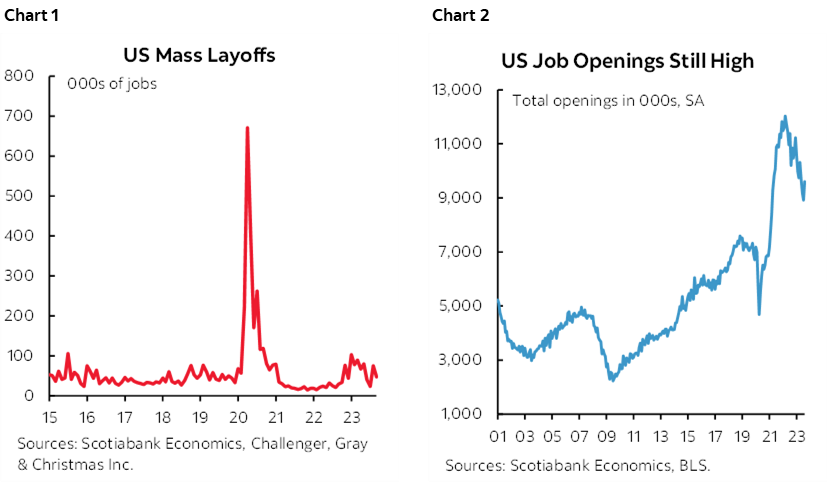
Still, we can say with some comfort that the US job market is holding it together rather well roughly two years into the period in which markets began pricing rate hikes. Initial weekly jobless claims are low at just over 200k. Challenger layoffs have moved up but only from the zero-nothing levels during the initial recovery from the depths of the pandemic and toward a level that is still very compatible with job growth, pending Thursday’s update (chart 1). JOLTS job vacancies are due for another update on Wednesday but remain elevated especially following the prior month’s surprise increase (chart 2). As for ADP’s update on Wednesday, react, then quickly ignore given its track record.
What could nevertheless dominate the week’s labour market readings may be the tango between productivity and labour costs and whether that is fundamentally changing. The Employment Cost Index probably climbed by around 1% q/q SA or so at a nonannualized rate and so Tuesday’s release may further inform concern about rising labour costs and the inflation implications.
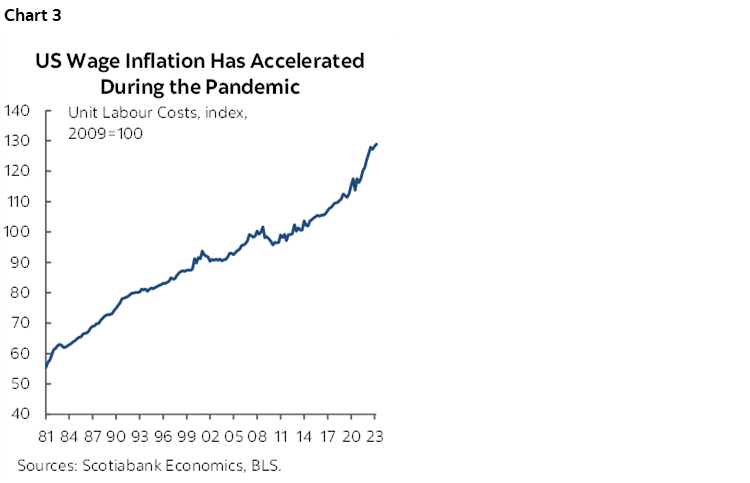
Until Thursday. That’s when a more complete picture arrives in the form of Q3 productivity and unit labour costs. On the back of the Q3 4.9% q/q SAAR GDP gain and what the details signal for the nonfarm business sector coupled with what we know about hours worked, I’ve estimated that productivity probably climbed by around 4% q/q SAAR. If so, then productivity-adjusted employment costs, otherwise known as unit labour costs, probably stagnated.
The only weaker print for unit labour costs since 2021Q1 was 2022Q4 when they fell outright along a soaring trend (chart 3). This week’s estimate is unlikely to be the start of a trend in productivity and ULCs, but uber-sensitive and short-sighted markets may think otherwise when the number pops on their screens.
FEDERAL RESERVE—THE QT AND REFUNDING TANGO
The debt issuance plans of the US government could well steal the show from Chair Powell and the FOMC this week.
Federal Reserve—No Change, But Risk of More Hikes
The FOMC statement arrives on Wednesday at 2pmET sans dots and Summary of Economic Projections this time with the next release of projections due at the December meeting. Chair Powell’s press conference will follow 30 minutes later.
No change is expected. The Powell Fed—or rather the pandemic-era Fed—doesn’t like to spring surprises. Chair Powell’s comments at the Economic Club of New York (recapped here) set the stage for this meeting just before entering the pre-meeting communications blackout period. His opening remarks stated:
"We are attentive to recent data showing the resilience of economic growth and demand for labor. Additional evidence of persistently above-trend growth, or that tightness in the labor market is no longer easing, could put further progress on inflation at risk and could warrant further tightening of monetary policy."
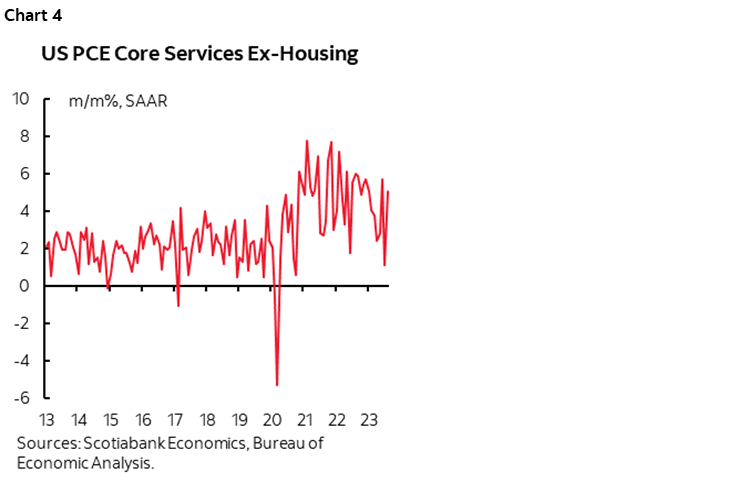
Enter evidence that underlying price pressures are volatile but still too hot for the Fed’s comfort especially in terms of underlying services (chart 4). Going forward, I think it’s feasible that markets will see persistent upside risk to inflation. Higher oil prices and their pass-through risks are one consideration.
Another is that the US economy has yet to even tiptoe toward building slack and has been going in the other direction by building upon capacity pressures as evidenced by the roughly 5% q/q SAAR GDP growth in Q3 (recapped here).
Risks to global supply chains through geopolitical considerations remain high and we’re still at a highly nascent stage of c-suite efforts to revamp them in a more fragmented world that entails higher costs being passed on.
Further, the state of US consumer finances indicates an ability to pay, given observations such as a 22-year low in the debt-to-income ratio, record low debt payments as a share of incomes, locked-in low 30-year mortgage rates and still high cash balances even if saving rates have normalized (chart 5).
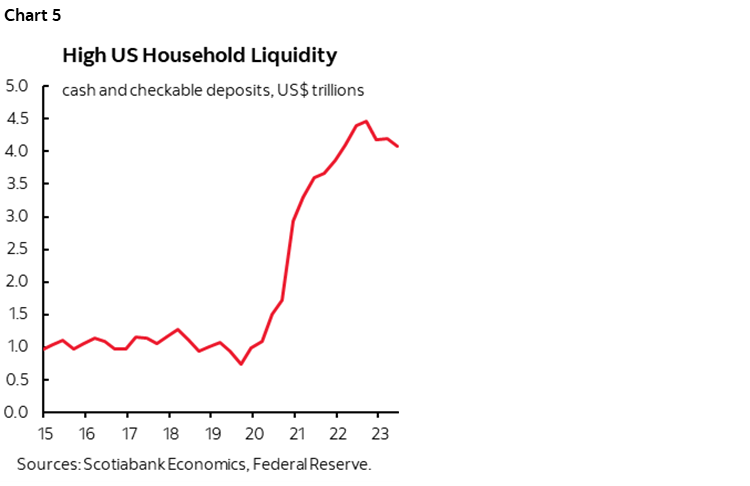
After all, it certainly doesn’t seem to be the case that higher prices are holding back consumption given that consumer spending was a sizeable driver of the 5% Q3 GDP growth rate. Consumers may not like it, but they are plugging their noses and paying higher prices to buy more regardless.
US Treasury Issuance Plans Could Matter More than the Fed
But what if on top of still high inflation risk the FOMC becomes less convinced that surging bond yields will serve as a substitute for hiking the policy rate?
That perspective may be further informed by the US Treasury’s debt issuance plans this week. Treasury announces Q4 marketable borrowing estimates on Monday at 3pmET. It then announces the Q4 Quarterly Refunding Statement that lays out the size and frequency of auctions on Wednesday morning at 8:30amET and hence right into day 2 of the FOMC meeting.
Recall that the last time we had these announcements back on July 31st and August 2nd they contributed to the accelerated rise in US Treasury yields. So did the July 27th Bank of Japan move to tweak its yield curve control parameters that prompted a sell off in Japanese government bonds with trickle over effects into Treasuries.
Why the earlier Treasury shockwave? On July 31st at 3pmET, the US Treasury announced that it had increased the estimated amount of privately-held net marketable borrowing for Q3 to US$1.007 trillion which was well in excess of street estimates that had expected a reading in the high 700s or 800s (here). Two days later, that was accompanied by the Quarterly Refunding Statement (here) that said “Treasury anticipates incrementally increasing auction sizes across benchmark tenors” and backed that up with higher than expected auction sizes along with guidance that “further gradual increases will likely be necessary in future quarters.”
The size of its quarterly bond sales increased for the first time since early 2021 and then Fitch downgraded the US government’s credit rating from AAA to AA+. More supply, negative ratings action, and presto, yields climbed.
It’s feasible that the issuance profile is raised again this week, but the question this time is how much of that expectation has already been priced in higher Treasury yields given the advance guidance. I think all or almost all has been priced. It would take even higher than expected issuance to shock markets again, while matching expectations or coming in lower could even spark a relief rally.
That plays into why I’m unconvinced that the bond sell off is sustainable. One bad payrolls report could swamp the boat in the other direction and drive us right back down to 3-handled 10-year Treasuries in a hurry. Deficits are an exaggerated driver of higher yields as previously argued. Issuance is overshooting in part to replenish the Treasury’s cash account at the Fed after the earlier debt ceiling fracas. Much of the narrative around higher supply and a possible BoJ pivot has been priced.
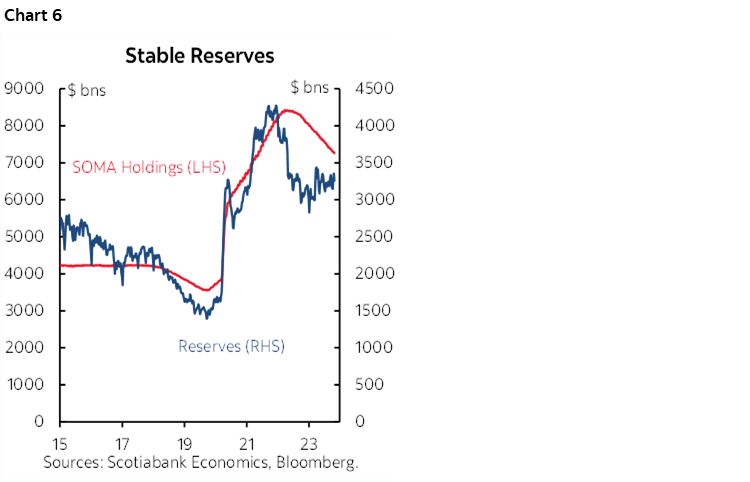
Enter the QT dialogue and the potential for the money question during Chair Powell’s press conference. By selling down their portfolio of Treasuries during funding challenges and in a different regulatory environment, it may well be that banks are signalling that the Fed’s economists are too optimistic in what they judge to be an ample reserves framework.
Chart 6 shows that reserves have been holding fairly steady around US$3¼ trillion. Fed economists figure that tapering roll-off of maturing holdings of Treasuries and MBS from the Fed’s balance sheet should only be considered once reserves hit 10% of GDP and stopped when they get to 9% which could imply stopping QT only once reserves get in a US$2¾ to $3 trillion range. Former NY Fed President Bill Dudley has adopted a damn-the-torpedoes approach by preferring that the Fed stays committed to QT for two more years. The Fed has seriously misjudged the reserves framework before. The signals from the banking sector alongside bank selling and higher Treasury yields may be revealing that the floor for reserves is higher. The Fed should tread very carefully and avoid ignoring such signals like they did when they blew up the repo and broader funding markets in late 2019. The supports are better developed this time through other policy tools, but it would still be unwelcome to have to deploy them in a come-by-chance Russian Roulette fashion.
A BIG WEEK IN CANADA
This could be a significant week for Canada watchers as expanded testimony from the Bank of Canada will combine with updates on GDP, jobs and wages plus a deluge of Q3 earnings reports.
BoC’s Macklem Needs to Clarify
First up will be Governor Macklem and Senior Deputy Governor Rogers as they deliver parliamentary testimony as is customary following MPR meetings. It starts on Monday when they appear before the House of Commons Standing Committee on Finance at 3:30pmET at which point a written opening statement will be offered and followed by Q&A. The timing may be a tad awkward from a bond market standpoint as it roughly coincides with a key announcement from the US Treasury as discussed later. The dynamic duo returns on Wednesday to do it all over again at 4:15pmET before the Standing Senate Committee on Banking, Commerce and the Economy.
Governor Macklem has a bit of explaining to do. He’s normally a polished, more consistent communicator than his predecessor’s reputation for giving multiple conflicting narratives on decision day and the day after. That may not have been the case this past week.
This past Wednesday, Macklem & Co delivered a hawkish hold in which he raised the inflation forecast, pushed out achievement of 2% until 2025H2, said that inflation risks had moved higher and that they were prepared to hike further if needed. That didn’t sound like a central bank head who thought rates had peaked and victory was near at hand.
The next day he delivered a radio interview in which he said “the economy is not overheated anymore and…we do think there’s more inflation relief in the pipeline, and if that comes through, we won’t have to raise rates further.” It’s possible that he was baited, that context matters, and that knew his audience’s proclivities.
I guess those comments could be consistent with one another in that higher for longer inflation could still be on an improving path, but it raised a few eyebrows among our clients. This set of somewhat competing messages could be consistent in speaking to a range of possibilities, but further clarification would be helpful. What’s the fat tail, Governor? Besides, one could easily debate his connection between an overheating economy and inflation and the implied output gap framework of thinking. That framework has not performed well as a tool for forecasting inflation during the pandemic era. That’s vividly shown by the BoC’s severe forecast failings when it comes to assessing inflation risk based upon such a modelling framework as shown in chart 7.

GDP—Nowhere Fast
Sandwiched in between the Macklem/Rogers testimonies will be GDP figures for August and a preliminary estimate for September. StatCan had guided on September 29th that August GDP was tracking a mild 0.1% m/m SA gain and was driven by increases in wholesale trade and finance. My regression equation against high frequency readings yields a similar outcome. As for September, it’s looking as if GDP will land softly based upon a limited array of readings that are available thus far.
If that tracking turns out to be correct, then Canada’s economy probably posted very little if any GDP growth in Q3 using the monthly production-side GDP accounts. We still need the full quarter’s inventories and net trade figures to assess quarterly GDP on an expenditure basis which is what most including the BoC forecast, but at this point Q3 looks to be somewhat of a dud. The silver lining is that after all the transitory shocks thrown at the economy over the summer plus the effects of rate hikes, it’s a minor miracle that the economy has not contracted to date.
Labour Markets—Still Ripping Wages?
Canada updates labour market readings including jobs, wages, hours worked and other metrics for the month of October on Friday. It could make the BoC testimony less fresh sounding.
I’ve estimated a modest gain of 15k jobs. That reflects some unease toward the composition of the prior month’s rise of 64k that was heavily driven by the education sector’s volatility around the start of the school year, and self employed that reflects a valued part of the workforce but is the softest of the soft data.
And yet what may dominate any jobs tally could be evidence on the wages front. I won’t say it again. Nope, won’t say that it’s unlikely that we’ll get another big month-over-month gain. I’ve said that twice now and yet for three consecutive months, average hourly wages have risen at about a 10% m/m pace in seasonally adjusted and annualized terms (chart 8). Nope, can’t possibly happen again. If it doesn’t, however, it will change nothing about my thinking that wage pressures remain at a nascent stage of formation into 2024 alongside moribund productivity as the killer combo.

Earnings—A Heavy Week
84 TSX-listed firms release earnings reports this week. It’s the heaviest week of the season with the following week a close second before the key banks begin to release toward the end of November.
Some of the key names on tap will include Shopify, Magna, CN, Thomson Reuters, Brookfield, Telus, Air Canada, BCE, Bombardier and CN.
BANK OF JAPAN—TRICK OR TREAT?
The Bank of Japan delivers its latest policy decisions on Tuesday. Halloween isn’t a thing in Japan, but it could still prompt all manner of potential spooky headlines depending upon what course of action they adopt.
No change is expected for the -0.1% policy balance rate and the yield curve control range around the 10-year JGB yield target of 0% and an upper tolerance range of 1% compared to 0.87% at present. Then again, the Bank of Japan isn’t the Fed; it is much more prone to shocking markets as it has done twice in the past year alone.
As the upper limit of the 10-year JGB yield target range is probed (chart 9), it could be that Governor Ueda will decide not to stand in its way and raise the upper ceiling by 25–50 bps. If so, then global bonds face a bleak week ahead. If not, there could be a relief rally.

The added consideration is guidance on leaving the negative policy rate framework in the dust. Speculation has been rampant for a while now that year-end into 2024 could bring just such a moment. The -0.1% policy balance rate is presently priced by being abandoned by about March of next year. It is around that time when the BoJ will have a better idea of how the annual Spring wage negotiations are going and whether last year’s large rise will be repeated.
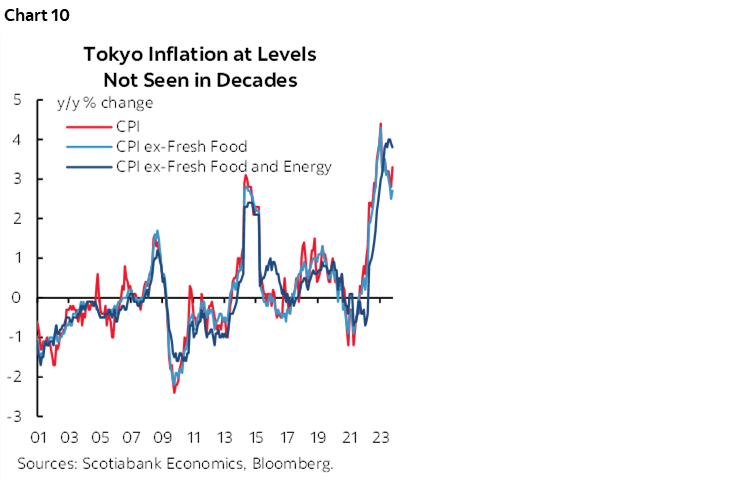
New forecasts will be delivered at this meeting. Firm inflationary pressures (chart 10) could motivate upward revisions to inflation forecasts alongside the effects of higher oil prices.
BANK OF ENGLAND—A HAWKISH HOLD
Consensus pretty much unanimously thinks that the Bank of England will leave Bank Rate unchanged at 5.25% on Thursday. Markets are priced for no policy rate change at this meeting and a modest chance at another rate hike several meetings from now.
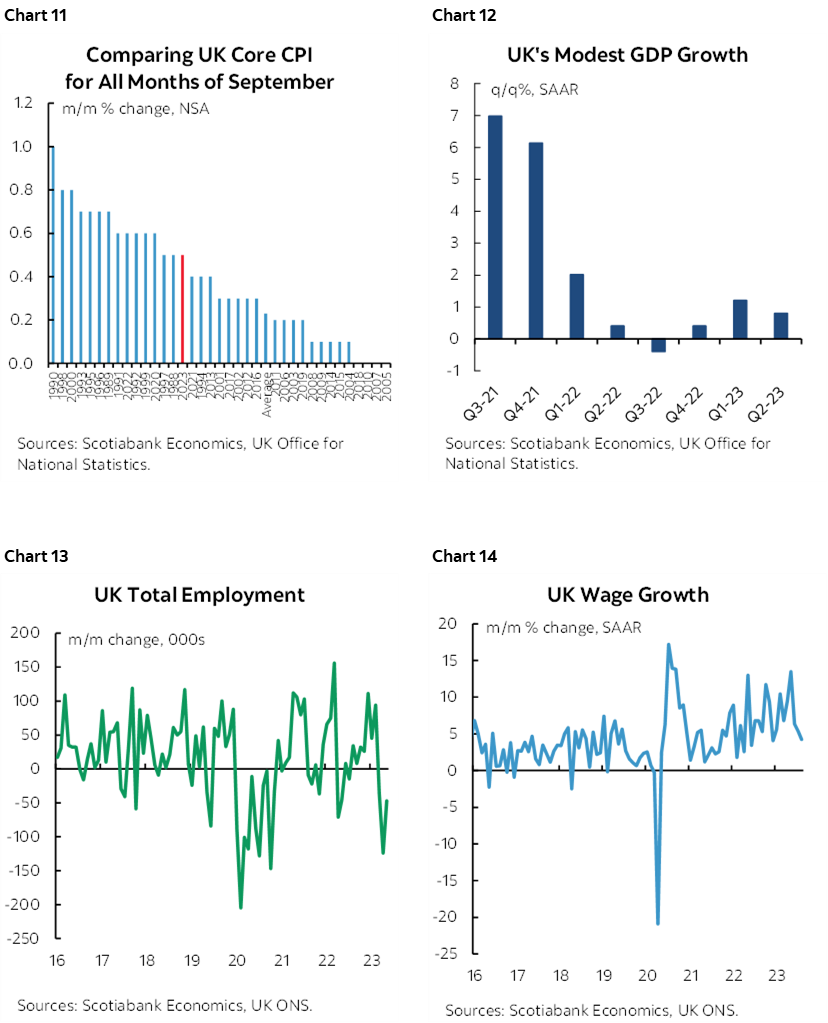
Core CPI pressures are no longer as hot as they once were (chart 11). GDP growth as stumbled (chart 12). Jobs are being lost (chart 13). Wage growth has eased somewhat of late (chart 14). Plus e gilts markets has been caught up in the global bond market sell off like everyone else.
Expect finger wagging nonetheless. That’s partly to manage markets away from prematurely pricing easing, and partly because of caution toward the potential re-emergence of upside risks to inflation. A new batch of forecasts is due at this meeting and this may inform the prospects for further tightening and timing future easing well down the road.
NORGES BANK—TAKING A BREATHER
After hiking in September, no change is expected in the deposit rate of 4¼% on Thursday. Norges Bank has previously guided that it may hike by another 25bps before year end which is why markets are pricing a decent shot at a hike at the December 14th decision. Higher oil prices may reinforce this guidance.
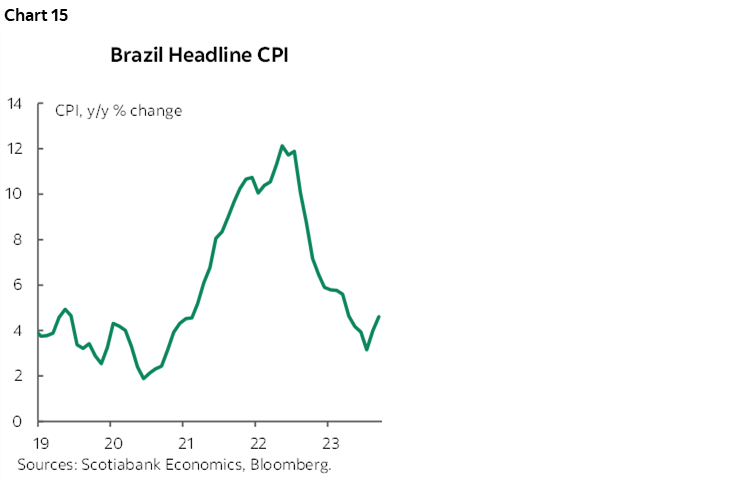
BRAZIL’S CENTRAL BANK—BECAUSE THEY SAID!
Another 50bps reduction in the Selic Rate is expected on Wednesday that would bring it down to 12¼%.
Why? Because they said so at the last decision.
"If the scenario evolves as expected, the Committee members unanimously anticipate further reductions of the same magnitude in the next meetings and judge that this pace is appropriate to maintain the necessary contractionary monetary policy for the disinflationary process."
A challenge is that since that last cut on September 20th, the real has depreciated by nearly 3% to the dollar. Currency depreciation was the motivating factor behind the decision by Chile’s central bank to cut by less than expected this past week. Given more modest depreciation in the real than the peso, the BCB may stick to cutting 50bps but the stalled progress in falling inflation could result in somewhat more cautious forward guidance this time (chart 15).
BANREP—A CAUTIOUS HOLD
Colombia’s central bank is expected to leave its overnight lending rate unchanged at 13.25% on Tuesday. BanRep has been on hold since the last hike in late April. Inflation remains stubbornly too high. Some think that the central bank may pivot toward modest easing by the December 19th decision or early in 2024, but that would require considerably further progress toward lower inflation when oil prices and the currency have not been terribly cooperative of late.
MALAYSIA’S CENTRAL BANK—THE RINGGIT PREVENTS EASING
Bank Negara is widely expected to leave its overnight policy rate unchanged on Thursday. It has been stuck at 3% since early May following the last hike. Inflation is low at 1.9% y/y and may support easing, but inflation risk and stability concerns stem from the ringgit’s weakness plumbs historic depths. Uncertainty toward whether the Federal Reserve is done tightening policy creates an unforgiving backdrop for domestic monetary easing.
GLOBAL MACRO
I’ll write more about the macro indicator line-up over the course of the week when more time beckons than at present, but for now, here’s a quick rattling off of the key ones.
United States Releases
Tuesday brings out consumer confidence that may dip, along with repeat-sale home prices that will try for the sixth straight monthly rise in a row as home prices roar back. Wednesday’s releases will include ISM-manufacturing that should remain in mild contraction territory and affected by strikes, plus an expected gain in construction spending and little change in vehicle sales that have been trending largely sideways throughout the year. Factory orders should climb significantly on Thursday given we already know that durable goods orders jumped higher. Friday closes it out when ISM-services is expected to continue signalling modest growth in the service sector.
China’s PMIs
China updates purchasing managers indices for the month of October on Monday evening eastern time. They will inform growth momentum into Q4. The private sector PMIs that are more weighted toward smaller non-SOE producers are due out the following evening (manufacturing) and on Thursday evening (services).
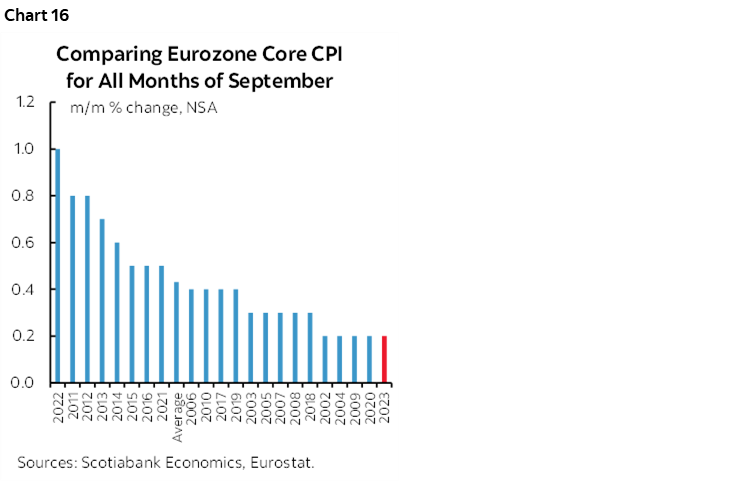
Eurozone CPI
Eurozone CPI will dominate global inflation readings when it lands on Tuesday. Core inflation is expected to ease further toward 4% y/y from a peak of 5.7% in March, but key will be whether that’s just due to year-ago base effects or whether month-over-month pressures abate like they did the prior month (chart 16). Spain and Germany kick off the country-level figures on Monday followed by France and Italy on Tuesday. Other inflation releases will include Switzerland (Thursday), Peru (Wednesday), South Korea (Wednesday) and Indonesia (Wednesday).
Global Growth
GDP figures will inform global growth momentum. The Eurozone updates on Tuesday and no growth is expected for Q3. Germany’s economy is forecast to mildly contract on Monday and France’s economy could post a slight gain on Tuesday. Mexico’s Q3 GDP figures is expected to hold steady around 3½% y/y on Tuesday.
New Zealand Job Markets
RBNZ watchers will want to keep an eye on the Halloween release of Q3 job growth and wages particularly given what has been a pretty firm trend in wage growth to accompany strong job growth.

DISCLAIMER
This report has been prepared by Scotiabank Economics as a resource for the clients of Scotiabank. Opinions, estimates and projections contained herein are our own as of the date hereof and are subject to change without notice. The information and opinions contained herein have been compiled or arrived at from sources believed reliable but no representation or warranty, express or implied, is made as to their accuracy or completeness. Neither Scotiabank nor any of its officers, directors, partners, employees or affiliates accepts any liability whatsoever for any direct or consequential loss arising from any use of this report or its contents.
These reports are provided to you for informational purposes only. This report is not, and is not constructed as, an offer to sell or solicitation of any offer to buy any financial instrument, nor shall this report be construed as an opinion as to whether you should enter into any swap or trading strategy involving a swap or any other transaction. The information contained in this report is not intended to be, and does not constitute, a recommendation of a swap or trading strategy involving a swap within the meaning of U.S. Commodity Futures Trading Commission Regulation 23.434 and Appendix A thereto. This material is not intended to be individually tailored to your needs or characteristics and should not be viewed as a “call to action” or suggestion that you enter into a swap or trading strategy involving a swap or any other transaction. Scotiabank may engage in transactions in a manner inconsistent with the views discussed this report and may have positions, or be in the process of acquiring or disposing of positions, referred to in this report.
Scotiabank, its affiliates and any of their respective officers, directors and employees may from time to time take positions in currencies, act as managers, co-managers or underwriters of a public offering or act as principals or agents, deal in, own or act as market makers or advisors, brokers or commercial and/or investment bankers in relation to securities or related derivatives. As a result of these actions, Scotiabank may receive remuneration. All Scotiabank products and services are subject to the terms of applicable agreements and local regulations. Officers, directors and employees of Scotiabank and its affiliates may serve as directors of corporations.
Any securities discussed in this report may not be suitable for all investors. Scotiabank recommends that investors independently evaluate any issuer and security discussed in this report, and consult with any advisors they deem necessary prior to making any investment.
This report and all information, opinions and conclusions contained in it are protected by copyright. This information may not be reproduced without the prior express written consent of Scotiabank.
™ Trademark of The Bank of Nova Scotia. Used under license, where applicable.
Scotiabank, together with “Global Banking and Markets”, is a marketing name for the global corporate and investment banking and capital markets businesses of The Bank of Nova Scotia and certain of its affiliates in the countries where they operate, including; Scotiabank Europe plc; Scotiabank (Ireland) Designated Activity Company; Scotiabank Inverlat S.A., Institución de Banca Múltiple, Grupo Financiero Scotiabank Inverlat, Scotia Inverlat Casa de Bolsa, S.A. de C.V., Grupo Financiero Scotiabank Inverlat, Scotia Inverlat Derivados S.A. de C.V. – all members of the Scotiabank group and authorized users of the Scotiabank mark. The Bank of Nova Scotia is incorporated in Canada with limited liability and is authorised and regulated by the Office of the Superintendent of Financial Institutions Canada. The Bank of Nova Scotia is authorized by the UK Prudential Regulation Authority and is subject to regulation by the UK Financial Conduct Authority and limited regulation by the UK Prudential Regulation Authority. Details about the extent of The Bank of Nova Scotia's regulation by the UK Prudential Regulation Authority are available from us on request. Scotiabank Europe plc is authorized by the UK Prudential Regulation Authority and regulated by the UK Financial Conduct Authority and the UK Prudential Regulation Authority.
Scotiabank Inverlat, S.A., Scotia Inverlat Casa de Bolsa, S.A. de C.V, Grupo Financiero Scotiabank Inverlat, and Scotia Inverlat Derivados, S.A. de C.V., are each authorized and regulated by the Mexican financial authorities.
Not all products and services are offered in all jurisdictions. Services described are available in jurisdictions where permitted by law.