Next Week's Risk Dashboard
- Fed’s Powell to update his stance before blackout
- US inflation risk remains skewed higher
- Deficits driving higher bond yields? It’s just not that simple
- BoC surveys to inform inflation expectations
- Canadian core inflation has yet to experience a soft patch
- PBOC faces a stronger case for a pause than a cut
- US earnings season intensifies
- China’s economy probably grew solidly
- Labour is vulnerable in NZ’s election
- BoK, BI expected to stay on hold
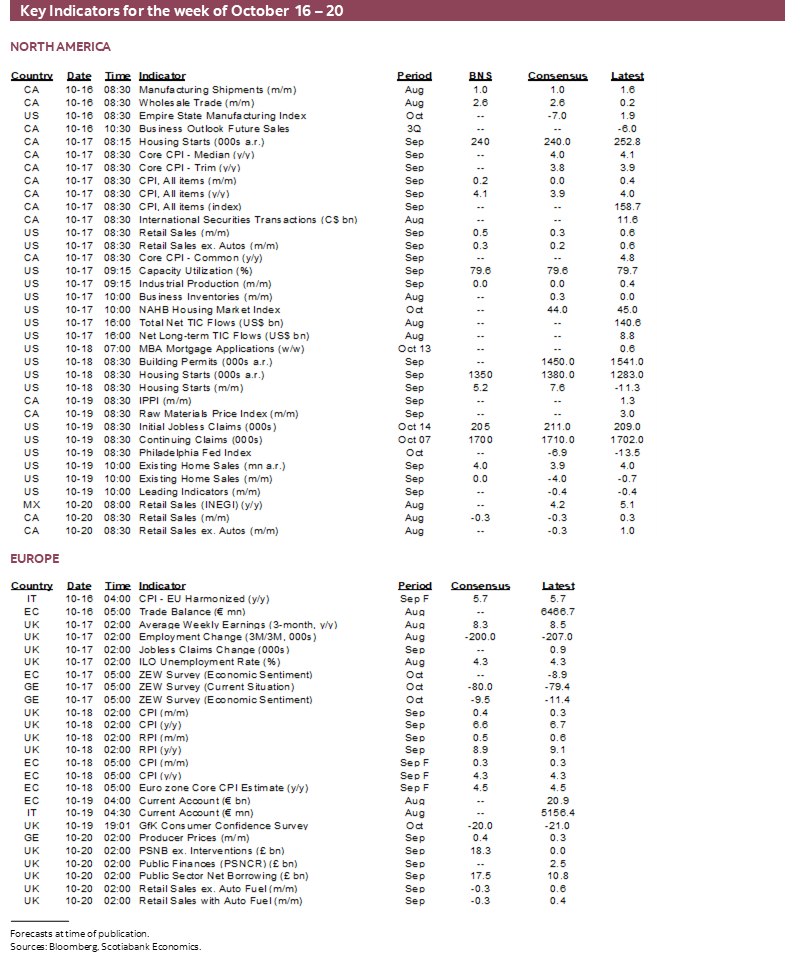
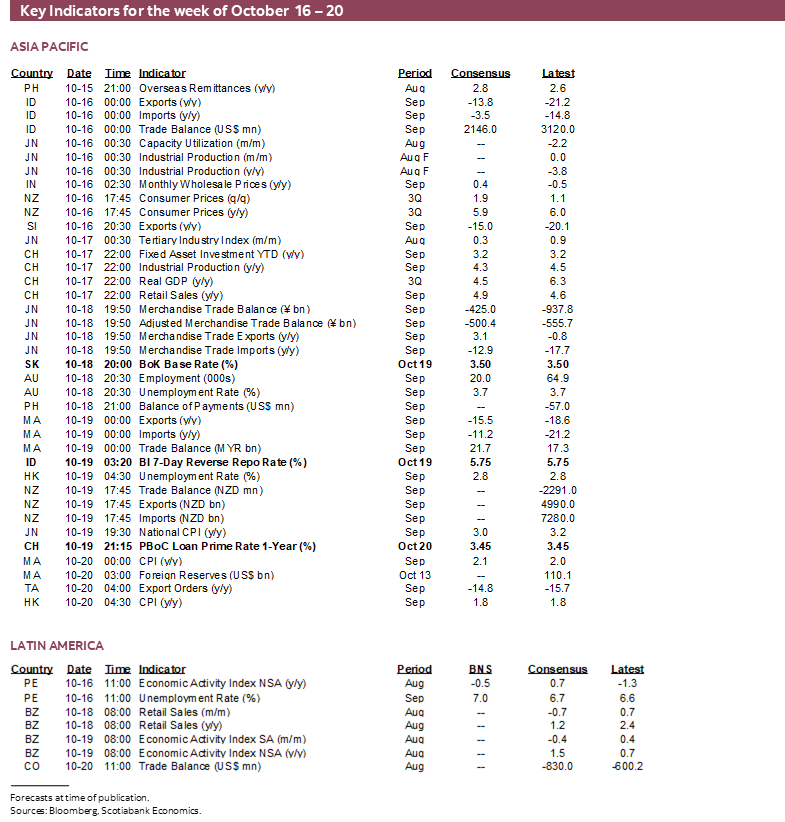
- A heavy global indicator line-up
Chart of the Week
The war in Israel and its potential spillover effects may well dominate developments this week (and beyond...), but there will be several serious contenders for the biggest global and regional market influences. Amid seemingly never-ending US political dysfunction, markets will turn their eyes to Fed Chair Powell for his potential guidance just before going into communications blackout ahead of the next decision. The PBOC’s latest decision will kick off the week. Pricing for the Bank of Canada’s upcoming decisions could be influenced by inflation and BoC surveys plus rebound evidence. A heavy earnings calendar will compete with top shelf macro releases from across the world and Kiwis may vote out of office the incumbent government.
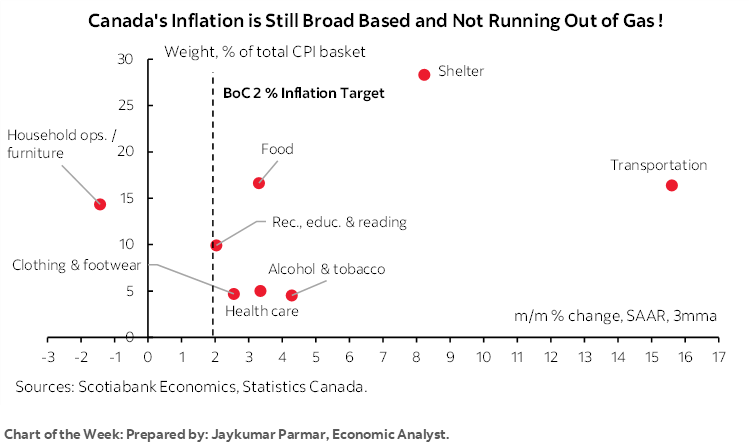
CANADIAN INFLATION—THE TREND IS NOT THE BoC’S FRIEND
Canada updates CPI and underlying inflation gauges for the month of September on Tuesday. The day before we’ll get the updated surveys of business and consumer expectations including inflation gauges. The combined set of readings will inform expectations for the Bank of Canada’s next policy decision the following week on October 25th.
I’ve estimated that headline inflation will rise by 0.2% m/m NSA and hence about 0.5% m/m SA given the combined effects of the prior month’s index level and a normal seasonal adjustment factor for the month of September. Traditional core CPI is also estimated to have risen by about 0.4% m/m SA.
What is much more difficult to estimate are the two primary gauges of underlying inflation that the Bank of Canada references—trimmed mean and weighted median CPI. The pattern to date has continued to indicate unacceptably high underlying inflation. Chart 1 shows that both trimmed mean and weighted median CPI were up by 5.4% at a seasonally adjusted and annualized rate (SAAR). A three-month moving average of this measure stands at 4.4% for weighted median CPI and 4.6% for trimmed mean. Both readings are far above the BoC’s 2% target for headline inflation.
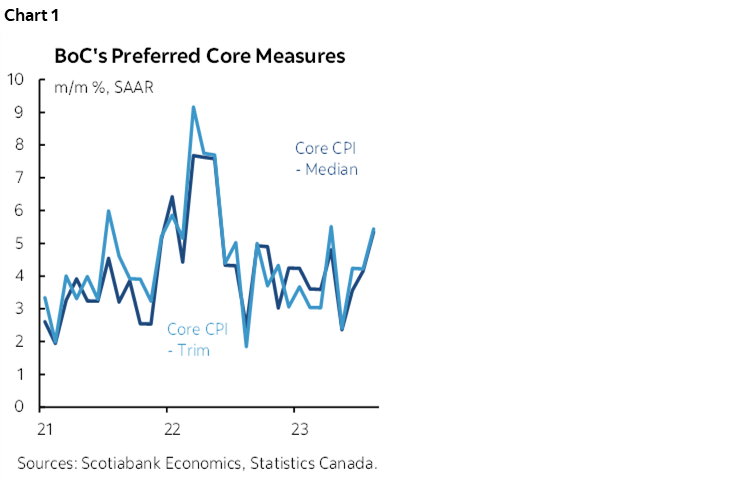
We can alternatively look at these readings in year-over-year terms in which case they are averaging 3.9% on a 3-month moving average basis. The problem with doing so is two-fold. For one, it’s less timely than the m/m measures that will capture inflection points sooner. For another, the year-over-year rates can turn too slowly because of how they are calculated by compounding each month-over-month reading subject to each measure’s unique methodology.
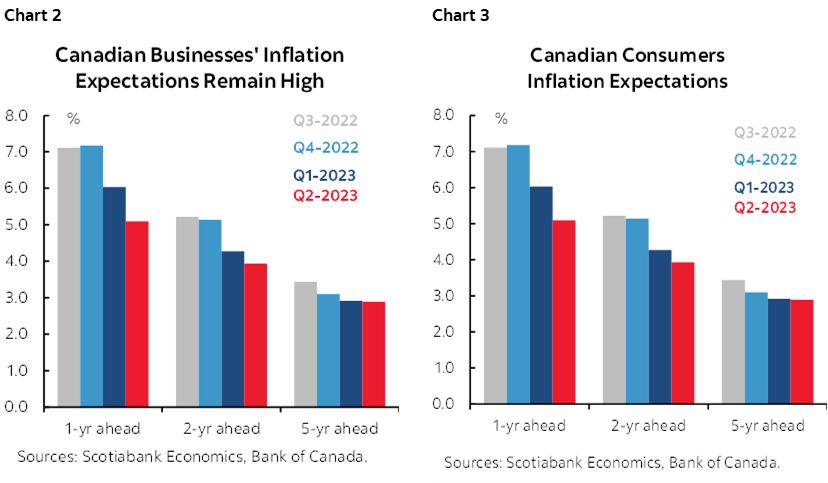
What people expect to happen to inflation is also important. The BoC’s Q3 Business Outlook Survey and Canadian Survey of Consumer Expectations on Monday will inform the latest evidence on inflation tracking. To date, it’s clear that consumers and businesses don’t think the BoC will achieve anything better than 3% inflation over the 1, 2 and 5 year horizons (charts 2, 3). Macklem recently remarked that “longer term inflation expectations have remained well anchored around our targets. But near term inflation expectations remain high and that could make it harder to get inflation back to our targets.” The BoC should take no comfort in measures of longer term inflation expectations since everyone by default says 2% in the long run when, as Keynes put it, “we’re all dead.” It needs to be concerned about nearer term measures and more importantly how they may be impacting behaviour.
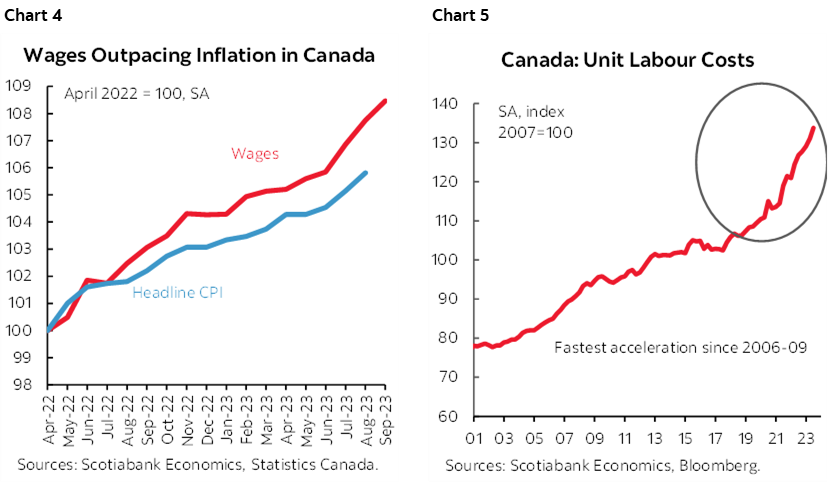
On the latter count, workers have given up on the BoC. The pace of wage gains is vastly in excess of inflation (chart 4), productivity and hence soaring unit labour costs (chart 5), and the BoC’s 2% target. This combination of getting paid more to do less reinforces inflationary outcomes and makes it considerably more difficult for the BoC to achieve its 2% inflation in the medium term as it is mandated to do.
CENTRAL BANKS—POWELL TO SET THE TABLE
There will be two key forms of central bank guidance on tap this week. One will be the PBOC’s decision into the Monday Asian market open. Two will be Fed Chair Powell’s address on Thursday.
Powell’s Parting Shot
Federal Reserve Chair Powell speaks before the Economic Club of New York on Thursday at about 12pmET and will be the primary ticket in a week that is going to be heavily laden with Fed speak before the mic gets put back in the drawer for a time. There will be prepared remarks and Q&A. Markets are lightly positioned for the risk of a hike on November 1st. Powell’s address will occur just before the FOMC goes into communications blackout next weekend and so what he says could influence market pricing for the upcoming decision.
What Powell is confronted by is a round of strong data on all fronts. Core CPI inflation is showing signs of emerging from a brief soft patch amid recently strong core services inflation that is watched closely by Powell (recap here). Nonfarm payrolls were very strong (recap here). And this is the fifth consecutive quarter in which GDP growth has been blowing the barn doors off of consensus expectations with the median tracking for Q3 at 3% q/q SAAR (chart 6).
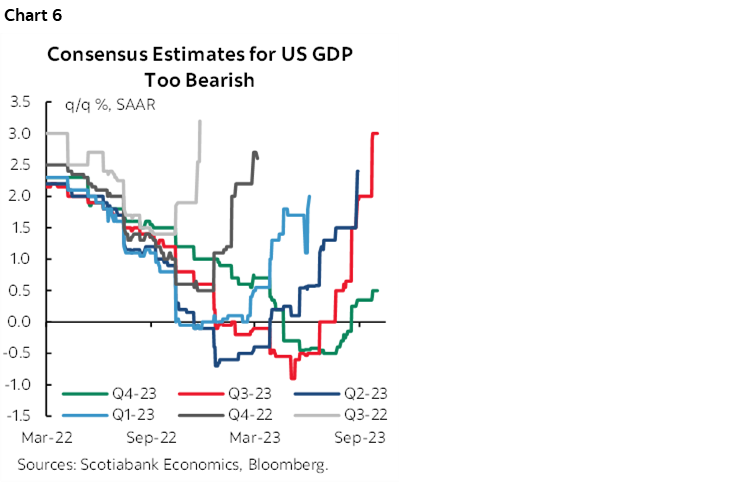
The latter matters because Powell said “reduced easing is more about stronger economic activity which means we have to do more with rates” while going on to correctly note that “GDP is not a mandate. Maximum employment and price stability are the mandates. Is the heat in GDP really a threat to getting back to 2% inflation? That is the question.”
I also hope to hear more balanced arguments from the Chair on how to read bond markets than I’ve been hearing from some other FOMC officials. There are three things I hope to hear him say on this.
1. I hope to hear the Fed Chair take a page from his Canadian counterpart after BoC Governor Macklem rightly observed that bond markets have sold off significantly due to the realization – correct or not – that policy rates will be higher for longer. Time will tell if bond markets are correct in this assumption. Indeed, after guiding the potential for another rate hike and reduced easing in 2024 than previously forecast, the FOMC sent a higher for longer message to bond markets at its September meeting. Upon witnessing the impact upon bonds, some of them seemed surprised and indicated that this was undesired tightening equivalent to a quarter-point policy rate hike. This is a chicken-and-egg problem. Bond markets took their cue from seemingly deliberate guidance from the Fed and so the FOMC shouldn’t be viewing this as unwarranted tightening. If they don’t deliver upon such guidance and withdraw from guidance to hike again, then bond markets may rally and then that may be viewed by some officials as premature easing.
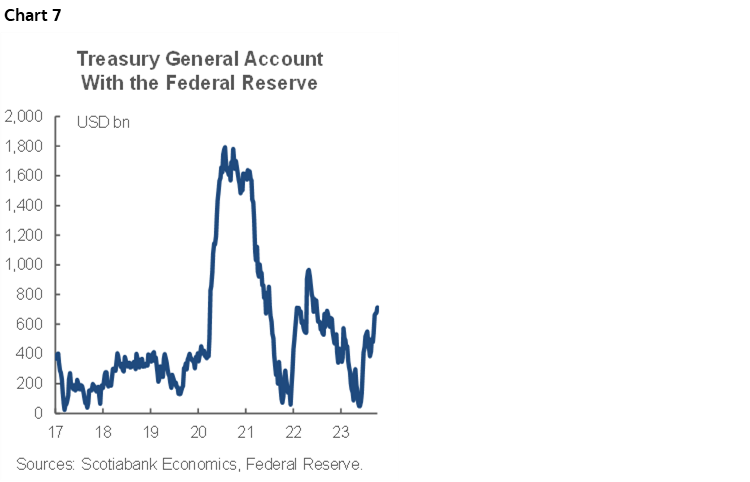
2. Secondly, it’s hoped that the Chair will acknowledge temporary forces driving higher bond yields. For one thing, we’re going through an issuance overshoot with bigger and more frequent auction sizes as the Treasury replenishes its cash being held at the Federal Reserve that was depleted by the debt ceiling fracas earlier this year. The cash account has been raised from a razor thin low near zero in early June to over US$700B now (chart 7). It may go higher yet especially with the threat of another government shutdown in dysfunctional Washington around mid-November, but eventually this replenishment argument will mature and with it a good portion of the supply pressures.
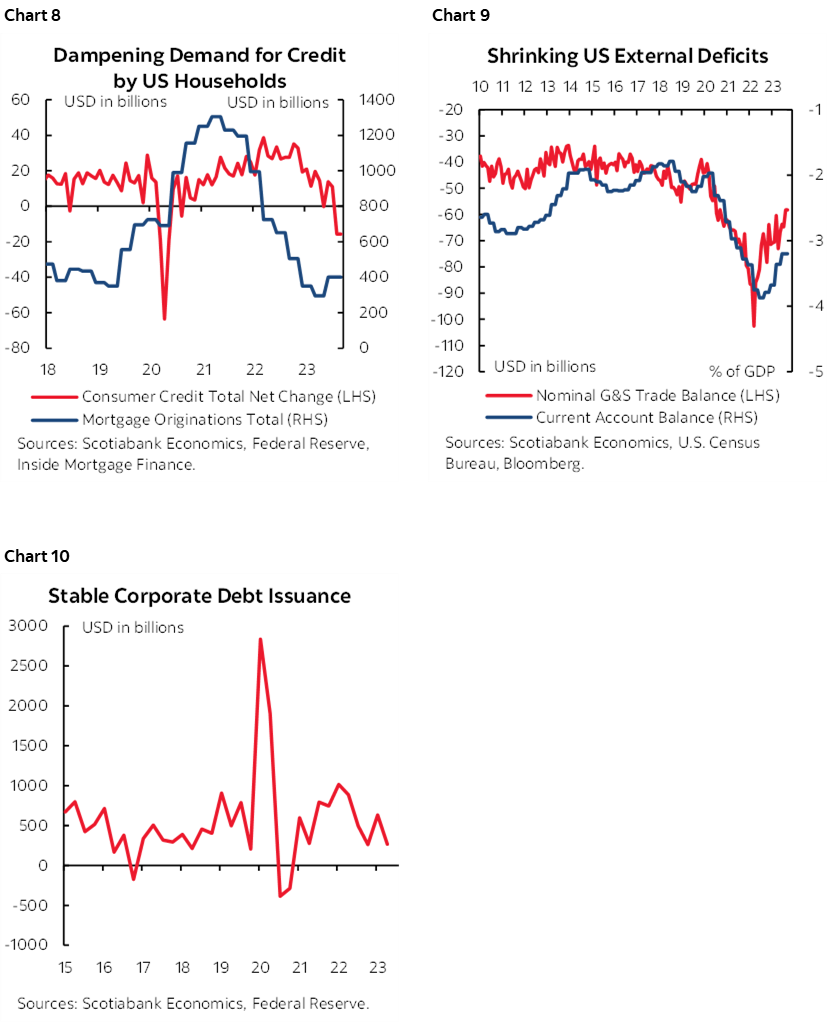
Third, I hope to hear Powell distance himself from bond land talk that higher yields are obviously being driven by higher fiscal deficits. It’s not that obvious as the effects of deficits on yields very much depends upon what else is going on in a more holistic perspective on credit markets. Household demand for credit is waning, creating less competition for savings provided domestically and externally (chart 8). The external picture indicates through balance of payments measures that the overall US economy is gradually lessening its demand for foreign savings as indicated by a shrinking current account deficit following the pandemic-induced blow-out and that this is in part being driven by smaller trade deficits (chart 9). Corporate issuance is largely trending sideways (chart 10). Too many financial analysts these days are being incorrectly trained to believe that fiscal deficits always drive higher yields when it’s anything but that simple, especially for a reserve currency country like the US.
For a fuller discussion on bond market drivers please see last week’s Global Week Ahead.
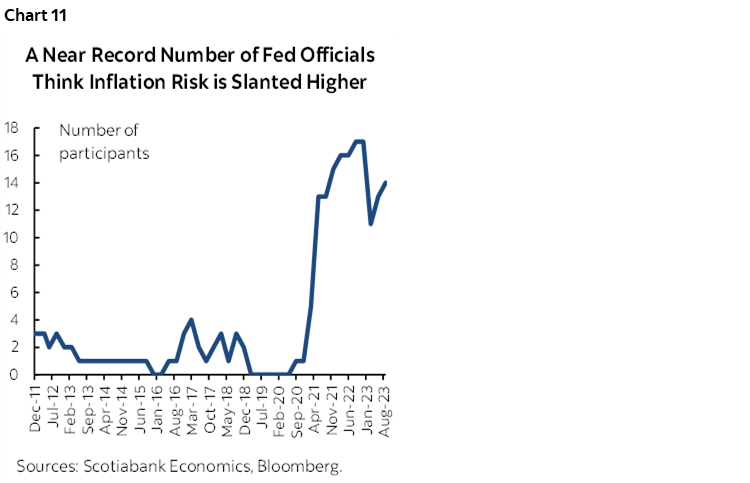
Powell is also likely to strike a cautious tone on inflation risk. Recall that a strong majority of FOMC members think that inflation risk remains pointed higher (chart 11). That was in September and hence before the recent oil spike. Among the upside risks to inflation are the following:
- WTI oil is up from about US$70 per barrel early in the summer to about $88 and the spillover effects through derivative products is likely to result in another wave of passthrough influences upon inflation readings.
- For another, small businesses are still in price hike mode. The NFIB’s measure shows that a net 30% of firms continue to plan price hikes over the coming three months. While well down from the peak of over 50% on net in late 2021 and early 2022, this is still above pre-pandemic norms that tended to be in the 15–20% range. Anecdotally it’s my belief that small businesses are generating much of the inflationary passthrough pressures with everyone exaggerating the role of inflation in driving their pricing decisions. Clearly the cost of winterizing a modest fishing boat has gone up by 170% in two years due to generalized inflation!!
- Third is that the economy has yet to open up any material excess capacity as GDP growth continues to smash expectations quarter after quarter. Today’s inflation is more complex than simple Phillips curves and output gaps can handle especially when applied out of sample, but the tight capacity constraints of the US economy don’t help. If forecasts for eventual weakening come true then we’ll see, but it would take a substantial and prolonged weakening to be disinflationary. This is the lag effect that hasn’t even started that no one talks about.
- Fourth is that the US is also not immune to the acceleration of unit labor costs throughout the pandemic. Productivity-adjusted employment costs have been rising at an accelerated rate since 2020 and probably pose pressure upon profit margins that will need to be made up in part by passing along costs where industries and companies are able to do so.
- Fifth is that the US household sector has the capacity to pay. Household finances are in the best shape in decades. Debt-to-income is at a 22 year low. Debt payments to income also continue to hover around record lows at least as defined by records prior to the temporary dip in financing costs in 2020–21. Cash balances outstanding remain high. The economy is at full employment and nominal wages are up by over 4% y/y which has stopped the decline in real wages.
- Sixth is that supply chains have healed in very uneven ways. Record low auto inventories and lean housing inventories continue to support pricing power for two of the largest items in household budgets. We’ll need to monitor discounting relative to seasonal norms as the peak US holiday shopping season beckons closer to US Thanksgiving.
- Seventh is that government spending continues to heap excess stimulus on the US economy.
PBOC—A Stronger Case to Hold
No street forecasters expect the People’s Bank of China to leave its key 1-year Medium-Term Lending Facility Rate unchanged at 2½% on Sunday evening at about 9:20pmET and hence into the Asian market open to start the week. If so, then that could pave the way toward leaving the 1- and 5-year Loan Prime Rates unchanged on Thursday evening (ET).
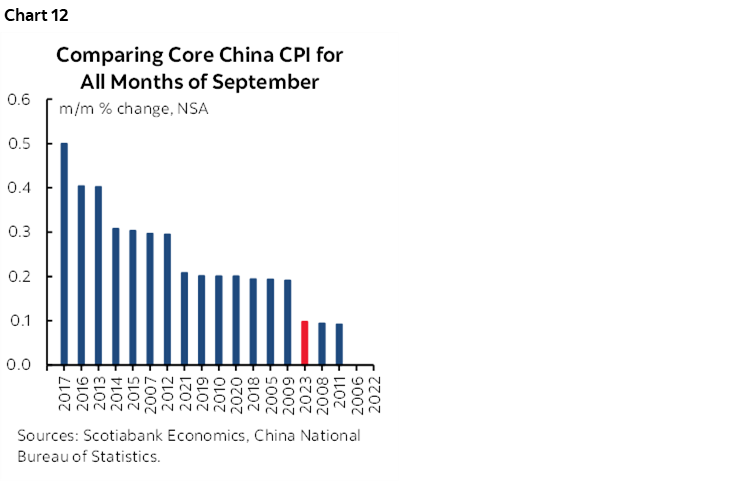
There is a tail risk in favour of a cut. A cut would fit the oscillating pattern of cuts and holds of late. It would also be supported by the persistent softness in core inflation (chart 12). China is not in deflation and it’s sensational headline grabbing to call it this. Textbook deflation is a sustained, broad, economy-wide decline in prices that comes to be expected and changes behaviour in ways that invite postponement of spending and investing plans into cheaper future environments. That doesn’t characterize China. Nevertheless, China is nowhere close to the 3% inflation target and therefore has room to ease.
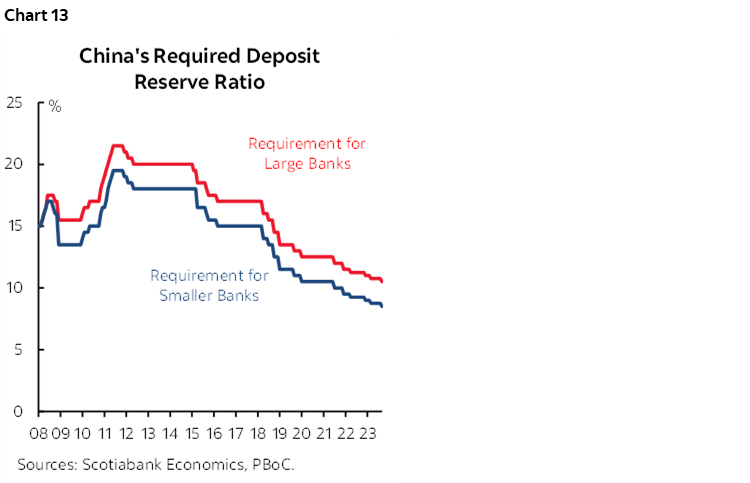
The dominant risk, however, lies in favour of a hold. For one thing, with the Fed back in play for a potential additional hike this year, a cut by the PBOC could drive renewed yuan weakness and concomitant financial instability. The currency has been reasonably stable of late, but spread divergence risks driving toward its weakest in 16+ years. For another, Chinese macroeconomic data has been showing somewhat more encouraging signs of late. Last, China is relying upon other easing measures like credit easing including cuts to reserve ratios designed to motivate easier lending terms (chart 13).
Bank Indonesia and Bank of Korea are both expected to extend their policy rate holds at 5.75% and 3.5% respectively on Thursday.
GLOBAL MACRO—AN ELECTION, EARNINGS AND TOP SHELF INDICATORS
A heavy week for earnings plus several top macro reports will make for an active calendar. China’s GDP figures, US retail sales, UK jobs and wages, rebound evidence in Canada, Australian jobs, the New Zealand election and CPI, and Peru’s GDP guidance are all on the docket.
Fifty-five S&P500 companies release earnings reports over the coming week as the earnings season intensifies. More financials will figure prominently and account for about half of the total number of releases, including names like BofA, Goldman, BoNYM, Morgan Stanley, State Street, Amex and several others. Netflix, AT&T, and Tesla are among the other names.
The United States calendar will be dominated by earnings but there will also be a few key macroeconomic indicators. At the top of the list is an expected rise in US retail sales during September (Tuesday). We know that vehicle sales volumes were up by over 4% m/m SA and that gasoline prices in CPI were up by 1.7% m/m SA. Combined, these two factors could lift retail sales by 0.7% in weighted terms. I’ve tempered that effect with an expected gain of 0.5% in total retail sales and 0.3% in sales ex-autos given uncertainties around the rest of the drivers. Also watch for what are likely to be soft industrial production (Tuesday), probably flat existing home sales (Thursday) and a rise in housing starts (Wednesday). Regional Fed manufacturing indices are due on Monday (Empire) and Thursday (Philly) that will inform ISM-manufacturing expectations.
Canada will also see a series of macroeconomic indicators that could support a rebound narrative from a summertime full of strikes, wildfires and bad weather. Monday will reveal improvements in manufacturing shipments and wholesale trade based upon preliminary guidance from Statistics Canada. Friday will do likewise for the retail sales figure for the same month of August. Housing starts are also due on Tuesday.
I’ll write more about them during the week, but for now, here’s a brief rundown of other key global reports:
- China reports Q3 GDP growth on Tuesday night (ET). Consensus expects a decent print of about 1% q/q SA nonannualized. September releases for industrial output, retail sales, the jobless rate and new home prices will inform hand-off momentum effects into Q4.
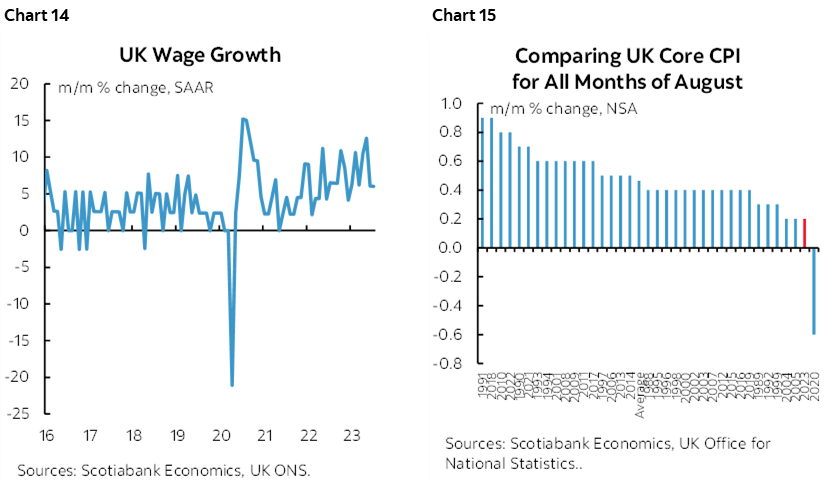
- The UK will update the status of its job markets on Tuesday. Payroll employment levels have fallen for the prior two months and so September’s update is expected to extend the softness. Total employment will be updated for August that same day along with wages that have been rising by over 8% y/y and with persistent higher frequency pressures (chart 14). The UK also updates CPI for September the next day with core expected to soften to a still hot 6% y/y reading with eyes on m/m pressures that have been softening (chart 15). Also watch Friday’s retail sales figures that are expected to reverse the prior month’s gain.
- Australia updates job growth for September on Wednesday night eastern time. The country’s job market has been on fire of late with 165k jobs created in the past four months. RBA minutes are due out on Monday.
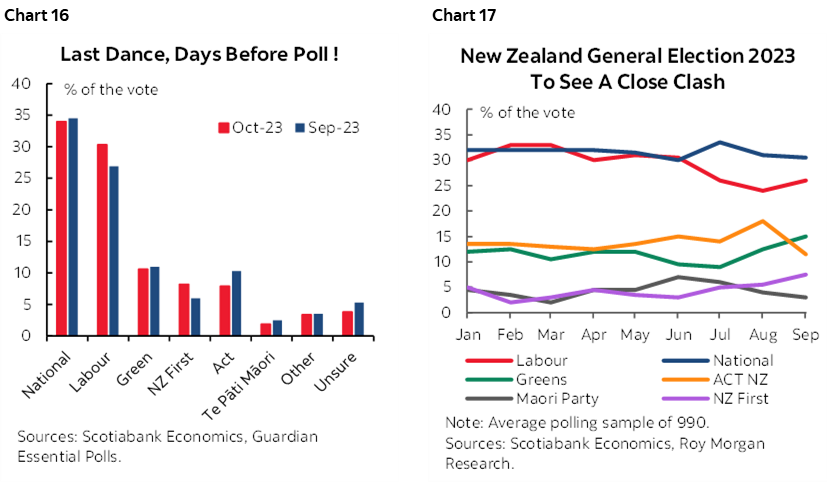
- New Zealand’s election will be held on Saturday and may impact the Monday market open. Polls suggest that the governing Labour Party faces defeat at the hands of the right leaning National Party (chart 16). Labour has, however, gained slight momentum of late (chart 17). A coalition arrangement that keeps Labour in power is possible. Q3 CPI hits on Monday and is expected to record a fairly hot reading of 1.9% q/q NSA that would make it one of the strongest third quarter unadjusted readings in recent times, rivalling the 2021 and 2022 increases.
- Peru’s economic activity index reading for August (Monday) will help to inform momentum in the economy after the prior month’s decline and weaker than expected inflation motivated another rate cut by the central bank.


DISCLAIMER
This report has been prepared by Scotiabank Economics as a resource for the clients of Scotiabank. Opinions, estimates and projections contained herein are our own as of the date hereof and are subject to change without notice. The information and opinions contained herein have been compiled or arrived at from sources believed reliable but no representation or warranty, express or implied, is made as to their accuracy or completeness. Neither Scotiabank nor any of its officers, directors, partners, employees or affiliates accepts any liability whatsoever for any direct or consequential loss arising from any use of this report or its contents.
These reports are provided to you for informational purposes only. This report is not, and is not constructed as, an offer to sell or solicitation of any offer to buy any financial instrument, nor shall this report be construed as an opinion as to whether you should enter into any swap or trading strategy involving a swap or any other transaction. The information contained in this report is not intended to be, and does not constitute, a recommendation of a swap or trading strategy involving a swap within the meaning of U.S. Commodity Futures Trading Commission Regulation 23.434 and Appendix A thereto. This material is not intended to be individually tailored to your needs or characteristics and should not be viewed as a “call to action” or suggestion that you enter into a swap or trading strategy involving a swap or any other transaction. Scotiabank may engage in transactions in a manner inconsistent with the views discussed this report and may have positions, or be in the process of acquiring or disposing of positions, referred to in this report.
Scotiabank, its affiliates and any of their respective officers, directors and employees may from time to time take positions in currencies, act as managers, co-managers or underwriters of a public offering or act as principals or agents, deal in, own or act as market makers or advisors, brokers or commercial and/or investment bankers in relation to securities or related derivatives. As a result of these actions, Scotiabank may receive remuneration. All Scotiabank products and services are subject to the terms of applicable agreements and local regulations. Officers, directors and employees of Scotiabank and its affiliates may serve as directors of corporations.
Any securities discussed in this report may not be suitable for all investors. Scotiabank recommends that investors independently evaluate any issuer and security discussed in this report, and consult with any advisors they deem necessary prior to making any investment.
This report and all information, opinions and conclusions contained in it are protected by copyright. This information may not be reproduced without the prior express written consent of Scotiabank.
™ Trademark of The Bank of Nova Scotia. Used under license, where applicable.
Scotiabank, together with “Global Banking and Markets”, is a marketing name for the global corporate and investment banking and capital markets businesses of The Bank of Nova Scotia and certain of its affiliates in the countries where they operate, including; Scotiabank Europe plc; Scotiabank (Ireland) Designated Activity Company; Scotiabank Inverlat S.A., Institución de Banca Múltiple, Grupo Financiero Scotiabank Inverlat, Scotia Inverlat Casa de Bolsa, S.A. de C.V., Grupo Financiero Scotiabank Inverlat, Scotia Inverlat Derivados S.A. de C.V. – all members of the Scotiabank group and authorized users of the Scotiabank mark. The Bank of Nova Scotia is incorporated in Canada with limited liability and is authorised and regulated by the Office of the Superintendent of Financial Institutions Canada. The Bank of Nova Scotia is authorized by the UK Prudential Regulation Authority and is subject to regulation by the UK Financial Conduct Authority and limited regulation by the UK Prudential Regulation Authority. Details about the extent of The Bank of Nova Scotia's regulation by the UK Prudential Regulation Authority are available from us on request. Scotiabank Europe plc is authorized by the UK Prudential Regulation Authority and regulated by the UK Financial Conduct Authority and the UK Prudential Regulation Authority.
Scotiabank Inverlat, S.A., Scotia Inverlat Casa de Bolsa, S.A. de C.V, Grupo Financiero Scotiabank Inverlat, and Scotia Inverlat Derivados, S.A. de C.V., are each authorized and regulated by the Mexican financial authorities.
Not all products and services are offered in all jurisdictions. Services described are available in jurisdictions where permitted by law.