Next Week's Risk Dashboard
- The Fed’s Jackson Hole Symposium
- US economic resilience
- No, US consumers have not depleted pandemic savings
- The bond market sell-off
- Global PMIs to inform growth momentum
- CBs: China LPRs, BI, BoK, Turkey
- Global macro
Chart of the Week
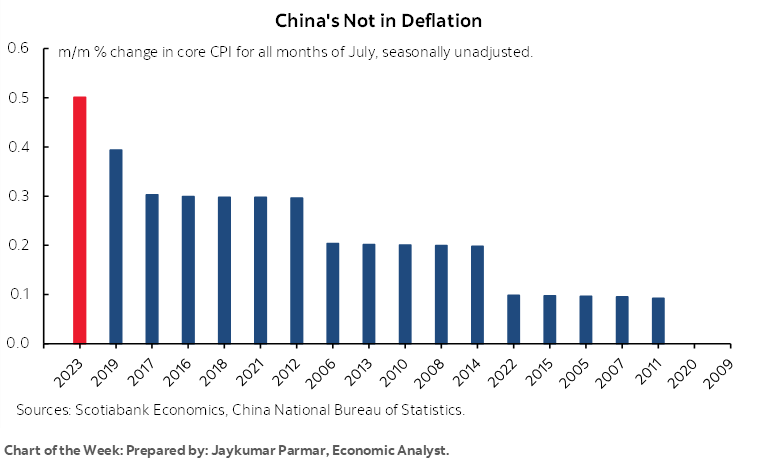
The jaggedy peaks of the Teton mountains in Wyoming may be a fitting backdrop for discussing what challenges may face global market participants at least over the remainder of this year. The Federal Reserve’s annual Jackson Hole gathering will bring together many of the world’s top central bankers to share their visions. Though impactful on its own, the annual gathering attracts outsized attention because of its late-August timing.
JACKSON HOLE—CONUNDRUMS GALORE
The Federal Reserve’s annual Jackson Hole symposium returns as the key event this week, not least of which because there won’t be much else on the docket!
Attendees start arriving in advance of the two-day gathering that occurs on Friday and Saturday. The usual agenda will be made available on Thursday night (8pm) and will spell out who is delivering keynotes and participating on panels. A broad cross-section of global central bankers, academics and others will be in attendance.
This year’s theme is “Structural Shifts in the Global Economy.” The clear hint is that they are asking what’s different about this rate hike cycle than prior ones that may make tighter monetary policy to date either more or less effective.
Watch for guidance in the financial press on who may be in attendance as it appears over the weekend and early in the week. Even if attendees do not wind up on the formal agenda, they may still have an impact through the multitude of interviews that are granted from the sidelines.
What could emerge from the unnecessary drama in the lead up to it all could easily be impactful comments by the heads of the ECB, BoE, BoJ, BoC, RBA and many others. For instance, if BoC Governor Macklem attends and actively participates then it could be impactful to market views ahead of the September 6th decision and the speech that he delivers the day after. Ditto for ECB President Lagarde given that markets are on the fence toward a further hike on September 14th. Each of the BoE and BoJ deliver decisions the week after the ECB.
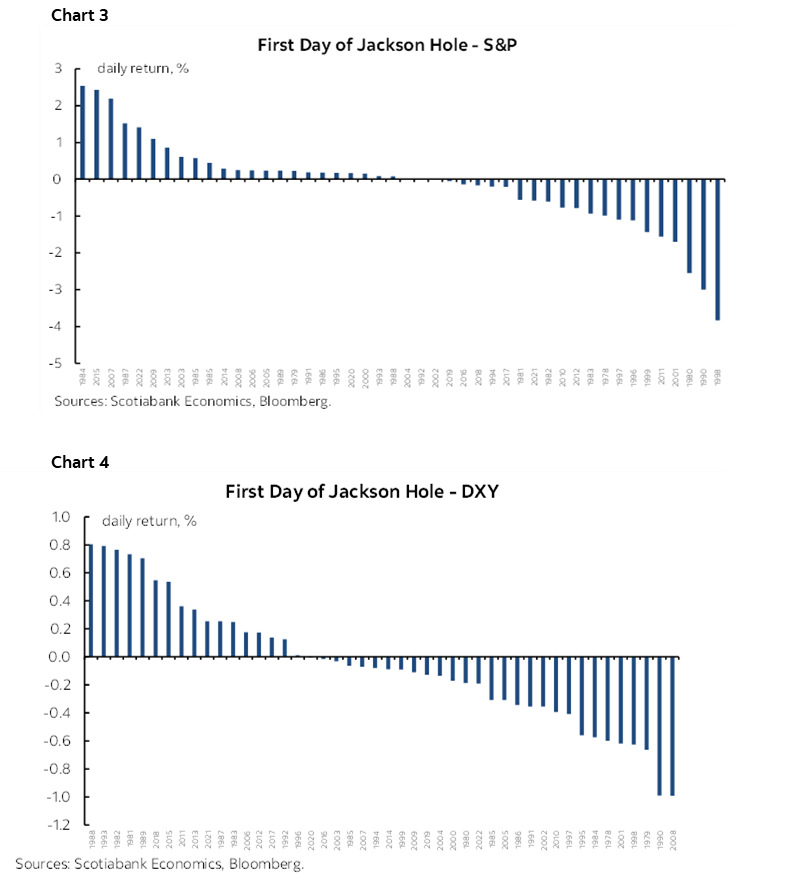
Chair Powell kicks off the event with an economic outlook speech on Friday at 10:05amET.
Charts 1–4 on the next two pages depict market reactions in US 2s, 10s, the S&P500 and the USD on a DXY basis for each of the first days of the gathering into Friday’s close over Thursday’s. Similar effects can be seen by looking at Monday’s close over Friday’s close in order to capture anything that is said over the weekend and spillover effects into the next week. Relatively few past symposiums have resulted in outsized moves, but market reactions to both days of the gathering are fairly common.
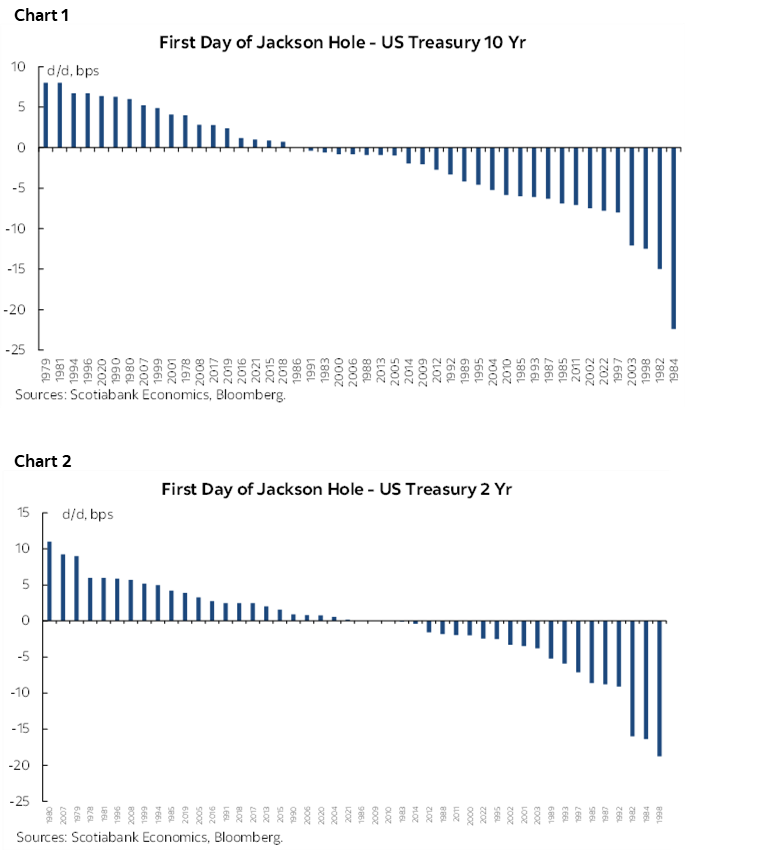
There may be market effects stemming from this one for Fed watchers, but seismic movements across asset classes are unlikely. I expect signs that the Federal Reserve is deeply struggling with whether they are operating in a fundamentally different environment now than historically and in such fashion as to prompt a generally hawkish feel to the gathering. After a majority of Committee members signalled in the FOMC minutes to the July meeting that further tightening was required, Chair Powell is likely to reinforce such a stance in data dependent fashion during his speech.
The range of topics that could be broached reaches far and wide. It includes—but is not limited to —topics like structural challenges in China’s economy, nascent developments across global supply chains, demographics, global fiscal policy, technological shifts perhaps including the potential role of generative AI, today’s bond market drivers, the state of US consumers, and what’s different about today’s inflation among others.
Key to Fed watchers will be any discussion around what has fundamentally changed in the US economy including the role of the consumer, whether that has impacted estimates of the neutral policy rate, and whether today’s bond market is driven by very different considerations.
The US Growth Conundrum
To help set the stage, I think that Powell will no doubt have something akin to chart 5 on his mind. The economist consensus has been repeatedly too negative on the US economy for five consecutive quarters and counting. A serial pattern has evolved whereby the forecasts start off too negative and then get revised higher and still wind up being surprised higher when the actual number lands. The forecast errors are often large and of the wrong sign.

This strikes to the heart of the dilemma facing the FOMC. The economy has been much more resilient to date than almost anyone anticipated.
At issue is whether this is a sign of how the US economy is better able to withstand tighter monetary policy than previous rules of thumb might have suggested—and hence whether tighter policy is needed—or whether the consensus was just behaving too prematurely and has not given enough time for the policy lags to take root. Since bond yields started to back up in the Fall of 2021 in anticipation of Fed hikes that began in March 2022, we’re now almost two years into an environment of tighter funding pressures which should arguably be having a greater effect.
The US Consumer
One possible candidate for this resilience lies right at home. The US consumer is arguably in the best shape in decades.
While the flow of excess savings compared to the pandemic has been normalized (here), the stock of liquid cash and near-cash holdings remains very high (chart 6). It’s incorrect to argue that consumers have depleted their stock of excess liquid savings just because they have done so by unwinding the abnormally large flow of savings that was occurring earlier in the pandemic-era. Stockpiled stimulus partly reflects a precautionary bias but some of this enormous wall of cash could be readily deployed through consumption and into markets.
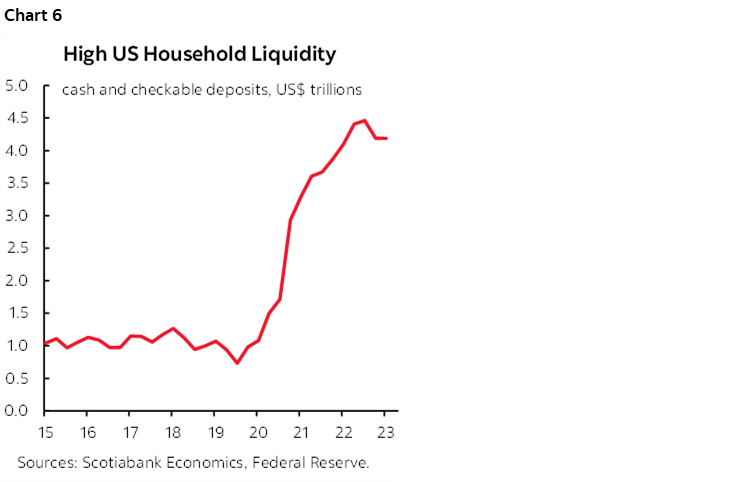
Further, the measure of savings used in the linked paper is derived solely out of current period income from sources like wages and salaries, net investment income and net transfers from governments. It does not capture buoyant wealth effects on consumption reflected in the increase in household net worth.
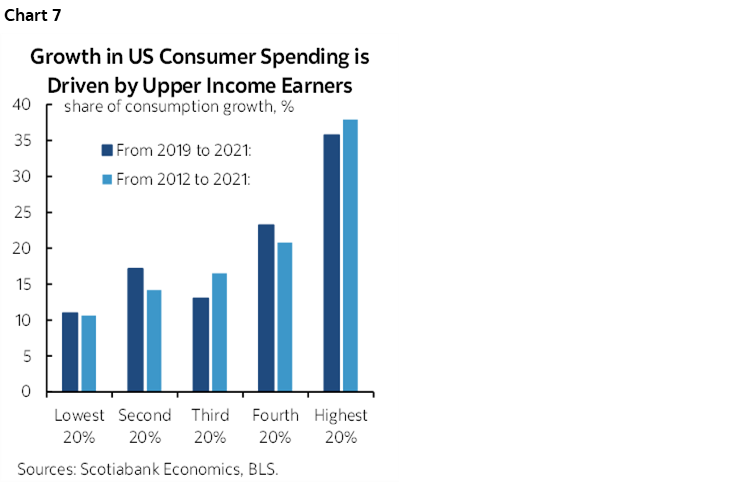
While lower income households have fared the worst in terms of the regressive aspect of high and volatile inflation and pressures upon home affordability, the vast majority of growth in US consumer spending is being driven by upper income households over time (chart 7).
Add to this picture a 22-year low in the household debt to income ratio, debt payments to incomes that continue to hover near record-lows (chart 8), the very recent return of growth in real wages, low housing and auto inventories, and the fact that Americans have locked in very low 30-year mortgage rates from the depths during the pandemic for years to come.

It could also be that today’s labour market is behaving very differently compared to the past and in a way that is more supportive. An older population in a country with less openness toward immigration means tighter labour markets for longer. Weaker trend productivity growth than in the past may require hiring more workers today than the past. Improving supply chains give the ability to companies to produce more and to producer more they need more inputs. The cyclical choices over what type of inputs may be relatively more skewed toward labour over capital than historically given economic uncertainty and the risk of being saddled with high depreciation and financing charges that could reduce flexibility should conditions worsen.
The Neutral Rate
There is some speculation that the neutral rate will be reassessed at this year’s symposium. I’d be surprised if they do so. They had an opportunity to do so back on May 19th at a conference to honour the late Fed economist Thomas Laubach who did a lot of pioneering work in this area but passed. In fact, NY Fed President John Williams who worked with Laubach on natural rates argued at the time that there was no reason to believe that the estimate has changed today. It’s still 2½%, he says.
Then again, we saw what happened at the Bank of Canada. No sooner had it issued a staff paper saying that the estimated neutral rate range was still 2–3% than outgoing Deputy Governor Beaudry that there was “meaningful risk” that the estimated real neutral rate could rise.
Bond Markets
We forecast the US yield curve by quarter and the forecast was performing reasonably well over the first half of calendar 2023. As Q2 transitioned to Q3, however, the 10-year Treasury has cheapened more than anticipated relative to our end of Q3 forecast for 3.65% versus the current US 10-year yield of 4.25%. Yields took off over recent weeks and we’re debating whether to durably raise our forecast and by how much. Many market participants are faced with a similar challenge.
Key is discussion toward what has changed as materially new information has arrived. Here’s a partial list.
On July 27th, the Bank of Japan surprised markets when it shifted from a 10-year JGB yield target range of 0% +/-50bps to greater tolerance toward allowing a higher effective limit. The Nikkei newspaper had indicated the possibility the day before and markets had been speculating toward some form of tweak beforehand.
The effects rippled through global bond markets and contributed toward a sell off in US Treasuries. Covered interest parity can help to explain the ripple effects through global bond markets. There is a higher error term on this framework of equating the spot-forward exchange rate differential between countries to their interest rate differentials, but it would be silly to argue that individual bond markets are fully compartmentalized from one another. This error term may be due to intensified regulatory restrictions on the ability of banks to deploy the duration structure of their enormous balance sheets toward arbitrage activity
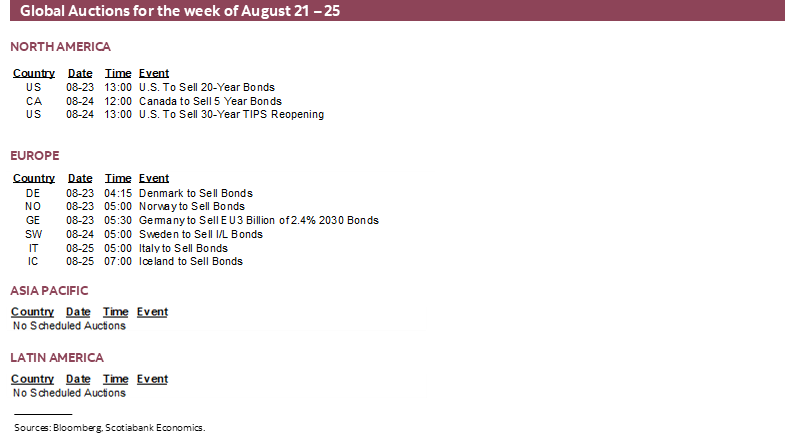
On August 2nd, the US Treasury’s refunding debt sales schedule was revised up by more than anticipated. This added supply was the first increase in quarterly refunding amounts in about two years. Treasury guidance pointed toward increased auction sizes from August through October and guided that there was more to come:
“Based on projected intermediate- to long-term borrowing needs, Treasury intends to gradually increase coupon auction sizes beginning with the August to October 2023 quarter. While these changes will make substantial progress towards aligning auction sizes with intermediate- to long-term borrowing needs, further gradual increases will likely be necessary in future quarters.”
FitchRatings wasted no time in downgrading the US government’s credit rating from AAA to AA+ later than same day (here).
What has not changed are estimates by the NY Fed’s economists for the US 10-year term premium that continues to trend around -50bps (chart 9). If neutral rate estimates have not changed, then the combination of these effects serve as anchors to the term structure of interest rates over time.

Further, talk of a soft or no landing in the US economy has become more common, rightly or not, as the US economy has continued to outperform expectations. If this persists, then it positively impacts the embedded assumption on long-run real economic growth in the bond market.
Inflation risk may have also pivoted higher. Firm wage pressures and increases in some key commodity prices like oil have been among the factors that have contributed to the sense that inflation may rise into the winter. The Fed’s preferred market measure of longer run inflation expectations is volatile but has moved up somewhat.
All that said, it’s feasible that the sell off across US Treasuries has made them more attractive at present yields. Wild positioning swings through thin August markets with half of New York in the Hamptons should be treated carefully. So should classic Fall volatility in risk appetite.
What forecasts are assuming is still leaning toward is that some pain eventually arrives in the US economy and brings with it weakened activity readings that could dampen some of the recent run up in yields.
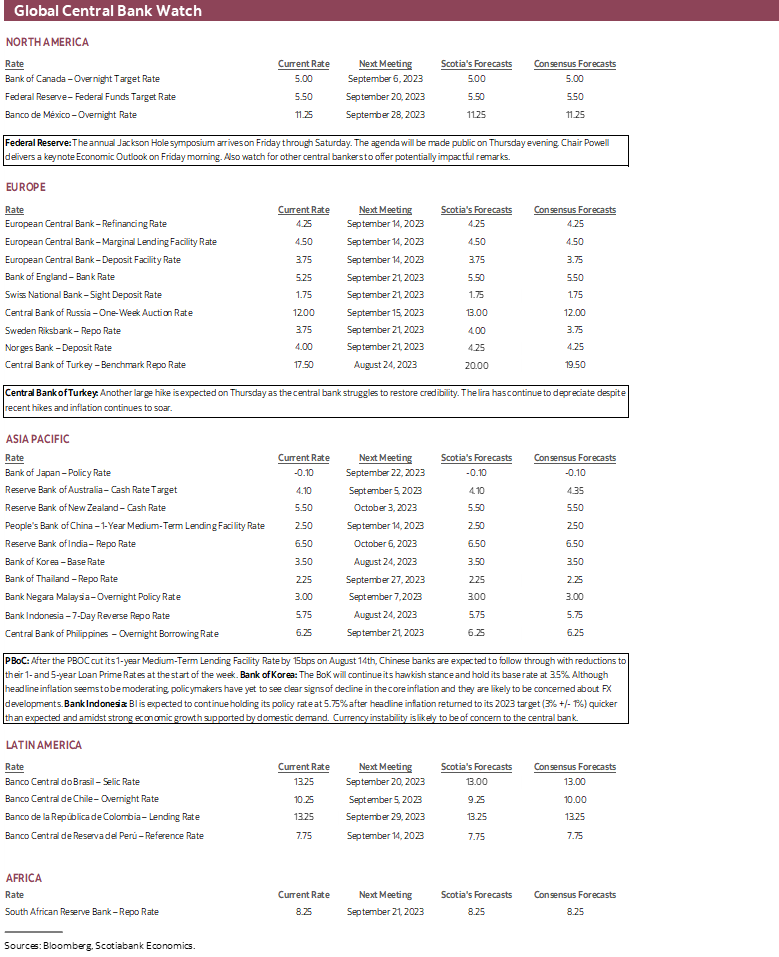
CENTRAL BANKS—A PAIR OF HOLDS AND A FAILING EXPERIMENT
Very few central banks will deliver decisions over the coming week. The greater risk may lie around what some of them say at Jackson Hole.
The ones that do deliver decisions will each do so on Thursday. They will follow likely increases in China’s 1- and 5-year Loan Prime Rates on Sunday evening (ET) that follow through on the PBOC’s 15bps increased in the 1-Year Medium-Term Lending Facility Rate on August 14th.
Bank of Korea—Another Hold
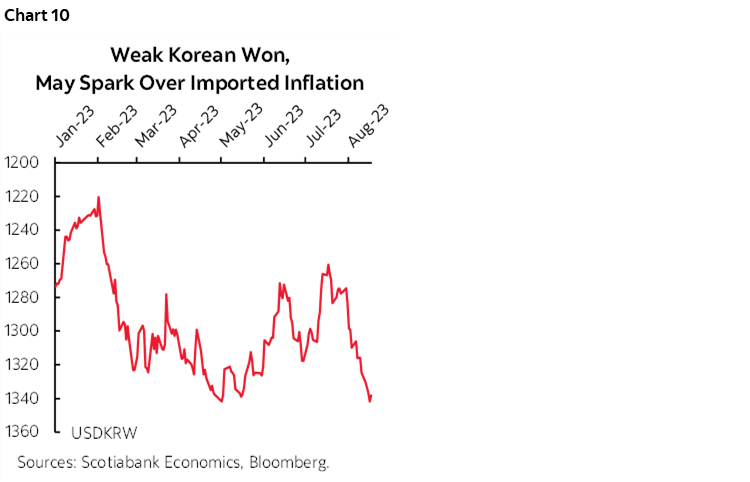
The Bank Rate is expected to be left at 3.5% again which is where it has been parked since February. Since its last decision on July 12th, Q2 GDP slightly outperformed (0.6% q/q SA nonannualized, 0.5% consensus) and July’s core CPI inflation rate put in a slightly weaker than seasonally normal reading. What is nevertheless likely to carry the day on a hawkish hold is fear of destabilizing the currency and financial markets. The won has depreciated by about 6% to the USD since mid-July and has therefore put in the weakest performance among Asian crosses over this period and more generally (chart 10). Further softening would spark concern over imported inflation in addition to stability.
Bank Indonesia—Currency Concerns to Dominate
The 7-day reverse repo rate is unanimously expected to be left unchanged at 5.75% on Thursday. Like the BoK, that’s been where it has stood since February. Somewhat like the BoK, the rupiah has depreciated by about 2% since the last BI decision on July 25th, and 4% to the USD since early May. Amid uncertainty toward next steps by the Federal Reserve, BI won’t do anything that would add to the risk of destabilizing the currency.
Turkey—Try Harder
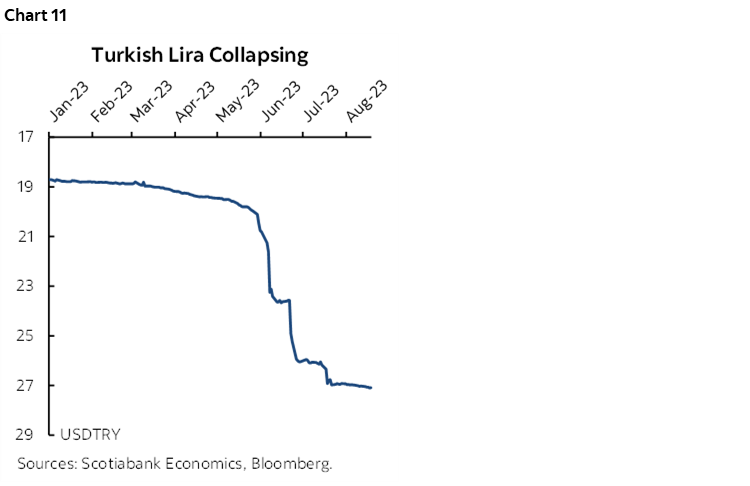
Turkey’s central bank is seeking to improve its credibility after President Erdogan destroyed it. It’s not going so well. The central bank has hiked its one-week repo rate by nine percentage points to 17.5% since June 22nd and a further large hike is expected this week. The lira has depreciated by a further 15% since the first hike in June and it now takes more than three times as many lira to buy US$1 than it did back when the currency’s freefall began in late 2021. Part of the issue is that the last two hikes were smaller than consensus expected and that inflation has continued to soar as the currency has collapsed (chart 11). CPI for July was up by a whopping 48% y/y (38% prior) and about 10% m/m. You can’t toy with a central bank while demonstrating zero knowledge of how monetary policy works and expect credibility to be restored overnight as the real master continues to lurk in the background.
GLOBAL MACRO—PMIS IN FOCUS
The global calendar line-up of economic indicator releases will be light this week and principally focused upon soft survey-based data.
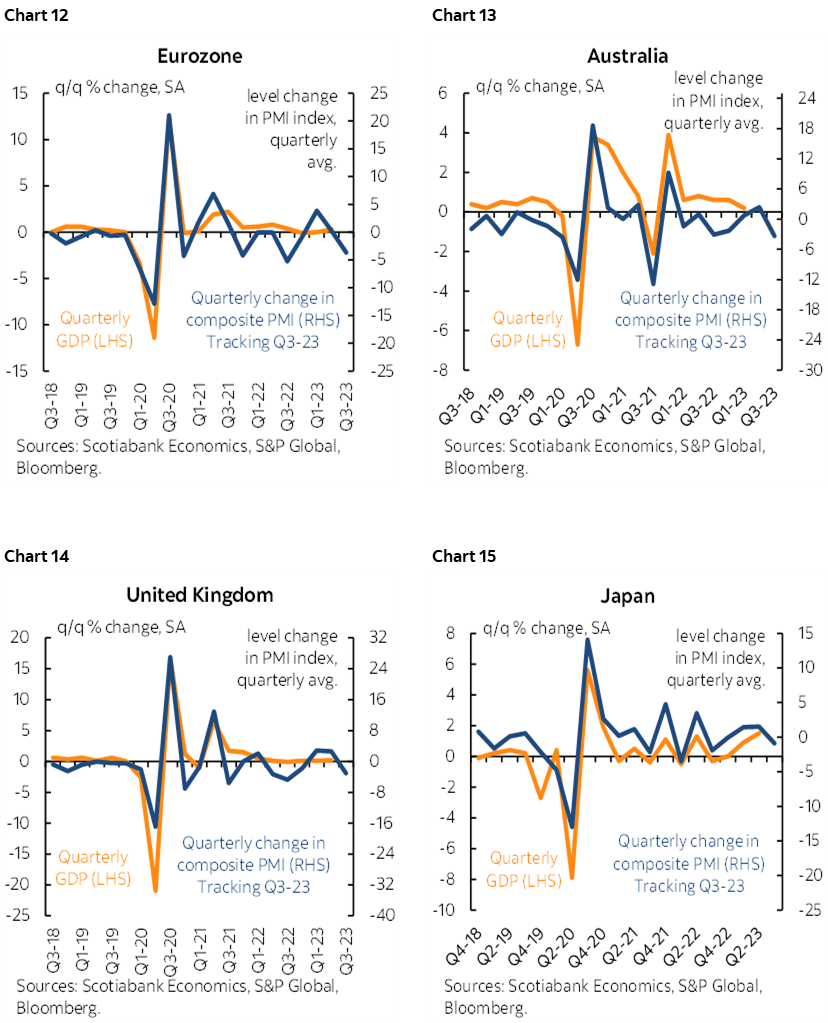
Purchasing managers’ indices will be updated by Australia and Japan (Tuesday), the Eurozone and member economies (Wednesday) and UK (Wednesday). These readings tend to be correlated with in-quarter estimates of GDP growth (charts 12–15). They also inform supply chain developments through readings on new orders, production, and order backlogs alongside measures of price pressures and hiring appetite. Also note that German IFO business confidence will be updated on Friday and also fits into the same survey-based collection of evidence that includes PMIs and ZEW investor confidence to inform growth tracking.
Canada had previously guided back on July 21st that June was looking unchanged in terms of the dollar value of total retail sales that month compared to May. There is always high revision risk to this tentative estimate—in either direction—because it is based upon incomplete survey responses. This time, Statistics Canada based the preliminary estimate upon about a 48% response rate. So far, retail sales volumes are tracking a drop of about -2% q/q at a seasonally adjusted and annualized rate in Q2 after a large 5.4% gain in Q1, subject to the final June estimate and any revisions.
US updates will be fairly light and thereby enable much of the week’s focus to remain upon Jackson Hole.
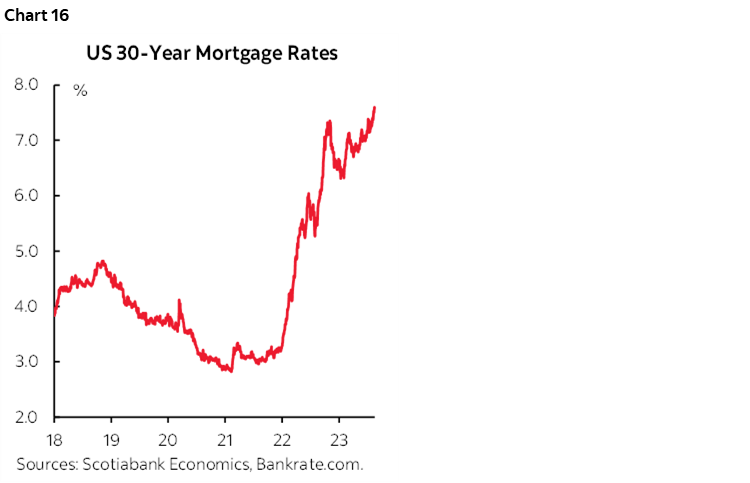
Existing home sales (Tuesday) are expected to be unchanged compared to June’s 4.2 million annualized pace and hence in keeping with the advance pending home sales trend. They are lagging indicators of housing demand that surging 30-year mortgage rates will probably soon dampen if sustained (chart 16).
New home sales (Wednesday) are expected to rise in keeping with a pick-up in model home foot traffic. They are less of a lagging indicator than resales since the closing periods following contract signings can stretch into months for resales.
Durable goods orders during July (Thursday) probably fell mainly due to the volatile transportation sector, such as the fact that Boeing’s orders fell back from 304 plans in June to 52 in July. Watch core capital goods orders (ex-defence and air) that will aim for the fourth consecutive monthly gain and fifth in seven months this year.
S&P’s purchasing managers indices for August (Wednesday) will further inform momentum in the manufacturing and service sectors. Manufacturing has been in contraction according to this measure, but manufacturing output has been swinging from losses to gains and posted an increase in July. The Federal Reserve focuses more upon the ISM gauges that reflect domestic economic activity.
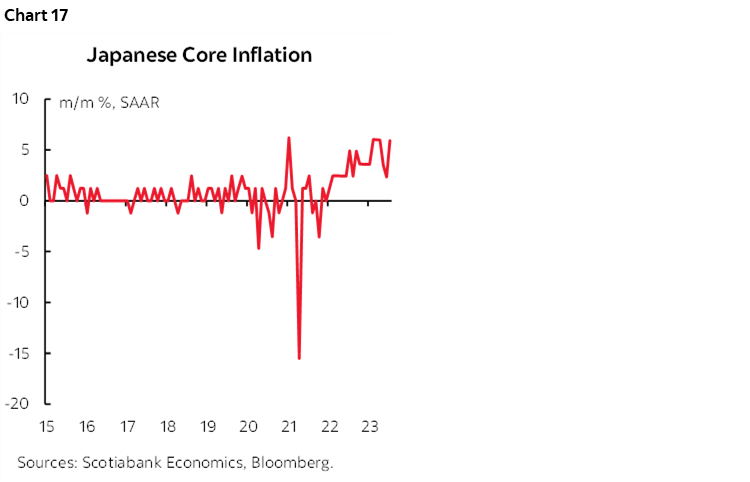
Japan will update the Tokyo CPI gauge for August on Thursday after the national core CPI print came in hot again during July (chart 17). Inflation reports for July will be released by Hong Kong (Monday), Mexico (bi-weekly, Thursday) and Malaysia (Friday)
New Zealand’s retail sales are expected to slip when the Q2 reading arrives Tuesday. Norway’s Q2 GDP figures will seek to extend the eight-quarter streak of consecutive gains on Tuesday. Peru’s economy may have stabilized in quarter-over-quarter terms during Q2 after a contraction of over 1% in Q1 (Wednesday).

DISCLAIMER
This report has been prepared by Scotiabank Economics as a resource for the clients of Scotiabank. Opinions, estimates and projections contained herein are our own as of the date hereof and are subject to change without notice. The information and opinions contained herein have been compiled or arrived at from sources believed reliable but no representation or warranty, express or implied, is made as to their accuracy or completeness. Neither Scotiabank nor any of its officers, directors, partners, employees or affiliates accepts any liability whatsoever for any direct or consequential loss arising from any use of this report or its contents.
These reports are provided to you for informational purposes only. This report is not, and is not constructed as, an offer to sell or solicitation of any offer to buy any financial instrument, nor shall this report be construed as an opinion as to whether you should enter into any swap or trading strategy involving a swap or any other transaction. The information contained in this report is not intended to be, and does not constitute, a recommendation of a swap or trading strategy involving a swap within the meaning of U.S. Commodity Futures Trading Commission Regulation 23.434 and Appendix A thereto. This material is not intended to be individually tailored to your needs or characteristics and should not be viewed as a “call to action” or suggestion that you enter into a swap or trading strategy involving a swap or any other transaction. Scotiabank may engage in transactions in a manner inconsistent with the views discussed this report and may have positions, or be in the process of acquiring or disposing of positions, referred to in this report.
Scotiabank, its affiliates and any of their respective officers, directors and employees may from time to time take positions in currencies, act as managers, co-managers or underwriters of a public offering or act as principals or agents, deal in, own or act as market makers or advisors, brokers or commercial and/or investment bankers in relation to securities or related derivatives. As a result of these actions, Scotiabank may receive remuneration. All Scotiabank products and services are subject to the terms of applicable agreements and local regulations. Officers, directors and employees of Scotiabank and its affiliates may serve as directors of corporations.
Any securities discussed in this report may not be suitable for all investors. Scotiabank recommends that investors independently evaluate any issuer and security discussed in this report, and consult with any advisors they deem necessary prior to making any investment.
This report and all information, opinions and conclusions contained in it are protected by copyright. This information may not be reproduced without the prior express written consent of Scotiabank.
™ Trademark of The Bank of Nova Scotia. Used under license, where applicable.
Scotiabank, together with “Global Banking and Markets”, is a marketing name for the global corporate and investment banking and capital markets businesses of The Bank of Nova Scotia and certain of its affiliates in the countries where they operate, including; Scotiabank Europe plc; Scotiabank (Ireland) Designated Activity Company; Scotiabank Inverlat S.A., Institución de Banca Múltiple, Grupo Financiero Scotiabank Inverlat, Scotia Inverlat Casa de Bolsa, S.A. de C.V., Grupo Financiero Scotiabank Inverlat, Scotia Inverlat Derivados S.A. de C.V. – all members of the Scotiabank group and authorized users of the Scotiabank mark. The Bank of Nova Scotia is incorporated in Canada with limited liability and is authorised and regulated by the Office of the Superintendent of Financial Institutions Canada. The Bank of Nova Scotia is authorized by the UK Prudential Regulation Authority and is subject to regulation by the UK Financial Conduct Authority and limited regulation by the UK Prudential Regulation Authority. Details about the extent of The Bank of Nova Scotia's regulation by the UK Prudential Regulation Authority are available from us on request. Scotiabank Europe plc is authorized by the UK Prudential Regulation Authority and regulated by the UK Financial Conduct Authority and the UK Prudential Regulation Authority.
Scotiabank Inverlat, S.A., Scotia Inverlat Casa de Bolsa, S.A. de C.V, Grupo Financiero Scotiabank Inverlat, and Scotia Inverlat Derivados, S.A. de C.V., are each authorized and regulated by the Mexican financial authorities.
Not all products and services are offered in all jurisdictions. Services described are available in jurisdictions where permitted by law.