Next Week's Risk Dashboard
• FOMC minutes to set the speed limits
• Canada week starts with high inflation expectations…
• …then an expansionist Federal budget…
• …and a further tightening of labour markets
• Peru’s central bank to hike on inflation pressures
• RBA under rising pressure to hike soon
• RBI’s inflation-growth challenge
• Inflation: LatAm and Asian updates
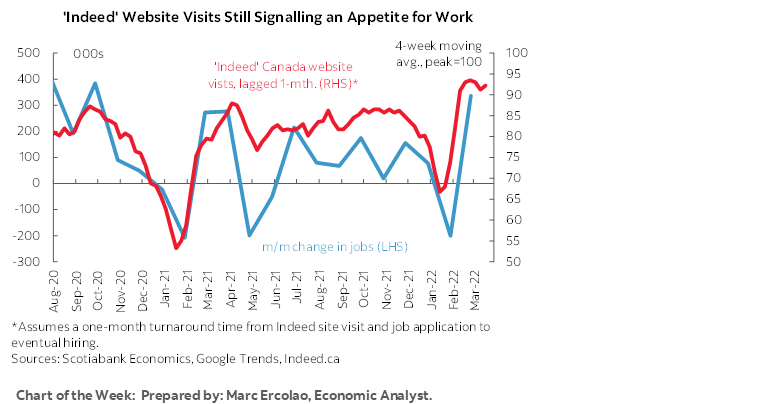
Chart of the Week
April will start off feeling like Canada Day has come early. A trio of significant developments will showcase how market and policy developments are playing competing roles. Jobs data plus survey-based measures that are prized by the Bank of Canada will probably showcase the role of wage and price pressures in motivating the Bank of Canada to tighten monetary policy, while the Federal Government introduces a multi-year plan that is expected to involve spending its revenue windfalls including seigniorage revenues.
To global markets, however, the most important development is likely to be further revelations of what FOMC officials discussed at their important meeting three weeks prior.
FOMC MINUTES—SETTING THE SPEED LIMITS
“There will be a more detailed discussion in the minutes in three weeks.”
Federal Reserve Chair Jerome Powell
March 16th, 2022
Three weeks have passed, and so we now face the music when the minutes to the FOMC meeting that was held on March 15th –16th arrive on Wednesday at 2pmET. Powell was referencing the discussion held at this meeting on balance sheet plans. He noted “We made excellent progress on a plan. We are in a position to finalize and implement that plan as soon as our next meeting in May. The framework will look familiar to people who saw this the last time, but it will be much faster and is coming sooner in the cycle.”
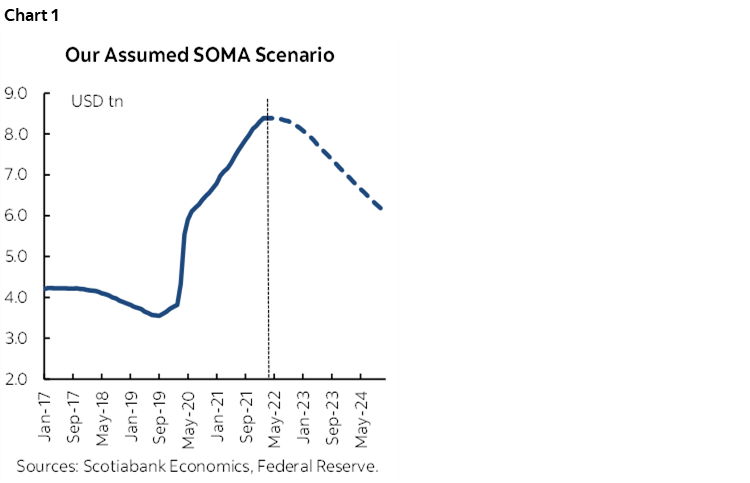
He’s referencing plans to begin unwinding the Fed’s massive US$8.4 trillion portfolio consisting of Treasuries (US$4.9T), mortgage-backed securities (US$2.7T), inflation bonds (US$388B) and bills (US$326B). We forecast the Fed to pursue a much faster pace of unwinding of this portfolio than was the case the last time they went down this path primarily over 2018–19 (chart 1). Then again, the starting point for the SOMA portfolio today is about twice as large as it was when the Fed last embarked upon a path of reducing it and so perhaps the pace of rundown should be much faster. Altered circumstances merit as much including the transitory peak effects of the pandemic and the very different nature of this shock compared to, say, the GFC or the rolling shocks through the last decade including the European debt crisis.
Watch for guideposts if not explicit measures of the size of roll-off caps the committee may be seeking this time, defined as the share of maturing securities it has purchased that it may be willing to retire versus being reinvested. Also watch for potential dialogue around what members think may be the ultimate target for the size of the balance sheet whether expressed directly or more subtly in terms of pace and duration of roll-off caps. How many members advocate getting started in May versus later may also be revealed. The FOMC would signal all such intentions through use of its frequency of citations language in the minutes that convey plurality of opinion (none, one, a couple, a few, some, several, many, most, generally agreed, all but one, all, etc. etc).
It’s possible we’ll see further dialogue across committee members on the rate equivalence of shrinking the balance sheet. In his March press conference, Powell said that the pace of balance sheet run-off they have in mind is roughly equivalent to another 25bps rate increase on top of the 175bps of hikes in the fed funds target rate range that the committee projected for this year and that some may now feel should be greater. If that’s true, then the rate-equivalence estimate may be lower than the Fed’s prior estimates. In former Chair Yellen’s speech in early 2017 (here), research from Fed economists was drawn upon to suggest that the unwinding of the SOMA portfolio at a slower pace than currently planned
“…could increase the yield on the 10-year Treasury note by about 15 basic points, all else being equal. Based on the estimated co-movement of short-term and long-term interest rates, such a change in longer-term yields would be similar to that which, on average, has historically accompanied two 25 basis point hikes in the federal funds rate.”
I would like to see a bit more meat on the bone in terms of updated Fed estimates of this rate equivalence and a greater dialogue among committee members. That may not be revealed in the minutes, but if the pace of roll-off being sought today is bigger than the prior episode then did Powell’s remark perhaps short-change the estimated impact upon longer-term yields this time? After all, the Fed in combination with other major central banks have destroyed term premia (chart 2). If that’s the case, then perhaps a rapid pace of unwinding the SOMA portfolio may steepen the curve relatively more than at present.

The communications that were provided on March 16th and Chair Powell’s subsequent remarks the following week on March 21st may be further embellished on a number of other counts as well. Powell said on the 21st that if “we need to tighten beyond common measures of neutral and into a more restrictive stance, we will do that as well” and so watch references to committee beliefs around the terminal rate this cycle that may further inform the FOMC’s forecast for a terminal rate overshoot in 2023.
As an aside, I’m a big believer that the Fed should rapidly exit its QE program in a strong QT phase. As financial economists we have a job to do in formulating expectations for central bank policy shifts and the potential implications to our clients. That motive is paramount in service to our clients. However, while I don’t write about it as often now as at times in the past, I’m even more of the belief that central banks have become too reliant upon QE tools relative to the disturbances they may be causing.
QE in my opinion has gone from something best used during truly exigent circumstances such as a harsh liquidity shock or existential threat to the financial system, toward something that has become habit-forming and held onto for excessively long periods of time. What central banks did at the start of the pandemic was appropriate when there were fears of deflation and depression and the correct focus was to throw everything they—and fiscal policymakers—had at the threat until science and behaviour could take over. For that they deserve enormous credit.
Nevertheless, central banks have introduced massive distortions as a consequence to having held onto unwavering QE programs for very long periods of time well past heightened points of crisis. Just under half of the eligible stock of EGBs, JGBs, gilts and Canadas, just under one-third of US Treasuries and about 35%+ of Aussie and kiwi bonds have been taken off-market and idly parked on central bank balance sheets in the passive hands of individuals neither mandated, skilled nor experienced in managing such complex portfolios. Central banks have become the world’s biggest asset managers. Some, like the RBNZ and BoC and even the BoE saw fit to expedite their exits from such programs earlier than others such as the Fed which is catching up and the ECB that has barely tiptoed in such a direction.
As a consequence, crushing term premia has destroyed reward for taking duration risk. The induced scarcity of bonds available on the market raised prices and lowered yields which was the purpose of such programs. It superimposed central bank judgement on what the cost of capital should be over private market forces in an abrupt shock but not necessarily when stability returns. This has lessened the focus of substantial numbers of bond investors to merely seeking to maximize yield. Plug your nose, follow mandates set by investment committees and boards, ignore rating agencies and sundry forms of risk and get yield wherever you can possibly get it and in ways that may court unknowable longer-run risks.
In doing so, however, QE programs drove asset price inflation including housing affordability challenges. They lessened the capital cost pressures upon businesses to invest and innovate and hence seek productivity enhancements that benefit longer-run standards of living. They interfere with private market mechanisms to channel credit to its optimal uses. Lowering the cost of funding and flooding the world with liquidity is among the drivers of inflation. Raising asset multiples through artificial means may have lessened discipline to do so through business plans and taking risks. QE programs may have flattened yield curves so much that they perversely raise economic uncertainty and damage longer-run investment horizons because fear of curve inversion raises recession risk, albeit often exaggerated. In turn, this can interfere with confidence toward using the traditional policy rate as the primary policy tool. They may be contributors to weakened fiscal policy discipline as seigniorage revenues through the inflation tax combine with a deeply negative real cost of borrowing to feed increases in permanent program spending, an enlarged role for government in the economy (when there is always a good case to spend more…) and all at the potential expense of fiscal guideposts and longer-run structural deficits.
CANADIAN INFLATION EXPECTATIONS
The first glimpse at how the war in Ukraine is impacting mainstreet’s inflation fears will arrive on Monday. That’s when the Bank of Canada will release its latest twin quarterly editions of the Business Outlook Survey and the Survey of Consumer Expectations.
The surveys will be a somewhat stale reflection of the full extent of recent developments but should add to important evidence on the one thing that matters most to monetary policy these days: inflation expectations. The surveys will have been conducted roughly between mid-February and early March. The earliest responses would have pre-dated Russia’s invasion of Ukraine on February 24th and the latest responses would have been shared before oil prices peaked around March 8th.
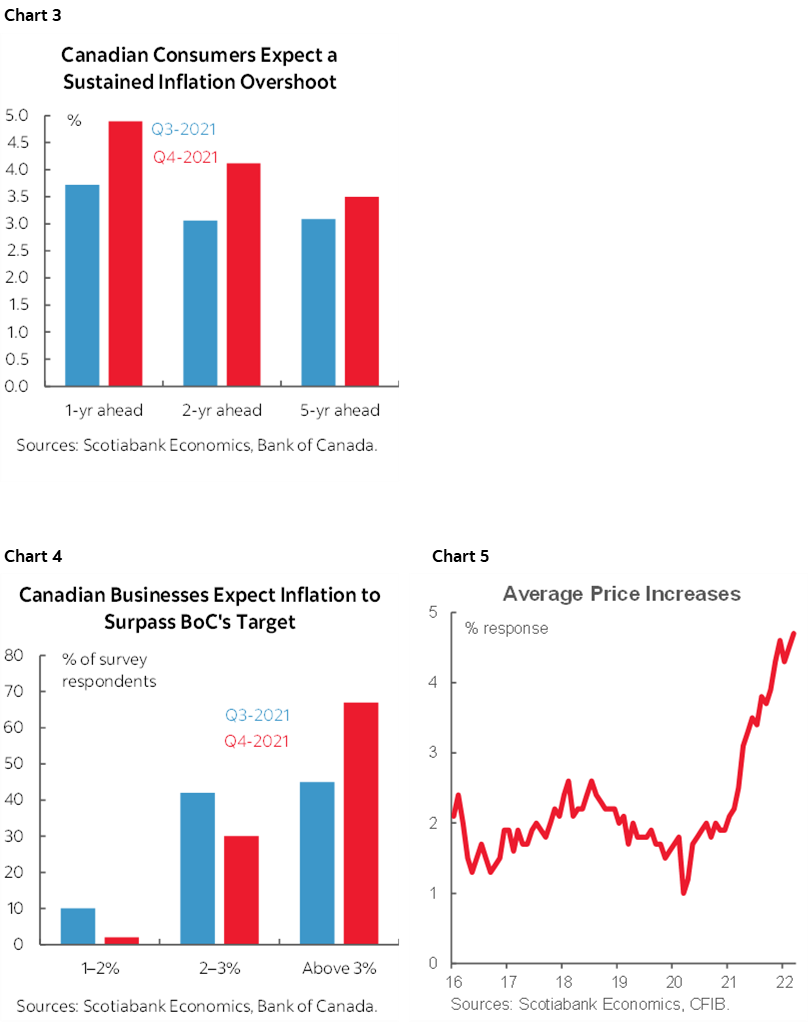
Still, given that consumers (chart 3) and businesses (chart 4) had been dramatically raising their expected rates of inflation in the prior January editions of the surveys, it’s very likely we’ll see further upward pressure in light of developments since then. Commodity prices soared and CPI inflation picked up by almost a full percentage point between December’s reading and February’s while March’s reading is certain to cross well above 6%. As chart 5 depicts, independent businesses have already signalled in a March survey that they plan to accelerated price increases over the next year.
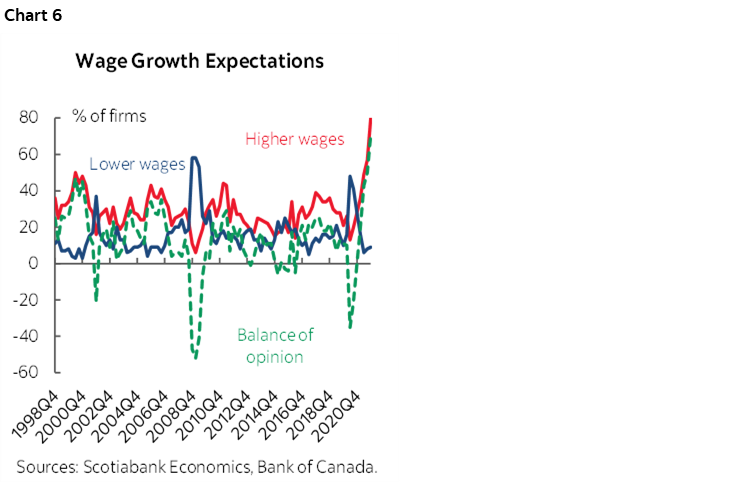
Also watch measures like what businesses are signalling in terms of updates to the intensity of labour shortages and wage pressures (chart 6), difficulties in meeting capacity constraints, and further signs of extrapolative expectations for future house price gains.
In all, the pair of surveys is likely to add to the case for expediting the pace of rate hikes on April 13th when we expect the Bank of Canada to raise its policy rate by 50+ basis points.
CANADA’S FEDERAL BUDGET—SPENDING WINDFALLS
As Scotia’s Rebekah Young explains below, more spending has been well-channeled ahead of Thursday’s federal budget in Canada.
Between remaining Liberal election promises, new pledges under last week’s Liberal-NDP supply agreement, this week’s $9 bn for the green transition, and some yet-to-be announced amount for defense, the numbers add up quickly. Government revenue windfalls in the near-term, at least, should be impressive based on provincial numbers coming out ahead of the feds that should mask some of the new spending. We’ve made some guesswork here that assumes about $50 bn in net new spending over the horizon (FY27): roughly $150 bn in spending against $100 bn in revenue-side effects (e.g., windfalls along with promised revenue-raising measures). It might be a bit less if they don’t book a full pharma/dental program just yet into the fiscal framework since the Liberal-NDP pact is phased, but language is strong enough that at least a shadow placeholder should be there. The result would be declining deficit and debt paths that look more or less similar to the outlook presented in December’s Fiscal and Economic Update in the near term but the pace of consolidation likely starts slowing in outer years (charts 7–9).
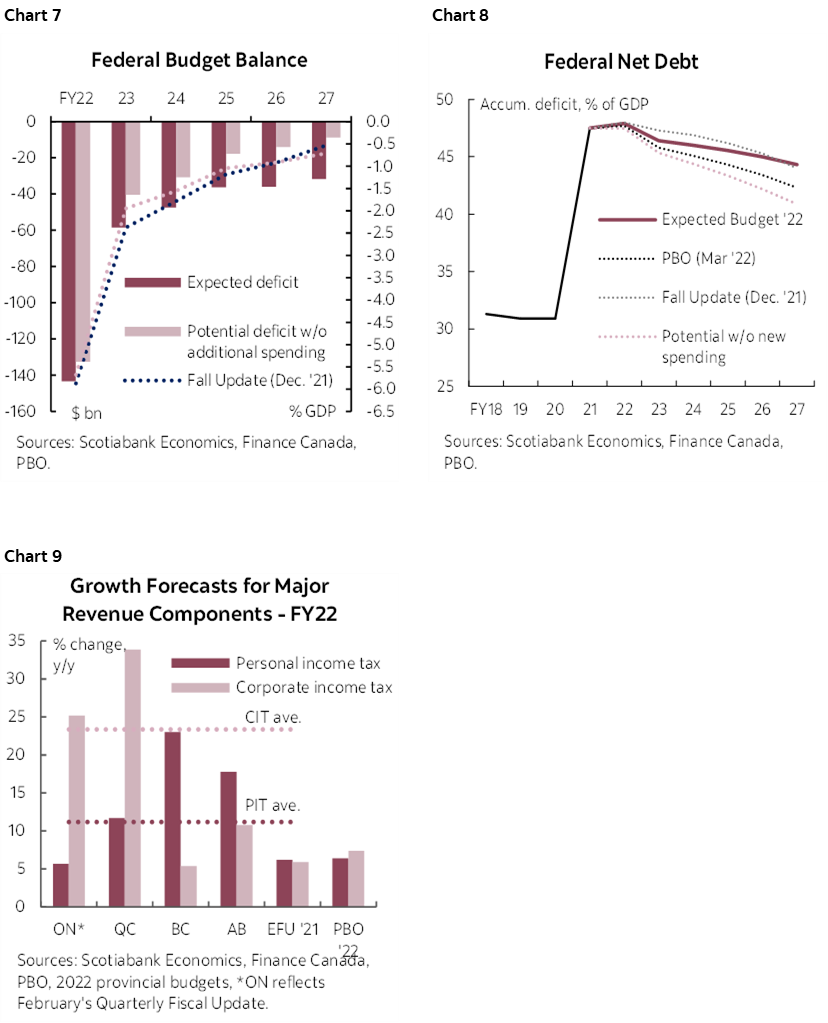
We’ve also not incorporated anything by the way of major new supports to offset inflationary impacts to Canadian households. We will watch this space: if done responsibly, support would be well-targeted, means-tested and time-limited that should be limited to lower single-digits (in billions). Recall, provinces are already offering support to various degrees ($500 cheques in Quebec, fuel subsidies in Alberta, income tax relief in some smaller provinces, and Ontario has not yet tabled its pre-election budget). The potential costs of miscalibrating the near-term response are high and compound the policy risk to our outlook.
Overall, expectations are not high for game-changers on the growth front despite early-year signals from the Finance Minister. The propensity to spend, despite revenue uplifts, reinforces our conviction around the Bank of Canada’s next moves and pressure on Canadian yields.
CANADIAN JOBS—TIGHTENING THE SCREWS
Canada updates job figures for the month of March on Friday, perhaps having wisely chosen to avoid April Fool’s day when the US released what are often highly uncertain estimates. I’ve gone with a gain of 125,000 and an estimated decline in the unemployment rate to 5.2% from 5.5%.
There is a good chance that Canada will follow up the 336,600 jobs created in February 2022 with another decent gain. There have only been three times since the inception of the Labour Force Survey in 1976 when the monthly gain was the same as or bigger than February’s. On all three of those occasions, the next month was up again. In June 2020 when restrictions were first being eased, the country regained 931k jobs and then followed that up the next month with another 404k. Then the subsequent month registered another 192k. In September 2020, 384k jobs were regained and followed by another 90k in October. That’s an average gain in the subsequent month of about 230k.
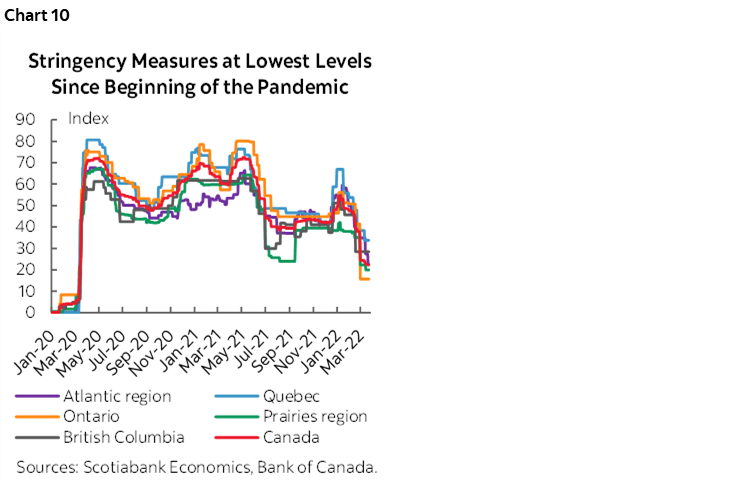
We don’t want to rely upon figures from when the country was first clawing its way out of the worst lockdowns as they may be statistical anomalies. Other readings, however, also lean in favour of another solid print. For instance, just as the February rebound was driven by easing restrictions and more than reversed the employment declines of the prior two months, those same measures of restrictions eased further in March. Chart 10 shows that weekly stringency indices—measures of COVID-19 restrictions—fell across all parts of the country back to their lowest levels since the pandemic first struck.
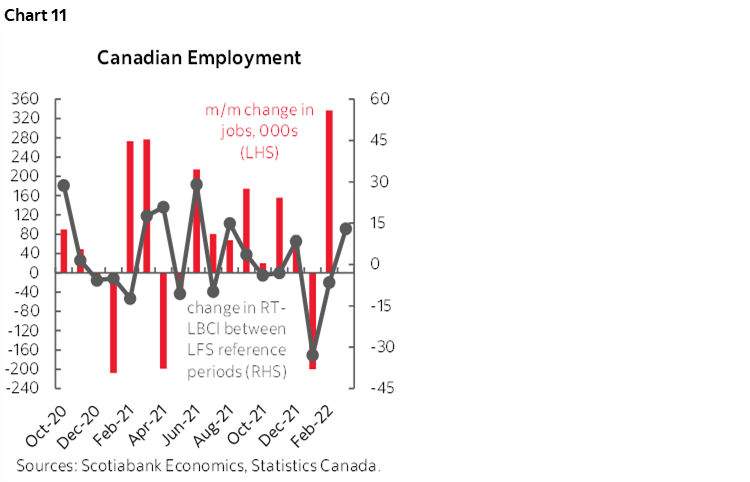
In addition, while it’s hardly an infallible gauge, our national composite index of Statistics Canada’s Real-Time Local Business Conditions Indices across major cities posted an improvement in March. This indicator tends to correlate with monthly changes in employment but can throw off false signals (chart 11). It is based upon data from the Business Register, Google Places, Yelp Fusion, Zomato and TomTom. As such it can capture business openings and closings and various mobility gauges.
What may be at least as important as the jobs estimate will be wages. Like the US (only worse), wage growth stalled out in February despite the gain in jobs and/or because of the temporary composition of the rebound in jobs. Another soft wage reading could matter more than the jobs tally. The US avoided this by renewing wage gains (recap here) and Canada is expected to follow suit with a gain more in keeping with the trend of annualized month-over-month gains we’ve been seeing for some time now. Of course, a major difference between the two countries is that Canada’s labour productivity is vastly worse off than the US has been throughout the pandemic era.
Another jobs gain would only add to the state of Canada’s more than full recovery from the pandemic hit. The labour force participation rate is just 0.2 ppts below the pre-pandemic level. Total employment is about 370k above February 2020 levels. The unemployment rate of 5.5% is a touch below pre-pandemic levels. Even the R8 measure of underemployment that captures discouraged measures of slack not fully captured in official unemployment rates sits at 8.1% which is a half percentage point below pre-pandemic levels. Canada’s labour market is tight and getting tighter.
CENTRAL BANKS AND OTHER MACRO
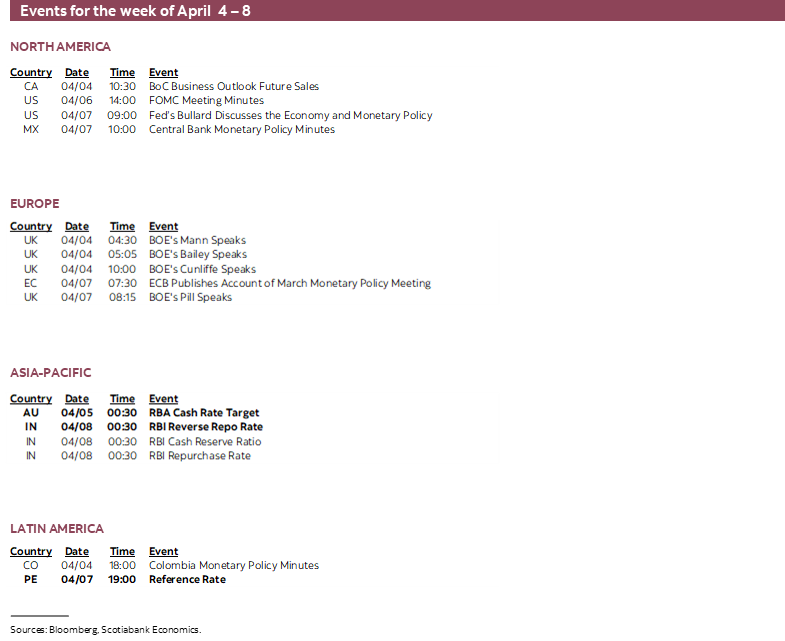
A trio of regional central bank decisions and a string of inflation reports across Asia-Pacific and Latin American markets will dominate the rest of the global calendar-based risks over the coming week.
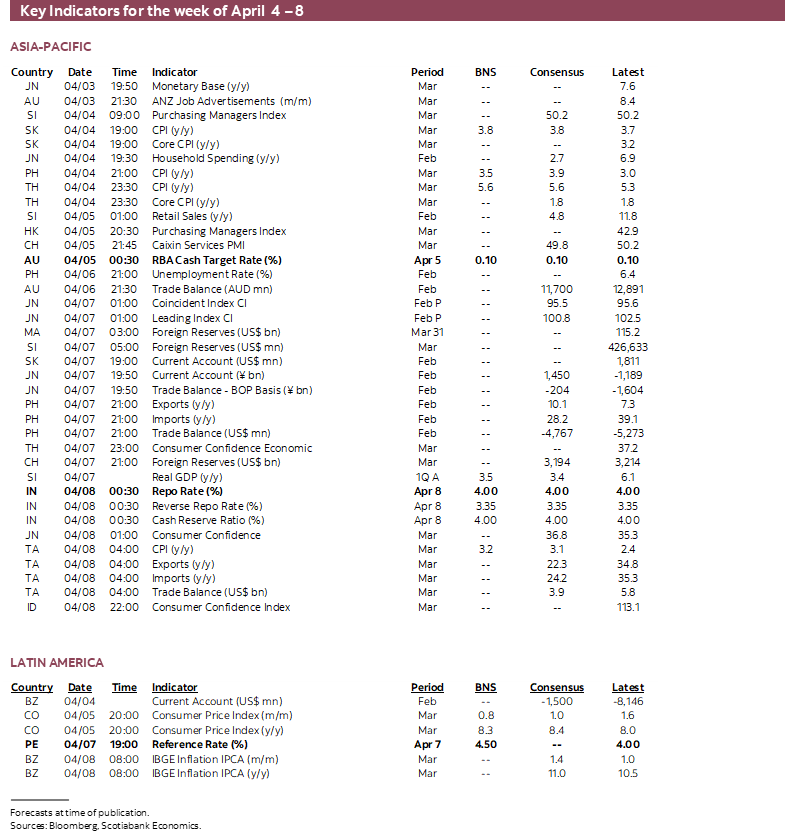
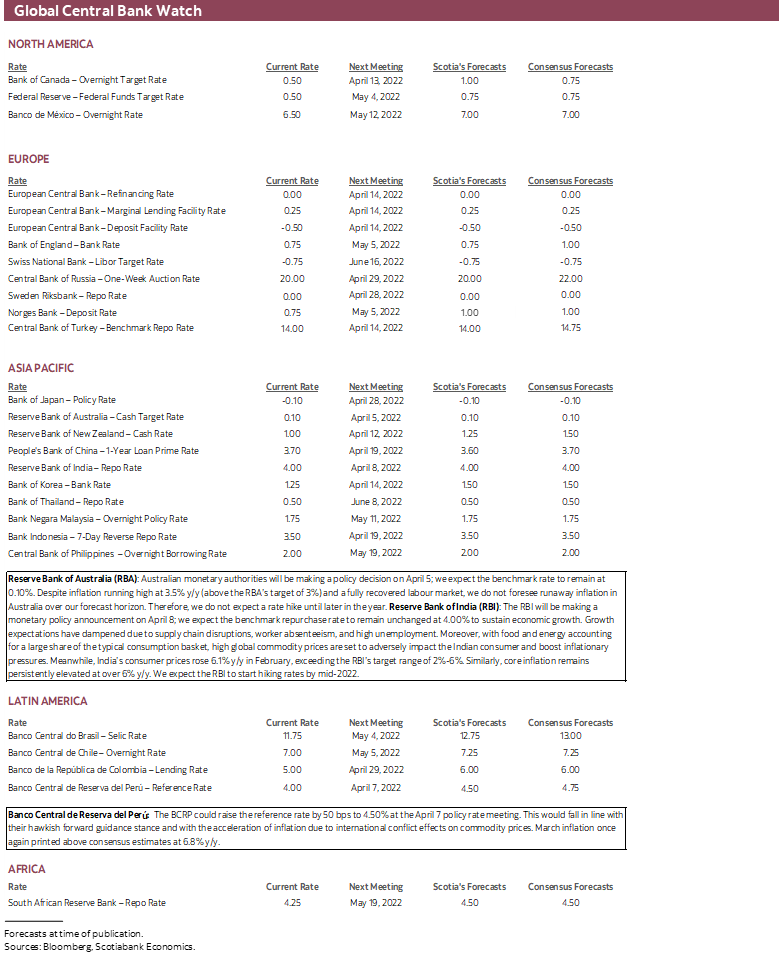
Among central bank decisions on tap, only Peru is expected to hike this week, but guidance will be important from the Reserve Bank of Australia and the Reserve Bank of India.
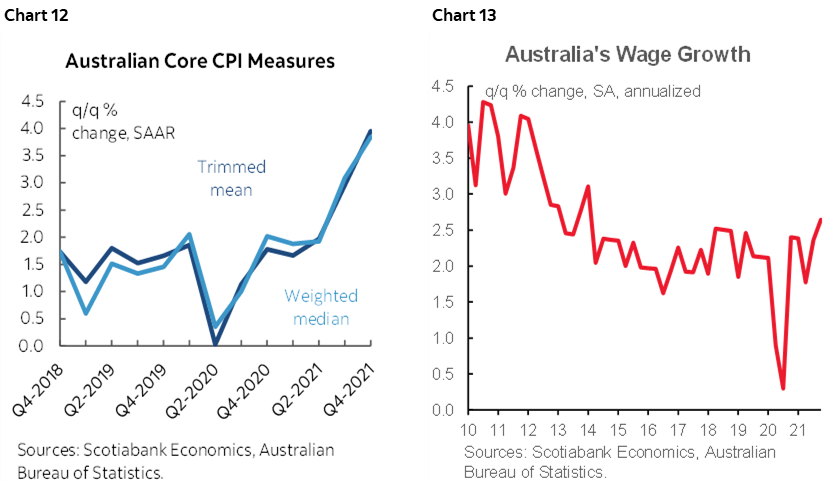
- RBA: With markets pricing lift-off in June, RBA guidance will be key on Tuesday while it keeps policy unchanged for now. An election in May lies in between now and then. Having ended its QE bond purchase program in January, the RBA now faces rising pressure on inflation and wages (charts 12, 13). Governor Lowe has previously stated that the RBA “will not increase the cash rate until actual inflation is sustainably within the 2–3% target range” and that “it is too early to conclude that it is sustainably within the target range.” Whether that belief still holds as true now in the face of the war’s effects upon supply chains and commodity prices will be tested at this meeting.
- RBI: Friday’s decision may further inform timing for rate lift-off. No change in the policy repo rate of 4% is expected now as the RBI grapples with growth risks. Nevertheless, high inflation of 6.1% y/y which is just above the central bank’s 2–6% target range may motivate further strengthening of guidance to seek policy exits into the second half of the year.
- BRCP: Peru’s central bank (Thursday) is expected to hike its policy reference rate by 50bps to 4.5%. Soaring inflation at 6.8% y/y is the primary catalyst
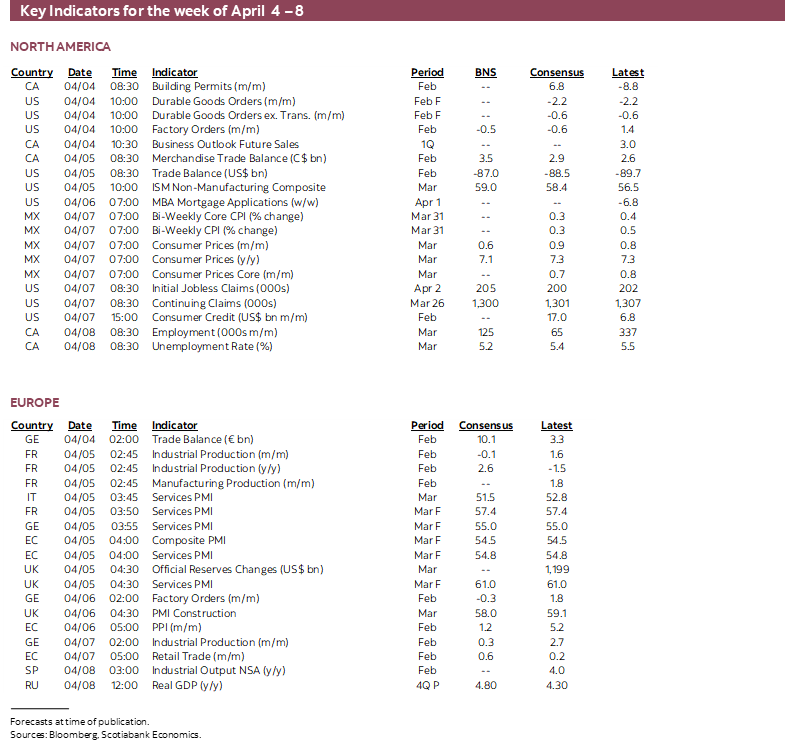
While the FOMC minutes will dominate, the US will also offer up a trio of reports. Factory orders during February (Monday) are likely to be soft given what we know happened to the roughly half of them that are accounted for by the 2.2% drop in durable goods orders. Tuesday brings out a still wide but perhaps slightly narrower trade deficit given what we already know about the merchandise component. Tuesday also offers up the ISM-services index for March that may rebound from the decline in February.
Canada will likely post a wider trade surplus for February on Tuesday on the back of higher commodity prices. The Ivey PMI for March may further inform supply chain and price pressures.
Asia-Pacific markets will be quiet beyond the RBA and RBI decisions. CPI inflation reports from South Korea and Thailand (Monday) and Taiwan (Friday) will reflect higher price pressures from commodity effects.
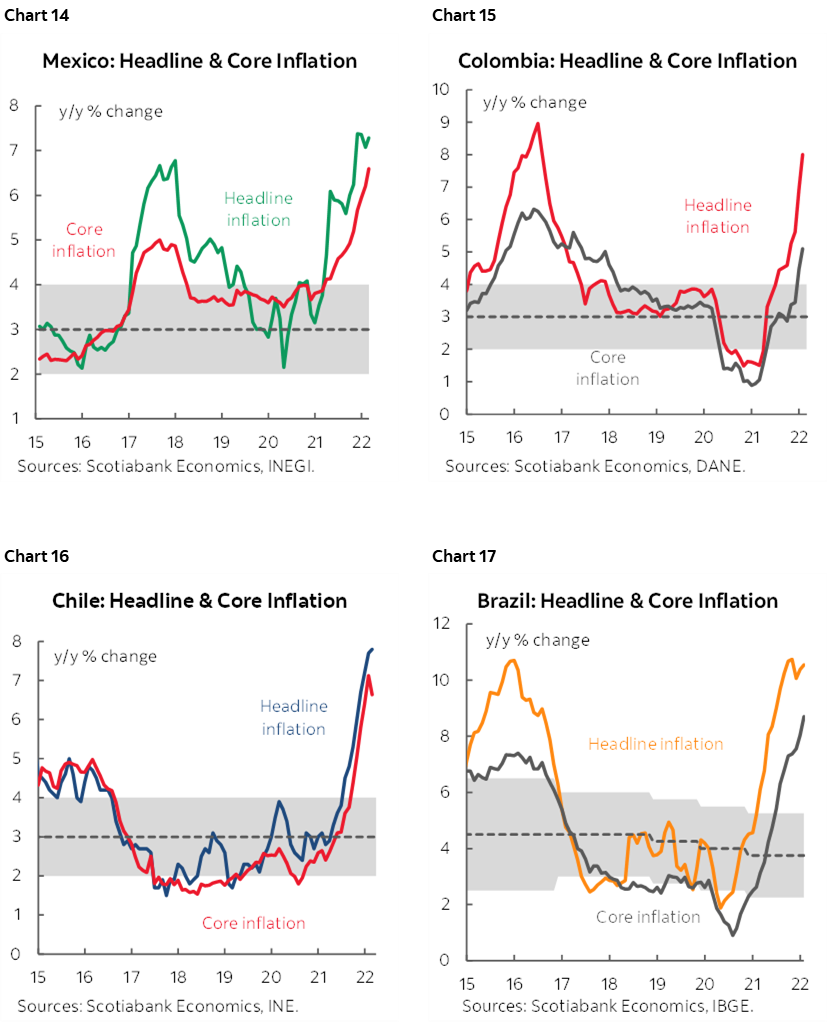
That same theme of inflationary pressures will likely also flow through figures provided across Latin American markets when CPI gets updated in Colombia (Tuesday), Mexico (Thursday), and both Chile and Brazil (Friday). Charts 14–17.
European markets face little by way of developments in terms of calendar-based risk which will keep the focus upon war headlines. If any fundamentals matter, then the focus will be mainly upon Germany’s economy when export figures (Monday), factory orders (Wednesday) and industrial output (Thursday) get updated albeit all for February and hence not yet capturing much of the war’s effects.
DISCLAIMER
This report has been prepared by Scotiabank Economics as a resource for the clients of Scotiabank. Opinions, estimates and projections contained herein are our own as of the date hereof and are subject to change without notice. The information and opinions contained herein have been compiled or arrived at from sources believed reliable but no representation or warranty, express or implied, is made as to their accuracy or completeness. Neither Scotiabank nor any of its officers, directors, partners, employees or affiliates accepts any liability whatsoever for any direct or consequential loss arising from any use of this report or its contents.
These reports are provided to you for informational purposes only. This report is not, and is not constructed as, an offer to sell or solicitation of any offer to buy any financial instrument, nor shall this report be construed as an opinion as to whether you should enter into any swap or trading strategy involving a swap or any other transaction. The information contained in this report is not intended to be, and does not constitute, a recommendation of a swap or trading strategy involving a swap within the meaning of U.S. Commodity Futures Trading Commission Regulation 23.434 and Appendix A thereto. This material is not intended to be individually tailored to your needs or characteristics and should not be viewed as a “call to action” or suggestion that you enter into a swap or trading strategy involving a swap or any other transaction. Scotiabank may engage in transactions in a manner inconsistent with the views discussed this report and may have positions, or be in the process of acquiring or disposing of positions, referred to in this report.
Scotiabank, its affiliates and any of their respective officers, directors and employees may from time to time take positions in currencies, act as managers, co-managers or underwriters of a public offering or act as principals or agents, deal in, own or act as market makers or advisors, brokers or commercial and/or investment bankers in relation to securities or related derivatives. As a result of these actions, Scotiabank may receive remuneration. All Scotiabank products and services are subject to the terms of applicable agreements and local regulations. Officers, directors and employees of Scotiabank and its affiliates may serve as directors of corporations.
Any securities discussed in this report may not be suitable for all investors. Scotiabank recommends that investors independently evaluate any issuer and security discussed in this report, and consult with any advisors they deem necessary prior to making any investment.
This report and all information, opinions and conclusions contained in it are protected by copyright. This information may not be reproduced without the prior express written consent of Scotiabank.
™ Trademark of The Bank of Nova Scotia. Used under license, where applicable.
Scotiabank, together with “Global Banking and Markets”, is a marketing name for the global corporate and investment banking and capital markets businesses of The Bank of Nova Scotia and certain of its affiliates in the countries where they operate, including; Scotiabank Europe plc; Scotiabank (Ireland) Designated Activity Company; Scotiabank Inverlat S.A., Institución de Banca Múltiple, Grupo Financiero Scotiabank Inverlat, Scotia Inverlat Casa de Bolsa, S.A. de C.V., Grupo Financiero Scotiabank Inverlat, Scotia Inverlat Derivados S.A. de C.V. – all members of the Scotiabank group and authorized users of the Scotiabank mark. The Bank of Nova Scotia is incorporated in Canada with limited liability and is authorised and regulated by the Office of the Superintendent of Financial Institutions Canada. The Bank of Nova Scotia is authorized by the UK Prudential Regulation Authority and is subject to regulation by the UK Financial Conduct Authority and limited regulation by the UK Prudential Regulation Authority. Details about the extent of The Bank of Nova Scotia's regulation by the UK Prudential Regulation Authority are available from us on request. Scotiabank Europe plc is authorized by the UK Prudential Regulation Authority and regulated by the UK Financial Conduct Authority and the UK Prudential Regulation Authority.
Scotiabank Inverlat, S.A., Scotia Inverlat Casa de Bolsa, S.A. de C.V, Grupo Financiero Scotiabank Inverlat, and Scotia Inverlat Derivados, S.A. de C.V., are each authorized and regulated by the Mexican financial authorities.
Not all products and services are offered in all jurisdictions. Services described are available in jurisdictions where permitted by law.