HIGHER HEALTH SPENDING DRIVES INCREASE IN DEFICIT AND DELAY TO BUDGET BALANCE, BUT DEBT PATH IMPROVES
- Bottom line: Higher health spending growth and a temporary HST holiday on new houses will lead the deficit to grow larger again next year, and the province is pushing back the planned return to balance by a year to FY28. The debt path is somewhat lower due to stronger growth and a lower deficit in the current fiscal year, as well as an accounting change starting next year. However, the economic assumptions pre-date the developments of the past month, and may need to be revised lower. In addition, this budget includes less prudence compared to last year’s plan, which leaves it more exposed to downside risk.
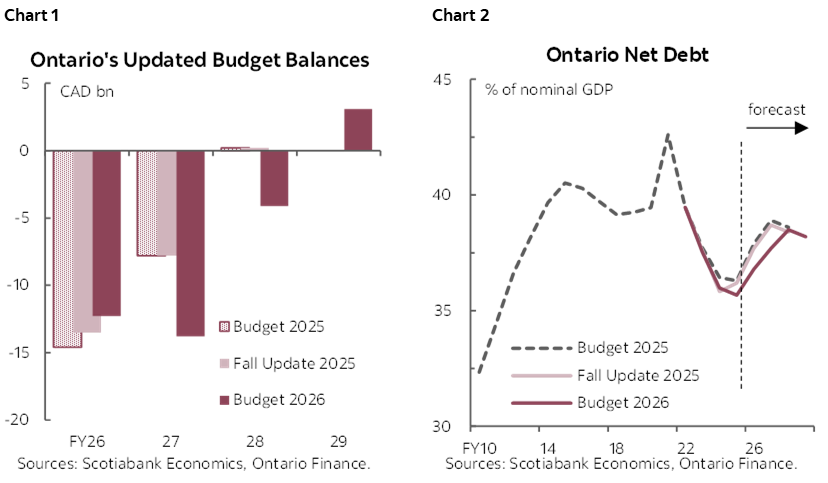
- Budget balance: Deficit of $12.3 bn (1% of nominal GDP) in FY26, increasing to $13.8 bn (1.1%) in FY27, before shrinking to $6.1 bn (0.5%) in FY28 and a small surplus of $0.6 bn (0%) in FY29 (chart 1).
- Economic assumptions: Real GDP growth is projected to slow from an estimated 1.2% in 2025 to 1% in 2026, increasing 1.7% in 2027, and improving thereafter.
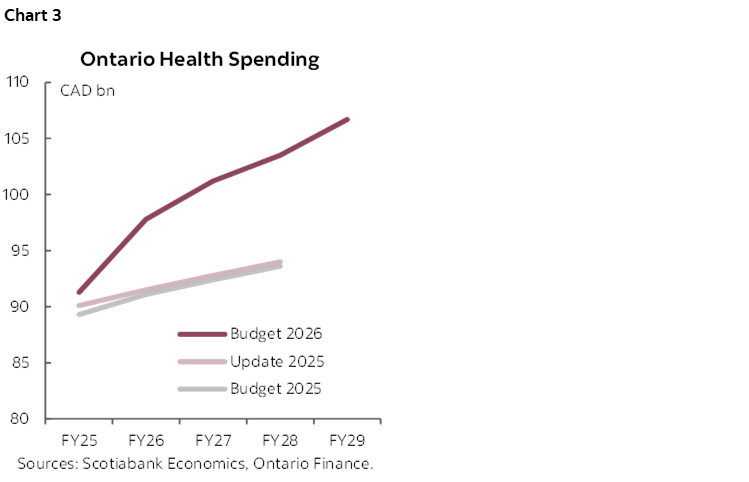
- Net debt: A stronger handoff of 36.8% in FY26, increasing to 38.5% in FY28 before marginally declining to 38.2% in FY29 (chart 2).
- Borrowing requirements: Falling from $58.6 bn this year to $47.2 bn in FY27 and $43 bn in following two years, in part due to considerable pre-funding during the current fiscal year.
OUR TAKE
Stronger-than-expected growth in 2025 provides an improved handoff, but increased healthcare spending weighs on the bottom line. The budget balance for FY26 has improved to -$12.3 bn (-1.0% of nominal GDP) relative to the fall update (-$13.5 bn, -1.1%) and last year’s budget (-$14.6 bn, -1.2%). However, the province now expects larger deficits over the next two years with a return to balance pushed out to FY29.
The revenue outlook has been revised higher relative to last year’s budget outlook. Total revenue for FY26 is projected to be $226.6 bn, as stronger-than-expected growth and equity markets raise expected revenues from personal income taxes. Total revenue growth of 2.3% is expected for FY27, accelerating to 5% in FY28 and 4.4% in FY29, as improving economic activity drives a pick-up in revenue from personal income, sales, and corporate taxes. The revenue outlook includes the cost of perhaps the budget’s biggest ticket item: the temporary removal of the full 13% HST for buyers of new homes valued up to $1 mn (with a partial rebate for more expensive homes). The government expects this measure to stimulate 8,000 additional housing starts, and to provide total relief to buyers of new homes of $2.2 bn–of which Ontario will bear $1.4 bn in foregone revenue.
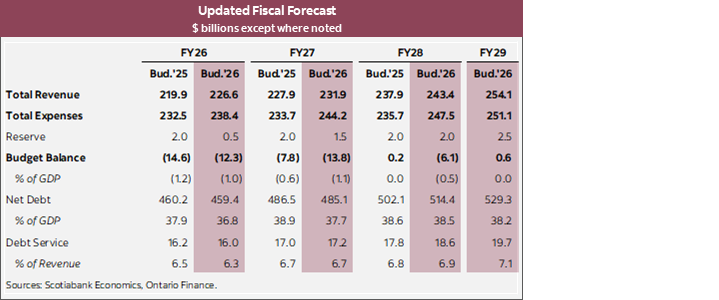
Much higher health spending has driven planned expenditures up. Cost pressures have driven health spending for FY26 up by 7% since the mid-year fiscal update. By FY29, planned health spending is 10% (nearly $10 billion) higher compared to the previous projection (chart 3)—and will reach even higher if the growth rate in health spending doesn’t slow to the projected 3% average for the coming years. Growth in other program spending is projected to be much lower (even turning negative in FY28 and FY29) in order to achieve overall expense growth of around 2% on average across the forecast horizon—below the projected roughly 3% growth in annual revenues to order to achieve a declining budgetary balance.
The budget includes some forecast buffers, but less than last year’s plan. Between the contingency budget in the expense outlook and the overall forecast reserve, this budget includes $3 bn in explicit prudence for FY26. This represents roughly 1.3% of revenues for the year, and is down from the $5 bn that was built into the fiscal framework last year.
The economic assumptions underpinning the budget expect soft growth to continue this year before improving in the outer years. Real GDP growth in 2025 is estimated to be 1.2%, up from the 0.8% in last year’s budget—providing a stronger handoff for the forecast horizon. Real GDP is projected to increase 1.0% in 2026 and 1.7% in 2027, and averaging 1.9% each year thereafter. However, the forecasts were finalized in mid-January and therefore did not take into account the developments since then, including the recent spike in oil prices and corresponding expected increase in inflation and interest rates. Our latest forecast anticipates Ontario’s real GDP growth a bit lower at 0.8% for this year, which would suggest that revenues could underperform by roughly $250 mn.
The province continues to make progress on some of its debt sustainability metrics. The net debt-to-GDP ratio for FY26 is now expected to come in nearly a full percentage point lower than projected in the mid-year update, reflecting a somewhat lower deficit and stronger nominal GDP growth. The debt burden is projected to remain below the government’s 40% target but on an upward trajectory—increasing to 38.5% in FY28, before marginally declining to 38.2% in FY29 (though absent a planned accounting change starting in FY27, the net debt numbers would be roughly 0.8 ppts higher that year onward). The province's interest-to-revenue ratio is projected to remain within the 7.5% target, increasing from 6.3% in FY26 to 7.1% in FY29. However, net debt-to-revenue is projected to remain above the province’s 200% target, increasing from 204% in FY26 to 213% in FY28 before declining to 210% in FY29.
The budget continues its good practice of estimating the fiscal impacts of illustrative upside and downside economic scenarios. The downside economic scenario involves the United States withdrawing from CUSMA, and growth therefore slowing considerably. In this scenario, the deficit falls only to $8 bn by FY29, the debt burden increases to 40.4%, and the interest-to-revenue ratio rises to 7.6%. The faster growth scenario is based on an acceleration in growth driven by the removal of most tariffs. In this case, the province estimates that the budget would be roughly balanced in FY28 (as previously planned), the debt burden would fall to 36.4% by FY29, and the interest-to-revenue ratio would rise to only 6.7%.
Borrowing is slated to fall, following considerable pre-funding in the current fiscal year. Total borrowing for FY26 is complete at $58.6 bn, $15.8 bn above planned in last year’s budget primarily owing to the province taking advantage of favourable market conditions to do some considerable pre-borrowing for the upcoming fiscal year (especially in foreign currency) and $5 bn in borrowing to capitalize the Protect Ontario Account Investment Fund that was announced last year. As such, borrowing requirements are expected to be lower over the outlook, with plans to borrow $47.2 bn in FY27, $43.1 bn in FY28, and $42.7 bn in FY29. This reflects falling refinancing needs and capital investment plans generally trending higher, and the deficit projected to generally trend lower. Total borrowing over FY27–FY29 is approximately $18.1 bn more in the slower growth scenario and $16.1 bn less in the faster growth scenario.
DISCLAIMER
This report has been prepared by Scotiabank Economics as a resource for the clients of Scotiabank. Opinions, estimates and projections contained herein are our own as of the date hereof and are subject to change without notice. The information and opinions contained herein have been compiled or arrived at from sources believed reliable but no representation or warranty, express or implied, is made as to their accuracy or completeness. Neither Scotiabank nor any of its officers, directors, partners, employees or affiliates accepts any liability whatsoever for any direct or consequential loss arising from any use of this report or its contents.
These reports are provided to you for informational purposes only. This report is not, and is not constructed as, an offer to sell or solicitation of any offer to buy any financial instrument, nor shall this report be construed as an opinion as to whether you should enter into any swap or trading strategy involving a swap or any other transaction. The information contained in this report is not intended to be, and does not constitute, a recommendation of a swap or trading strategy involving a swap within the meaning of U.S. Commodity Futures Trading Commission Regulation 23.434 and Appendix A thereto. This material is not intended to be individually tailored to your needs or characteristics and should not be viewed as a “call to action” or suggestion that you enter into a swap or trading strategy involving a swap or any other transaction. Scotiabank may engage in transactions in a manner inconsistent with the views discussed this report and may have positions, or be in the process of acquiring or disposing of positions, referred to in this report.
Scotiabank, its affiliates and any of their respective officers, directors and employees may from time to time take positions in currencies, act as managers, co-managers or underwriters of a public offering or act as principals or agents, deal in, own or act as market makers or advisors, brokers or commercial and/or investment bankers in relation to securities or related derivatives. As a result of these actions, Scotiabank may receive remuneration. All Scotiabank products and services are subject to the terms of applicable agreements and local regulations. Officers, directors and employees of Scotiabank and its affiliates may serve as directors of corporations.
Any securities discussed in this report may not be suitable for all investors. Scotiabank recommends that investors independently evaluate any issuer and security discussed in this report, and consult with any advisors they deem necessary prior to making any investment.
This report and all information, opinions and conclusions contained in it are protected by copyright. This information may not be reproduced without the prior express written consent of Scotiabank.
™ Trademark of The Bank of Nova Scotia. Used under license, where applicable.
Scotiabank, together with “Global Banking and Markets”, is a marketing name for the global corporate and investment banking and capital markets businesses of The Bank of Nova Scotia and certain of its affiliates in the countries where they operate, including; Scotiabank Europe plc; Scotiabank (Ireland) Designated Activity Company; Scotiabank Inverlat S.A., Institución de Banca Múltiple, Grupo Financiero Scotiabank Inverlat, Scotia Inverlat Casa de Bolsa, S.A. de C.V., Grupo Financiero Scotiabank Inverlat, Scotia Inverlat Derivados S.A. de C.V. – all members of the Scotiabank group and authorized users of the Scotiabank mark. The Bank of Nova Scotia is incorporated in Canada with limited liability and is authorised and regulated by the Office of the Superintendent of Financial Institutions Canada. The Bank of Nova Scotia is authorized by the UK Prudential Regulation Authority and is subject to regulation by the UK Financial Conduct Authority and limited regulation by the UK Prudential Regulation Authority. Details about the extent of The Bank of Nova Scotia's regulation by the UK Prudential Regulation Authority are available from us on request. Scotiabank Europe plc is authorized by the UK Prudential Regulation Authority and regulated by the UK Financial Conduct Authority and the UK Prudential Regulation Authority.
Scotiabank Inverlat, S.A., Scotia Inverlat Casa de Bolsa, S.A. de C.V, Grupo Financiero Scotiabank Inverlat, and Scotia Inverlat Derivados, S.A. de C.V., are each authorized and regulated by the Mexican financial authorities.
Not all products and services are offered in all jurisdictions. Services described are available in jurisdictions where permitted by law.