CANADA: SALES PULL BACK BUT CONTINUE TO SEE YEAR-OVER-YEAR GROWTH
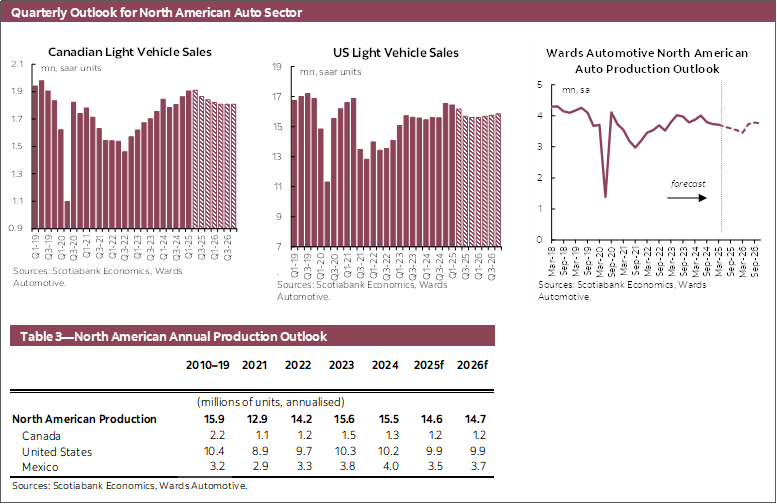
Canadian auto sales slowed again in May (-3.0% month-over-month) to 1.91 mn units at a seasonally adjusted annualized rate (SAAR) according to Wards Automotive (chart 1).

Canadian auto sales pulled back from the recent peak in March and April which was likely a small, temporary surge from consumers pulling forward some demand in order to front-run potential tariff effects. Nevertheless, light vehicle sales in non-seasonally adjusted terms were up 5.0% year-over-year for the most recent month.
While the economic outlook remains uncertain, notably around the timing and effect of tariffs, Canada’s first quarter GDP grew 2.2% quarter-over-quarter (SAAR), partially supported by a 1.2% increase in household consumption that eased from the more than 4% increases in both Q3 and Q4 of 2024. Meanwhile, job growth in Q2-2025 remains low, rising less than 10 k in both April and May, with the unemployment rate rising to 7%. We expect economic and job growth to be soft over the remainder of 2025 as the effects of tariffs and uncertainty continue to work their way through the economy.
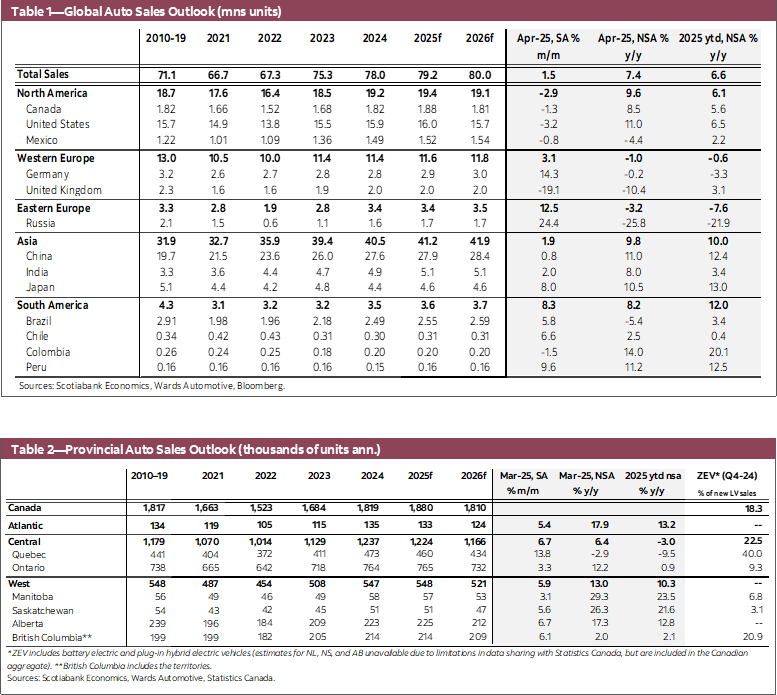
Our outlook for Canadian light vehicle sales of 1.88 mn in 2025 and 1.81 mn in 2026 as we expect the quarterly sales rate to slow over the remainder of the year. However, this outlook faces large uncertainty around the impacts that tariffs and uncertainty will have on the automotive sector and overall economic activity.
UNITED STATES: SALES RETREAT AS TARIFF FRONT-RUNNING DEMAND CUTS BACK
US auto sales in May fell by -9.3% month-over-month in seasonally adjusted terms to 15.6 mn units at an annualized rate (chart 2).

The temporary surge in monthly automotive sales that averaged 17.5 mn (SAAR) across March and April, driven by consumers looking to front-run any tariff distortions, has since pulled back to a sales rate much closer in line with the 15.7 mn average experienced for the better part of Q2-2023 through Q3-2024.
In late-May, the US Court of International Trade ruled against the US President’s use of the International Emergency Economic Powers Act (IEEPA) to impose the broad-based “Liberation Day” tariffs that were imposed on nearly all US imports. The Trump administration has appealed this ruling and the tariffs are allowed to remain in place while the process plays out. Even if the ruling against the use of the IEEPA to impose such broad-based tariffs is upheld, the Trump administration has said that they would use other measures to impose tariffs. While there is now even greater uncertainty around the trade outlook, the US Section 232 tariffs on automotive imports were not part of the IEEPA ruling and remain in place. Furthermore, tariffs on steel and aluminum imports were doubled to 50% on June 4th which poses even greater headwinds to North America’s highly integrated automotive sector given the US’s reliance on imports of these metals.
Our outlook for US auto sales expects the quarterly sales rate to slow through the rest of the year, resulting in 16.0 mn sales in 2025 and 15.7 mn in 2026.
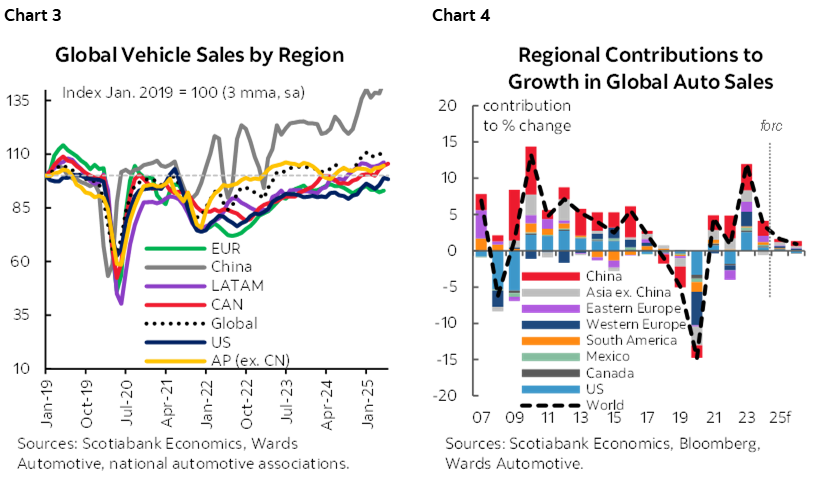
GLOBAL AUTO SALES: BROAD-BASED INCREASES IN APRIL
Global auto sales increased 1.5%% m/m (SA) in April amid broad-based strength at the regional level, rebounding marginally below the recent high in February earlier this year (chart 3). In west Europe, auto sales increased 3.1% m/m (SA) to the highest seasonally adjusted level since April 2024. Meanwhile, sales in east Europe increased 12.5% m/m (SA) but remain soft after declining for three consecutive months. Automotive sales in Asia Pacific increased 1.9% m/m (SA), rising in five of the six countries covered, though were up only 0.8% in China. Meanwhile, in Latin America rebounded by 5.8% m/m (SA). Our outlook for global vehicle sales growth is 1.6% in 2025 and 0.9% in 2026, with risks potentially weighing more to the downside as tariffs pose headwinds to global growth (chart 4).
DISCLAIMER
This report has been prepared by Scotiabank Economics as a resource for the clients of Scotiabank. Opinions, estimates and projections contained herein are our own as of the date hereof and are subject to change without notice. The information and opinions contained herein have been compiled or arrived at from sources believed reliable but no representation or warranty, express or implied, is made as to their accuracy or completeness. Neither Scotiabank nor any of its officers, directors, partners, employees or affiliates accepts any liability whatsoever for any direct or consequential loss arising from any use of this report or its contents.
These reports are provided to you for informational purposes only. This report is not, and is not constructed as, an offer to sell or solicitation of any offer to buy any financial instrument, nor shall this report be construed as an opinion as to whether you should enter into any swap or trading strategy involving a swap or any other transaction. The information contained in this report is not intended to be, and does not constitute, a recommendation of a swap or trading strategy involving a swap within the meaning of U.S. Commodity Futures Trading Commission Regulation 23.434 and Appendix A thereto. This material is not intended to be individually tailored to your needs or characteristics and should not be viewed as a “call to action” or suggestion that you enter into a swap or trading strategy involving a swap or any other transaction. Scotiabank may engage in transactions in a manner inconsistent with the views discussed this report and may have positions, or be in the process of acquiring or disposing of positions, referred to in this report.
Scotiabank, its affiliates and any of their respective officers, directors and employees may from time to time take positions in currencies, act as managers, co-managers or underwriters of a public offering or act as principals or agents, deal in, own or act as market makers or advisors, brokers or commercial and/or investment bankers in relation to securities or related derivatives. As a result of these actions, Scotiabank may receive remuneration. All Scotiabank products and services are subject to the terms of applicable agreements and local regulations. Officers, directors and employees of Scotiabank and its affiliates may serve as directors of corporations.
Any securities discussed in this report may not be suitable for all investors. Scotiabank recommends that investors independently evaluate any issuer and security discussed in this report, and consult with any advisors they deem necessary prior to making any investment.
This report and all information, opinions and conclusions contained in it are protected by copyright. This information may not be reproduced without the prior express written consent of Scotiabank.
™ Trademark of The Bank of Nova Scotia. Used under license, where applicable.
Scotiabank, together with “Global Banking and Markets”, is a marketing name for the global corporate and investment banking and capital markets businesses of The Bank of Nova Scotia and certain of its affiliates in the countries where they operate, including; Scotiabank Europe plc; Scotiabank (Ireland) Designated Activity Company; Scotiabank Inverlat S.A., Institución de Banca Múltiple, Grupo Financiero Scotiabank Inverlat, Scotia Inverlat Casa de Bolsa, S.A. de C.V., Grupo Financiero Scotiabank Inverlat, Scotia Inverlat Derivados S.A. de C.V. – all members of the Scotiabank group and authorized users of the Scotiabank mark. The Bank of Nova Scotia is incorporated in Canada with limited liability and is authorised and regulated by the Office of the Superintendent of Financial Institutions Canada. The Bank of Nova Scotia is authorized by the UK Prudential Regulation Authority and is subject to regulation by the UK Financial Conduct Authority and limited regulation by the UK Prudential Regulation Authority. Details about the extent of The Bank of Nova Scotia's regulation by the UK Prudential Regulation Authority are available from us on request. Scotiabank Europe plc is authorized by the UK Prudential Regulation Authority and regulated by the UK Financial Conduct Authority and the UK Prudential Regulation Authority.
Scotiabank Inverlat, S.A., Scotia Inverlat Casa de Bolsa, S.A. de C.V, Grupo Financiero Scotiabank Inverlat, and Scotia Inverlat Derivados, S.A. de C.V., are each authorized and regulated by the Mexican financial authorities.
Not all products and services are offered in all jurisdictions. Services described are available in jurisdictions where permitted by law.