CANADA: SLOW START TO YEAR AS SUPPLY HURDLES LINGER
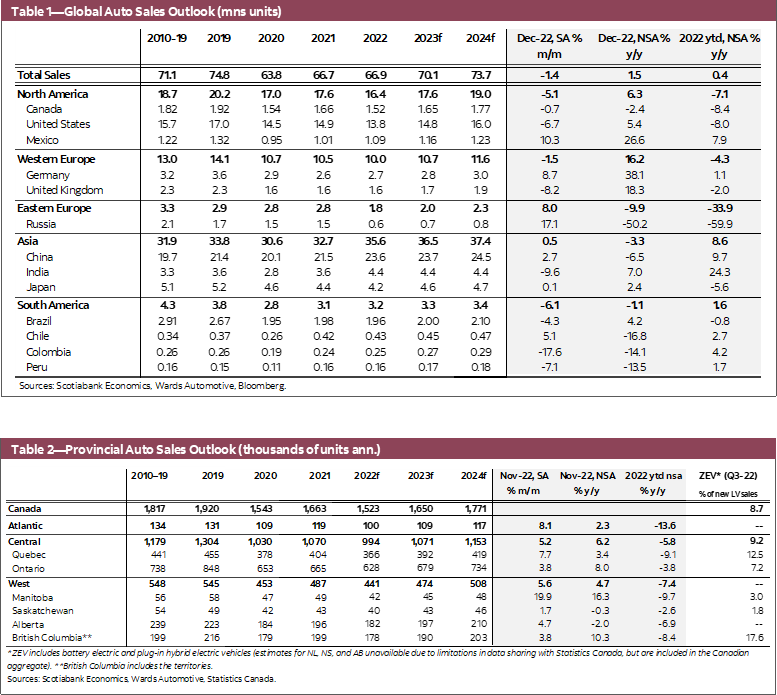
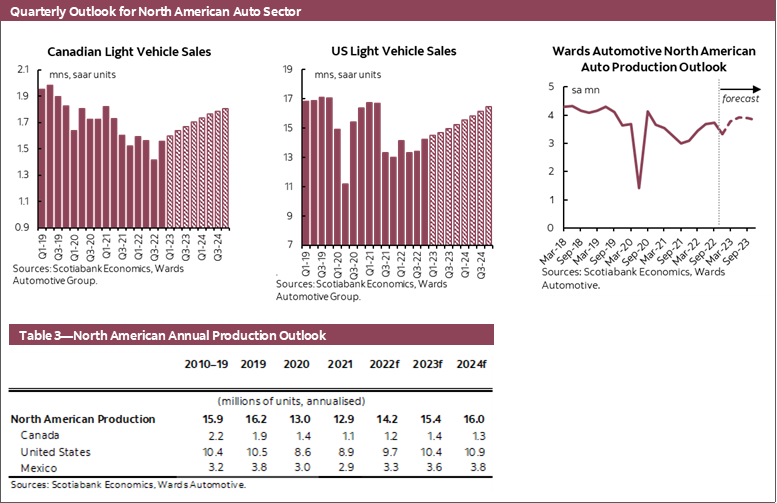
Canadian auto sales dipped in January in a highly volatile environment as the impact of high interest rates continues to work through the economy. Wards Automotive estimated sales slowed by -2.2% m/m (sa) following a relatively strong fourth quarter. This puts the seasonally adjusted annualised sales rate at 1.54 mn units—virtually the same as 2022’s annual sales rate and still -20% below 2019’s 1.92 mn auto sales. The prolonged recovery in North American auto production stagnated in the second half of 2022 and automakers expect slow production to linger in the upcoming months. Annual production improved by +9.8% in 2022 relatively the year prior—indicating an easing supply-demand imbalance—yet the latest production rate is still much weaker than pre-pandemic levels by close to -18% in December 2022. According to AutoForecast Solutions, North American automakers continue to slash production plans, accounting for almost one-third of global production cut this year due to microchip shortages.
Though facing strong headwinds, the demand side factors remain relatively solid as incoming data suggests greater economic resilience. Although the Bank of Canada strongly signalled a conditional pause after hiking the overnight rate by another 25bps on January 25, its fight against inflation is far from over and softer economic activity can be anticipated in the coming quarters. However, recent data gives us more conviction behind a soft-landing scenario in our outlook (see here), or just a mild and short-lived recession instead of a deep one which causes unemployment to spike and severely damages consumer demand. Economic conditions have proven more resilient than anticipated, particularly reflected in tight labour markets, where strong employment growth and still-high job vacancies support greater job stability and providing a buffer in the case of a downturn. Inflation seems to have turned the corner and is cooling evidently in the goods sector—less so in service sectors where prices face more upward pressure from rising wages and the re-opening of the Chinese economy. Bond markets are already shifting with both the Canadian 5-year and the 2-year yields coming off their respective peaks in October as markets price in lower inflation and rate cuts ahead (along with some temporary distortions in US debt markets). Consumer sentiment is stabilizing in light of these recent developments—the Canadian Economic Mood Index showed durable signs of bottoming and has been edging up so far this year.
Nevertheless, albeit our cautious optimism on fundamental demand, the auto sales outlook is still largely constrained by the slow supply recovery, while facing strong headwinds from deteriorating vehicle affordability, restrictive interest rates and broader cost of living pressures. Our Canadian sales forecast sits at 1.65 mn and 1.8 mn units in 2023 and 2024, respectively.
UNITED STATES: SUPPLY-DEMAND CONDITIONS IMPROVING BUT REMAIN TIGHT
US auto sales pulled off an encouraging +17.7% m/m (sa) rebound in January, but from weak levels in the fourth quarter last year. January's SAAR rose to 15.7 mn—well above the 13.8 mn units sold in 2022—narrowing the shortfall to -7.2% relative to the sales rate in 2019. Following two consecutive months of sharp declines of over -6% m/m (sa) in November and December, this surge in purchases could partly be a normalization of sales activity. Although the inventory-to-sales ratio has been on an upward trend since the beginning of 2022, it is still well below its long-term average, and pulled back slightly in January in light of strong sales activity—an indication that the current speed of inventory recovery can hardly catch up with sales. Hence, supply-demand conditions are slowly improving, but the market may remain tight for a prolonged period, especially given the slow production recovery against still-robust demand fundamentals. Despite the headline-grabbing mass layoffs in some sectors, initial jobless claims for unemployment benefits rose only marginally and remained historically low. Apart from the potential lag for layoffs that could result in a pickup in jobless claims, this could be a reflection of the ultra tightness of the labour markets—employment rose by half a million in January while 9.9 mn jobs remained vacant as of December according to JOLTS job openings. However, a host of headwinds could still cause some hesitation among prospective buyers as interest rates are well within the restrictive territory and still expected to rise further. The 48-month new car loan rate continued to edge up in January to over 3 percentage points higher than in the same month a year ago. The Federal Reserve raised the fed funds rate by another 25bps on February 1 and we expect it to hike two more times to 5.25% over the next two meetings. More resilient wage and price inflation could lead the Federal Reserve to consider bringing the rates up even further, which remains a material downside risk to our outlook. High interest rates continue to drag consumer confidence particularly for auto purchase intentions (U. of Mich. survey), but there are tentative signs of optimism in the overall index.
As vehicle availability improves and recession risk recedes, we expect US sales will increase to 14.8 mn and 16.0 mn in 2023 and 2024, respectively.
GLOBAL AUTO SALES: BACK TO ZERO
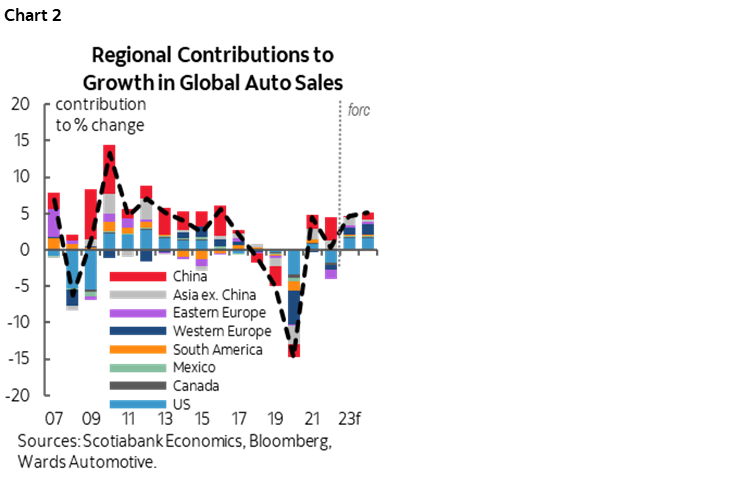
Global auto sales posted a -1.4% m/m (sa) decline in December following four consecutive pull-backs —wrapping up 2022 at 66.9 mn units—flat from the sales rate in 2021 (chart 1). Sales activity had started the year on an upward trend with the seasonally adjusted annualised rate at 67.3 mn units until the Russia-Ukraine war shocked already-strained supply chains and derailed the recovery. Meanwhile, a wave of COVID lockdowns in China took global auto sales plunging in April. Sales embarked on a slow climb up from April to July, until compounding headwinds from dimming economic outlook and heightened uncertainty started to weigh on purchases again. New waves of COVID-related slowdowns in China dragged the headline number even lower towards the end of the year, and in December, global auto sales sat at a depressed seasonally adjusted annualized rate of 64.8 mn units—over 13% below 2019’s 75 mn units. Weak sales prevailed across all regions—except in the Asia Pacific where despite large disruptions in China, annual sales still grew by +8.6% y/y. South American sales saw a boom in the first half of the year, before sliding sharply in the second half and ending the year only slightly higher than 2021’s weak sales. Western European sales picked up in the fourth quarter of 2022 but annual sales still ended the year -4.3% y/y, on top of the -2.1% y/y decline in 2021. North American sales posted the largest decline in 2022 with a -7.1% y/y contraction, offsetting the +3.9% recovery in 2021.

Barely gaining any lost ground in 2022, the global auto sector is looking at another challenging year of recovery. Incoming January data suggests more volatility ahead—sales will likely contract in major markets such as Germany and China but pick up in the US and Japan. Disruptions in Europe and Asia seem to be stabilizing—Europe avoided the worst of the energy crisis and China’s COVID surge has passed its painful peak since the zero-COVID policy was lifted—suggesting healing supply chains and rebounding demand down the line. Although strong headwinds can still be expected in the near term with financial conditions extremely tight across the world, economic growth in key economies proved surprisingly resilient and inflation seems to be turning the corner in some countries—setting the stage for a continued expansion in global auto sales once global production catches up. We have pencilled in global auto sales growth of about 5% in both 2023 and 2024 (chart 2), with North America and Europe driving the recovery.
ELECTRIC VEHICLE SALES IN CANADA: READY TO ACCELERATE?
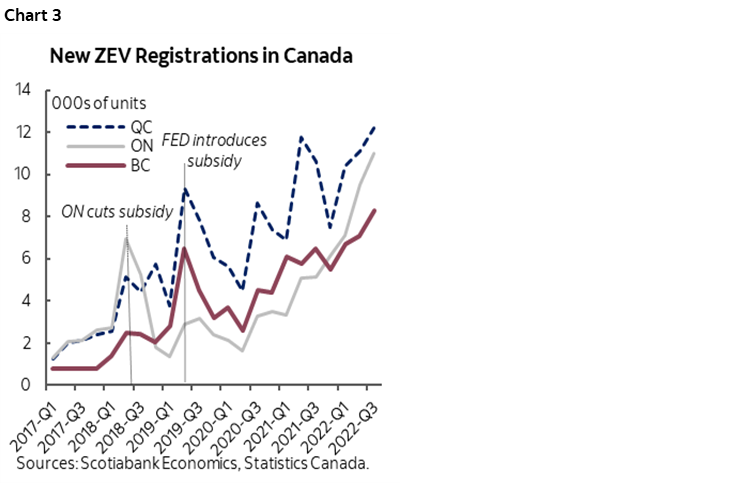
2023 seems increasingly likely to be the year that EV sales take a material leap in Canada. Despite weak new vehicle sales activity, Canadian EV purchases continued to pick up in Q3 2022 with a +15% gain q/q, accounting for 8.7% of new sales. Other than provinces with purchase incentives—namely BC and Quebec—that continued to be the leaders among provinces with a respective share of 17.6% and 12.5% of new vehicles sold being EVs, Ontario saw EV sales burgeoning and doubling the amount in the same quarter a year prior (chart 3). However, EV purchases still lag as a share of total vehicles sold in Ontario at 7.2% without some form of purchase incentive—the province cancelled the rebate program back in 2018 and instead has been investing heavily on the supply side. EV sales have made major progress in Canada in the past two years despite substantial constraints—in 2021, EV sales were marred by a series of production setbacks, and the year 2022 added rising prices on top of more supply issues when the war in Ukraine sent critical mineral prices skyrocketed. Some constraints have been moderating this year—better vehicle availability and potentially smaller premium over ICE cars could serve as tailwinds to EV purchases. The recovering supply chains should bring more EVs to the markets, with more models—especially the more affordable ones—coming in 2023. Anticipating the increasing likelihood of supply outstripping demand, two major manufacturers Tesla and Ford slashed their EV prices. According to Cox Automotive, the average transaction price for EVs decreased by over US$3,000 in December to US$61,448, driven by the price cuts at Tesla, which made up over 65% of the segment. By comparison, an average new ICE vehicle was sold at US$49,507 in December—roughly US$12k less than an average EV. Canada still has a long way to go compared to markets in Europe and China where the average price of an EV is lower and government subsidies and regulations are more favourable for EVs.
DISCLAIMER
This report has been prepared by Scotiabank Economics as a resource for the clients of Scotiabank. Opinions, estimates and projections contained herein are our own as of the date hereof and are subject to change without notice. The information and opinions contained herein have been compiled or arrived at from sources believed reliable but no representation or warranty, express or implied, is made as to their accuracy or completeness. Neither Scotiabank nor any of its officers, directors, partners, employees or affiliates accepts any liability whatsoever for any direct or consequential loss arising from any use of this report or its contents.
These reports are provided to you for informational purposes only. This report is not, and is not constructed as, an offer to sell or solicitation of any offer to buy any financial instrument, nor shall this report be construed as an opinion as to whether you should enter into any swap or trading strategy involving a swap or any other transaction. The information contained in this report is not intended to be, and does not constitute, a recommendation of a swap or trading strategy involving a swap within the meaning of U.S. Commodity Futures Trading Commission Regulation 23.434 and Appendix A thereto. This material is not intended to be individually tailored to your needs or characteristics and should not be viewed as a “call to action” or suggestion that you enter into a swap or trading strategy involving a swap or any other transaction. Scotiabank may engage in transactions in a manner inconsistent with the views discussed this report and may have positions, or be in the process of acquiring or disposing of positions, referred to in this report.
Scotiabank, its affiliates and any of their respective officers, directors and employees may from time to time take positions in currencies, act as managers, co-managers or underwriters of a public offering or act as principals or agents, deal in, own or act as market makers or advisors, brokers or commercial and/or investment bankers in relation to securities or related derivatives. As a result of these actions, Scotiabank may receive remuneration. All Scotiabank products and services are subject to the terms of applicable agreements and local regulations. Officers, directors and employees of Scotiabank and its affiliates may serve as directors of corporations.
Any securities discussed in this report may not be suitable for all investors. Scotiabank recommends that investors independently evaluate any issuer and security discussed in this report, and consult with any advisors they deem necessary prior to making any investment.
This report and all information, opinions and conclusions contained in it are protected by copyright. This information may not be reproduced without the prior express written consent of Scotiabank.
™ Trademark of The Bank of Nova Scotia. Used under license, where applicable.
Scotiabank, together with “Global Banking and Markets”, is a marketing name for the global corporate and investment banking and capital markets businesses of The Bank of Nova Scotia and certain of its affiliates in the countries where they operate, including; Scotiabank Europe plc; Scotiabank (Ireland) Designated Activity Company; Scotiabank Inverlat S.A., Institución de Banca Múltiple, Grupo Financiero Scotiabank Inverlat, Scotia Inverlat Casa de Bolsa, S.A. de C.V., Grupo Financiero Scotiabank Inverlat, Scotia Inverlat Derivados S.A. de C.V. – all members of the Scotiabank group and authorized users of the Scotiabank mark. The Bank of Nova Scotia is incorporated in Canada with limited liability and is authorised and regulated by the Office of the Superintendent of Financial Institutions Canada. The Bank of Nova Scotia is authorized by the UK Prudential Regulation Authority and is subject to regulation by the UK Financial Conduct Authority and limited regulation by the UK Prudential Regulation Authority. Details about the extent of The Bank of Nova Scotia's regulation by the UK Prudential Regulation Authority are available from us on request. Scotiabank Europe plc is authorized by the UK Prudential Regulation Authority and regulated by the UK Financial Conduct Authority and the UK Prudential Regulation Authority.
Scotiabank Inverlat, S.A., Scotia Inverlat Casa de Bolsa, S.A. de C.V, Grupo Financiero Scotiabank Inverlat, and Scotia Inverlat Derivados, S.A. de C.V., are each authorized and regulated by the Mexican financial authorities.
Not all products and services are offered in all jurisdictions. Services described are available in jurisdictions where permitted by law.