CANADA: UPWARD REVISIONS SHOW PERSISTENT BUT SLOWING AUTO SALES
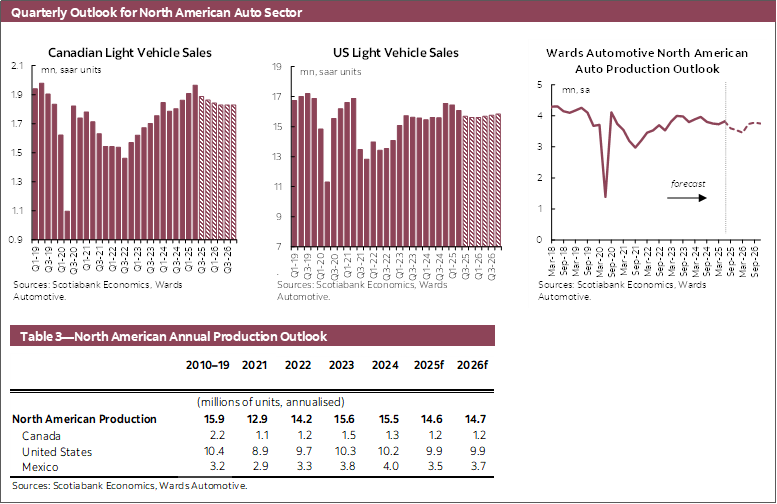
Canadian auto sales slowed in July (-3.2% month-over-month) to 1.81 mn units at a seasonally adjusted annualized rate (SAAR) according to Wards Automotive (chart 1).

Revisions to non-seasonally adjusted data for April through June show sales were 3.5% higher than previously reported, resulting in Q2 growth of 2.7% q/q (SA) as opposed to flat (0.1%), suggesting stronger demand in late spring to early summer than previously believed. However, seasonally adjusted vehicle sales declined for a third consecutive month, as uncertainty and the fading tariff front-running effect weighs on vehicle sales.
Canadian economic activity was flat in the second quarter (0.1% q/q SAAR) when measured through GDP by industry that includes the preliminary estimate for June. However, tariffs likely continue to distort the data, and GDP by expenditure data that is scheduled to be published at the end of August will help paint a better picture of Canada’s domestic economy when excluding trade and inventory effects. In the meantime, job growth increased in June after having stalled earlier in the year, with the unemployment rate trending around 7.0% since April.
While the US has increased tariffs on effectively all goods imports, exemptions for many Canadian goods that are CUSMA-compliant has so far mitigated some of the broad-based downside that was previously feared, but uncertainty remains around future developments. The degree of uncertainty is reinforced by the Bank of Canada’s various scenarios included in the Monetary Policy Report published alongside their decision to hold the policy rate at 2.75% on July 30th. We expect the BoC to continue holding the policy rate through the rest of this year as they assess risks to inflation that remains near 2.5% y/y when excluding taxes, and monthly measures of core inflation that have averaged more than 3% m/m (SAAR) since April.
Our outlook for Canadian light vehicle sales is 1.91 mn in 2025 and 1.83 mn in 2026. The automotive sales rate is expected to remain soft through the second half of 2025, compared to the spring, as softer labour markets and uncertainty weigh on consumer spending growth. However, this outlook faces large uncertainty around the impacts that tariffs and potential price pressures will have, particularly on the automotive sector.
UNITED STATES: A TEMPORARY REBOUND SUPPORTED BY DELAYED TARIFFS?
US auto sales in July increased by 7.1% month-over-month in seasonally adjusted terms to 16.4 mn units at an annualized rate (chart 2).

July’s higher selling rate was the first seasonally adjusted increase since March, when auto sales had surged as consumers began to pull forward demand before the threatened tariffs came into effect. The rebound in sales could be a one-off, as June’s 15.3 mn (SAAR) sales rate was the lowest since August 2024. Alternatively, it could be resulting from the temporary pause in tariffs as the US administration looked to reach trade deals with other countries, with most country-specific tariffs coming into effect early August.
Recent downward revisions to US jobs data reveal that employment growth was lower than previously thought. Nevertheless, the unemployment rate has remained in the range of 4.1% to 4.2% since February, as the softer employment gains has coincided with slower labour force growth. With inflation still persistently around 2.5% y/y and core inflation sticky around 3%, should job growth remain soft, the US Federal Reserve may face conflicting challenges to their dual mandate of supporting maximum sustainable employment and bringing inflation back down towards their 2% target.
Our outlook for US auto sales expects the quarterly sales rate to remain soft through the second half of the year, resulting in 16.0 mn sales in 2025 and 15.7 mn in 2026.
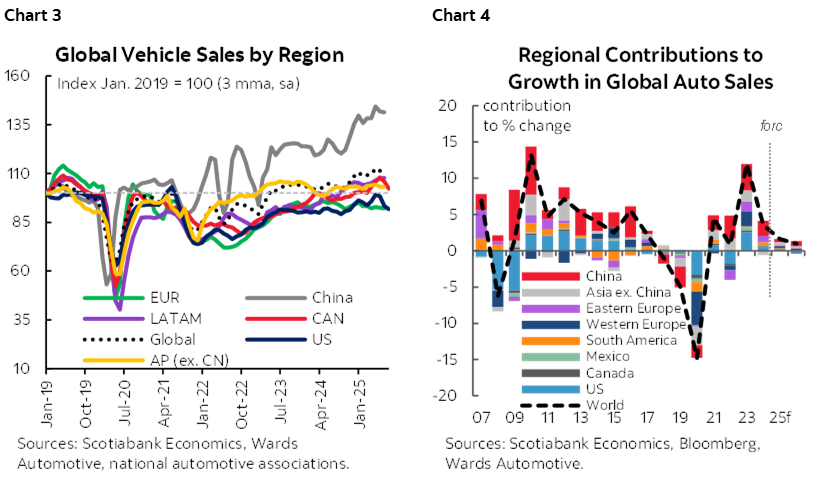
GLOBAL AUTO SALES: MARGINAL INCREASE IN Q2 AS AUTO SALES PULLED BACK IN JUNE
Global auto sales fell by -2.7% m/m (SA) in June, having declined in three of the past four months, and slowed in each region tracked for the month (chart 3). The soft end to the second quarter resulted in a 0.4% quarter-over-quarter increase in global seasonally adjusted sales. In western Europe, auto sales decreased by -2.1% m/m (SA), as sales slowed for a second consecutive month and second quarter was marginally lower by -0.6% q/q. Meanwhile, in eastern Europe auto sales pulled back by -1.1% m/m (SA) but were up 2.5% q/q in Q2. In the Asia Pacific region, auto sales decreased by -2.8% m/m (SA), weighed down by the slower sales in China (-3.2%) which accounts for roughly two-thirds of the region’s vehicle sales. In the second quarter, vehicle sales increased by 1.2% q/q for the region, supported by the 2.1% increase in China. In Latin America, auto sales decreased by -5.7% m/m (SA), the largest monthly contraction since May 2024, but comes on the heels of sales that increased in five of the six prior months, and were up 2.6% q/q in Q2. Our outlook for global vehicle sales growth is 1.6% in 2025 and 1.0% in 2026, with risks around tariff developments pose large uncertainty towards the global outlook (chart 4).
; Table 2—Provincial Auto Sales Outlook (thousands of units ann.); Table 3—North American Annual Production Outlook")
DISCLAIMER
This report has been prepared by Scotiabank Economics as a resource for the clients of Scotiabank. Opinions, estimates and projections contained herein are our own as of the date hereof and are subject to change without notice. The information and opinions contained herein have been compiled or arrived at from sources believed reliable but no representation or warranty, express or implied, is made as to their accuracy or completeness. Neither Scotiabank nor any of its officers, directors, partners, employees or affiliates accepts any liability whatsoever for any direct or consequential loss arising from any use of this report or its contents.
These reports are provided to you for informational purposes only. This report is not, and is not constructed as, an offer to sell or solicitation of any offer to buy any financial instrument, nor shall this report be construed as an opinion as to whether you should enter into any swap or trading strategy involving a swap or any other transaction. The information contained in this report is not intended to be, and does not constitute, a recommendation of a swap or trading strategy involving a swap within the meaning of U.S. Commodity Futures Trading Commission Regulation 23.434 and Appendix A thereto. This material is not intended to be individually tailored to your needs or characteristics and should not be viewed as a “call to action” or suggestion that you enter into a swap or trading strategy involving a swap or any other transaction. Scotiabank may engage in transactions in a manner inconsistent with the views discussed this report and may have positions, or be in the process of acquiring or disposing of positions, referred to in this report.
Scotiabank, its affiliates and any of their respective officers, directors and employees may from time to time take positions in currencies, act as managers, co-managers or underwriters of a public offering or act as principals or agents, deal in, own or act as market makers or advisors, brokers or commercial and/or investment bankers in relation to securities or related derivatives. As a result of these actions, Scotiabank may receive remuneration. All Scotiabank products and services are subject to the terms of applicable agreements and local regulations. Officers, directors and employees of Scotiabank and its affiliates may serve as directors of corporations.
Any securities discussed in this report may not be suitable for all investors. Scotiabank recommends that investors independently evaluate any issuer and security discussed in this report, and consult with any advisors they deem necessary prior to making any investment.
This report and all information, opinions and conclusions contained in it are protected by copyright. This information may not be reproduced without the prior express written consent of Scotiabank.
™ Trademark of The Bank of Nova Scotia. Used under license, where applicable.
Scotiabank, together with “Global Banking and Markets”, is a marketing name for the global corporate and investment banking and capital markets businesses of The Bank of Nova Scotia and certain of its affiliates in the countries where they operate, including; Scotiabank Europe plc; Scotiabank (Ireland) Designated Activity Company; Scotiabank Inverlat S.A., Institución de Banca Múltiple, Grupo Financiero Scotiabank Inverlat, Scotia Inverlat Casa de Bolsa, S.A. de C.V., Grupo Financiero Scotiabank Inverlat, Scotia Inverlat Derivados S.A. de C.V. – all members of the Scotiabank group and authorized users of the Scotiabank mark. The Bank of Nova Scotia is incorporated in Canada with limited liability and is authorised and regulated by the Office of the Superintendent of Financial Institutions Canada. The Bank of Nova Scotia is authorized by the UK Prudential Regulation Authority and is subject to regulation by the UK Financial Conduct Authority and limited regulation by the UK Prudential Regulation Authority. Details about the extent of The Bank of Nova Scotia's regulation by the UK Prudential Regulation Authority are available from us on request. Scotiabank Europe plc is authorized by the UK Prudential Regulation Authority and regulated by the UK Financial Conduct Authority and the UK Prudential Regulation Authority.
Scotiabank Inverlat, S.A., Scotia Inverlat Casa de Bolsa, S.A. de C.V, Grupo Financiero Scotiabank Inverlat, and Scotia Inverlat Derivados, S.A. de C.V., are each authorized and regulated by the Mexican financial authorities.
Not all products and services are offered in all jurisdictions. Services described are available in jurisdictions where permitted by law.