

CHILE: AUGUST GDP AT -1% Y/Y ALL BUT GUARANTEES A 2026 GDP CONTRACTION
- Remarkable resilience in non-mining activity despite persistent supply-side shocks
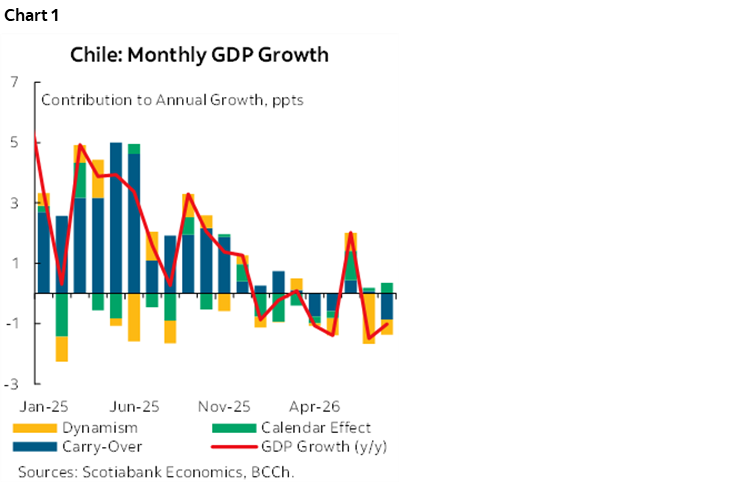
August GDP fell by 1.0% y/y (chart 1), below both consensus expectations and our forecast, largely driven by the historic decline in mining activity (-17.4% y/y). However, non-mining sectors showed resilience despite the supply-side shocks still affecting the economy, particularly commerce and services, which recovered to the activity levels recorded in April-May of this year. Following this release, while it is now highly likely that Chile will end 2026 with negative GDP growth (between -0.5% and 0.0%), below the Central Bank’s latest baseline scenario (0.25%-0.75%), non-mining GDP continues to regain momentum.
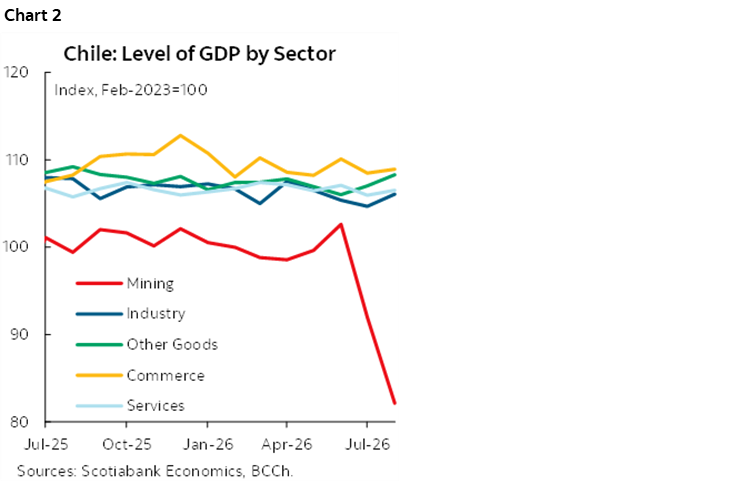
Mining is reducing its value-added output at a time when the economy was already weak (chart 2). This is an unusual situation by historical standards. Over the past 30 years, mining has experienced significant negative shocks on several occasions, but these were largely offset by periods of total GDP growth at or above potential. Unfortunately, in 2026 mining is set to exert a substantial negative impact, leaving overall GDP growth between 0.0% and -0.5%, masking the underlying resilience of non-mining activity, which would still expand between 0.5% and 1.0% y/y.
It is important to note that, despite the modest growth projected for non-mining GDP, this segment of the economy is also being affected by supply-side disruptions. Indeed, the projected 0.5%-1.0% expansion in non-mining activity for 2026 incorporates negative effects linked to the El Niño phenomenon across fishing, manufacturing, and transportation, among other sectors. These factors are compounded by adverse climate-related impacts in southern Chile, with spillovers to manufacturing activity. In this context, it is essential not only to isolate the effect of mining but also to account for other temporary supply-side shocks that have weighed on non-mining activity.
Mining activity has fallen to levels comparable to the 1990s. Climate-related disruptions and the resulting shutdowns at several private mining operations, together with ongoing challenges faced by Codelco at some of its flagship deposits, have pushed mining’s contribution to GDP back to levels not substantially different from those observed three decades ago. Rising costs, including sulfuric acid, labor, permitting requirements, and other inputs, have also weighed on the copper mining industry. At the same time, it is difficult to rule out strategic behavior by private mining companies ahead of the reduction in the corporate tax rate scheduled to take effect in 2027.
UNEMPLOYMENT RATE RISES TO 9.6% (9.4% SA), MOVING FURTHER AWAY FROM THE NAIRU RANGE
- Job losses intensify in manufacturing and business services
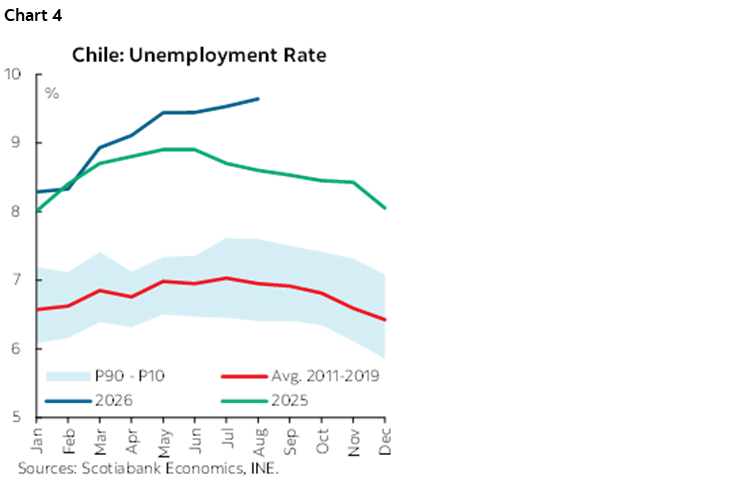
The unemployment rate rose to 9.6% in the rolling quarter ending in August (chart 3), surpassing the consensus expectation of stability at 9.5%. Contrary to consensus, at Scotiabank we had anticipated another increase in the unemployment rate, although the weaker-than-expected growth in the labour force surprised us and helped contain a more significant rise in unemployment.
Relative to the previous rolling quarter, 40k jobs were lost while the labor force declined by 32k, both counter-seasonal decreases. Weather-related factors likely remained present during August, although job losses in manufacturing and investment-related sectors point to growing cyclical weakness in the labour market.
The seasonally adjusted unemployment rate increased again in the Jun–Aug period, reaching 9.4% (previous: 9.3%), moving further away from the new NAIRU (non-accelerating inflation rate of unemployment) range estimated by the Central Bank in its latest September Monetary Policy Report, which stands between 8.2% and 8.8%. Excluding the post-pandemic period, the current deviation from the NAIRU level is comparable only to what was observed in 2009 following the global financial crisis.
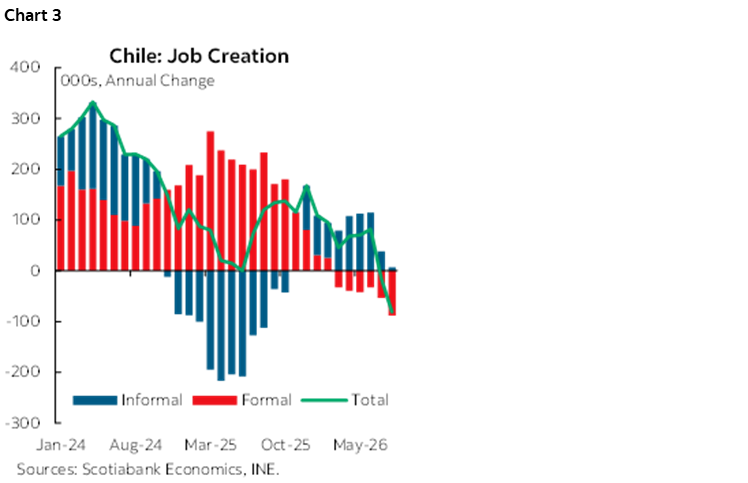
Annual employment destruction reached 81k jobs amid a decline in formal employment (chart 4). Compared with the same rolling quarter a year earlier, formal employment fell by 88k jobs, only partially offset by the limited and steadily weakening creation of informal jobs (7k). This weakness in formal employment is comparable only to what was observed in 2021, during the COVID crisis.
Weakness in the manufacturing sector deepens, while investment-related sectors continue to post job losses. Weather-related factors likely explain part of the weakness in some sectors, although manufacturing recorded even greater job destruction than in July, when the El Niño phenomenon had a stronger impact. Meanwhile, employment in Professional Activities, a services sector closely linked to investment dynamics, declined. The slow materialization of investment in recent months likely explains this trend, reflecting weaker confidence indicators, a challenging external environment, and a fiscal spending cut that has been concentrated on public investment.
—Aníbal Alarcón
DISCLAIMER
This report has been prepared by Scotiabank Economics as a resource for the clients of Scotiabank. Opinions, estimates and projections contained herein are our own as of the date hereof and are subject to change without notice. The information and opinions contained herein have been compiled or arrived at from sources believed reliable but no representation or warranty, express or implied, is made as to their accuracy or completeness. Neither Scotiabank nor any of its officers, directors, partners, employees or affiliates accepts any liability whatsoever for any direct or consequential loss arising from any use of this report or its contents.
These reports are provided to you for informational purposes only. This report is not, and is not constructed as, an offer to sell or solicitation of any offer to buy any financial instrument, nor shall this report be construed as an opinion as to whether you should enter into any swap or trading strategy involving a swap or any other transaction. The information contained in this report is not intended to be, and does not constitute, a recommendation of a swap or trading strategy involving a swap within the meaning of U.S. Commodity Futures Trading Commission Regulation 23.434 and Appendix A thereto. This material is not intended to be individually tailored to your needs or characteristics and should not be viewed as a “call to action” or suggestion that you enter into a swap or trading strategy involving a swap or any other transaction. Scotiabank may engage in transactions in a manner inconsistent with the views discussed this report and may have positions, or be in the process of acquiring or disposing of positions, referred to in this report.
Scotiabank, its affiliates and any of their respective officers, directors and employees may from time to time take positions in currencies, act as managers, co-managers or underwriters of a public offering or act as principals or agents, deal in, own or act as market makers or advisors, brokers or commercial and/or investment bankers in relation to securities or related derivatives. As a result of these actions, Scotiabank may receive remuneration. All Scotiabank products and services are subject to the terms of applicable agreements and local regulations. Officers, directors and employees of Scotiabank and its affiliates may serve as directors of corporations.
Any securities discussed in this report may not be suitable for all investors. Scotiabank recommends that investors independently evaluate any issuer and security discussed in this report, and consult with any advisors they deem necessary prior to making any investment.
This report and all information, opinions and conclusions contained in it are protected by copyright. This information may not be reproduced without the prior express written consent of Scotiabank.
™ Trademark of The Bank of Nova Scotia. Used under license, where applicable.
Scotiabank, together with “Global Banking and Markets”, is a marketing name for the global corporate and investment banking and capital markets businesses of The Bank of Nova Scotia and certain of its affiliates in the countries where they operate, including; Scotiabank Europe plc; Scotiabank (Ireland) Designated Activity Company; Scotiabank Inverlat S.A., Institución de Banca Múltiple, Grupo Financiero Scotiabank Inverlat, Scotia Inverlat Casa de Bolsa, S.A. de C.V., Grupo Financiero Scotiabank Inverlat, Scotia Inverlat Derivados S.A. de C.V. – all members of the Scotiabank group and authorized users of the Scotiabank mark. The Bank of Nova Scotia is incorporated in Canada with limited liability and is authorised and regulated by the Office of the Superintendent of Financial Institutions Canada. The Bank of Nova Scotia is authorized by the UK Prudential Regulation Authority and is subject to regulation by the UK Financial Conduct Authority and limited regulation by the UK Prudential Regulation Authority. Details about the extent of The Bank of Nova Scotia's regulation by the UK Prudential Regulation Authority are available from us on request. Scotiabank Europe plc is authorized by the UK Prudential Regulation Authority and regulated by the UK Financial Conduct Authority and the UK Prudential Regulation Authority.
Scotiabank Inverlat, S.A., Scotia Inverlat Casa de Bolsa, S.A. de C.V, Grupo Financiero Scotiabank Inverlat, and Scotia Inverlat Derivados, S.A. de C.V., are each authorized and regulated by the Mexican financial authorities.
Not all products and services are offered in all jurisdictions. Services described are available in jurisdictions where permitted by law.