- Chile: Central bank keeps rate at 4.5% with a more cautious tone, focus on potential inflation de-anchoring ahead of next meeting; Labour market fails to rebound—seasonally adjusted unemployment returns to 8.7%
- Peru: Trade balance hits record highs on elevated export prices
CHILE: CENTRAL BANK KEEPS RATE AT 4.5% WITH A MORE CAUTIOUS TONE, FOCUS ON POTENTIAL INFLATION DE-ANCHORING AHEAD OF THE NEXT MEETING
The decision came as no surprise to the consensus or surveys, but the Central Bank (BCCh) adopted a more cautious tone regarding short- and medium-term inflation developments. In this context, the probability of a policy rate hike at the June 16th meeting has increased meaningfully should high inflation prints be confirmed and, in particular, clear signs of inflation expectations de-anchoring emerge after the April and May CPI releases.
On the international front, the BCCh highlights the perceived resilience of the global economy, although this has been accompanied by oil prices above those assumed in the March Monetary Policy Report (despite copper prices also exceeding projections). This combination immediately builds higher short-term inflation and increases the risk of stronger second-round effects.
Domestically, the BCCh acknowledges an inflation surprise in the March CPI and anticipates an upward revision to near-term projections. The prolongation of the Middle East conflict has kept oil prices elevated for longer than expected, a scenario the Board now considers “more adverse” than that embedded in the March MPR. Against this backdrop, inflation in the coming months would exceed the 4.3% y/y peak projected in the MPR and move closer to 5% by mid-year, broadly consistent with our inflation forecast of 4.5% for December 2026.
Regarding domestic demand, the BCCh sees no major surprises in private consumption, though it notes somewhat less momentum in investment. This suggests that, for now, the Bank remains confident in its 2026 GDP growth forecast of 1.5%–2.5%, leaving activity as a second-order consideration for the next monetary policy move—especially if our call for March monthly activity is confirmed at or above 3.0% y/y (EES: 0.7%).
Inflation de-anchoring will be the key driver of the next policy rate move at the June 16th meeting. Headline inflation is very likely to approach 5% y/y after the May CPI (4.7% in our baseline). While relevant for policy, this level alone would not trigger a rate hike unless accompanied by clear de-anchoring of inflation expectations at the policy horizon (survey-based expectations and inflation compensation in interest rates). Should this occur—where we believe the market focus should be—together with a solid activity print for March GDP (between 3.0% and 3.5% y/y), conditions would be in place for the BCCh to be forced to adjust the policy rate, lifting it to the upper bound of the current neutral range (3.75%–4.75%).
Signs of inflation de-anchoring do not require double-digit inflation. As seen in January 2025, with annual inflation at 4.5%, the BCCh was forced to hold the policy rate after clear de-anchoring signals emerged ahead of a January CPI widely expected to be well above historical averages. Accordingly, observing inflation de-anchoring amid high monthly CPI prints—such as those recently seen and expected—and with annual inflation projected above 5% in July would not be unusual.
LABOUR MARKET FAILS TO REBOUND—SEASONALLY ADJUSTED UNEMPLOYMENT RETURNS TO 8.7%
The unemployment rate reached 8.9% in the quarter ended March, increasing from the previous quarter amid the destruction of 57k jobs (charts 1 and 2), while the labour force expanded marginally (+5k). In seasonally adjusted terms, the unemployment rate stood at 8.7%, above the upper bound of the Central Bank’s estimated NAIRU range, although it reflects a more limited sequential job loss (-14k SA).
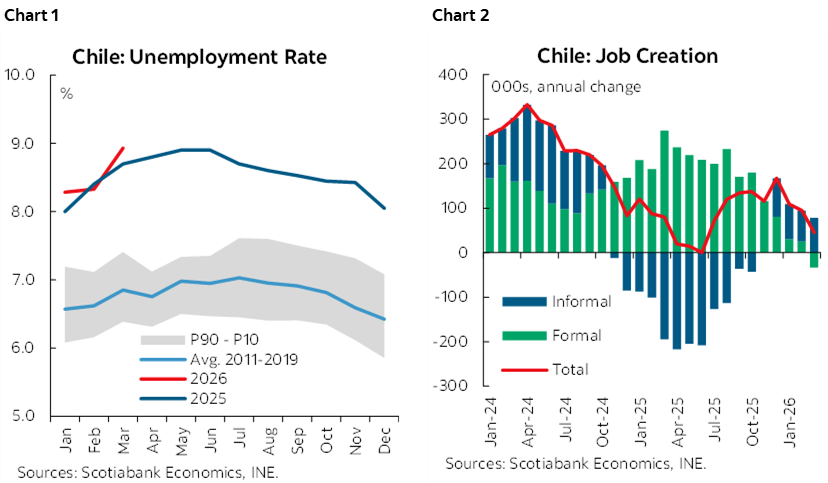
The loss of 57k jobs represents the largest decline for a March quarter (excluding the pandemic). By sector, job losses were concentrated in services—particularly education, health, transport and administrative activities—affecting both salaried and self-employed workers. While Q1 typically shows job destruction (around 30k), this outcome was markedly worse than usual, largely driven by the poor performance of self-employment, which shed 16k jobs, almost entirely concentrated in the transport sector.
This quarter also marks the first year-on-year contraction in formal employment in five years. We have warned for several quarters about a dangerous deceleration in annual formal job creation, which ultimately turned into a contraction in Q1 (-33k y/y). By sector, formal job losses were led by commerce (-33k) and financial and insurance activities (-31k). While the Government’s recently submitted Reconstruction Bill includes measures to support formal employment, it does not yet directly target the most lagging sectors in employment terms, such as construction, agriculture, and recreation and cultural services, among others.
—Anibal Alarcón
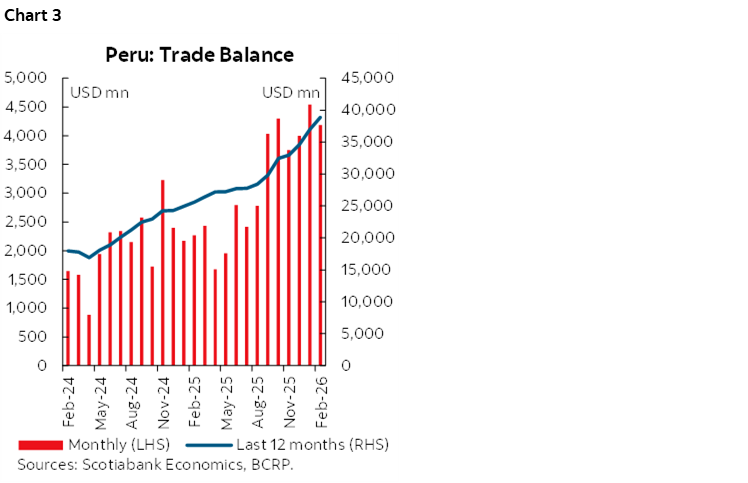
PERU: TRADE BALANCE HITS RECORD HIGHS ON ELEVATED EXPORT PRICES
Peru’s trade balance continued to post a strong performance during the first two months of the year, recording a surplus of USD 4.3bn (chart 3), according to data from the Central Reserve Bank of Peru (Banco Central de Reserva-BCRP). Notably, the January and February surpluses ranked as the highest and third-highest monthly balances on record, respectively. As a result, the 12-month rolling trade surplus rose to USD 38.9bn, reflecting a particularly favourable external environment, driven by elevated export prices and lower import costs.
Terms of Trade at Historically Elevated Levels
The strong outcome in early 2026 was mainly explained by a sharp improvement in the terms of trade (ToT, chart 4). As of February, the ToT index increased 36.2% y/y, extending the upward trend observed since February 2023. This improvement was almost entirely driven by a surge in export prices, which rose 35.2% y/y, led by higher prices for gold and copper. These commodities continue to benefit from heightened global uncertainty and from structural demand linked to the energy transition.
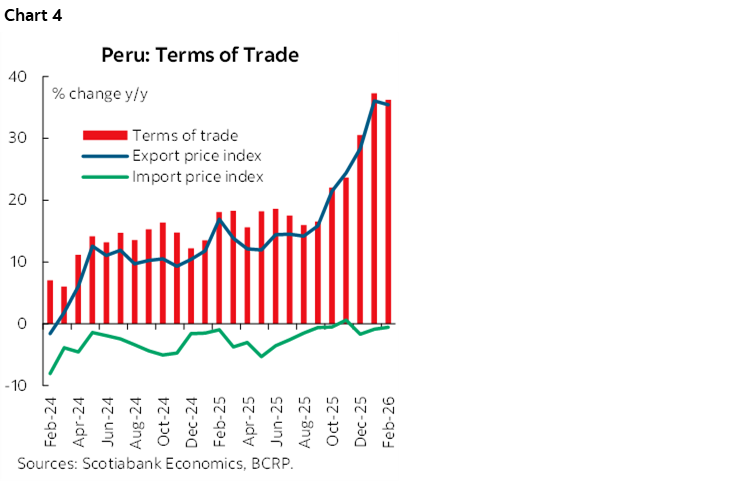
In contrast, import prices declined slightly in February (-0.6% y/y), marking the third consecutive month of declines. This was largely driven by lower oil and fuel prices, prior to the escalation of energy-related risks associated with the Middle East conflict. Together, higher export prices and lower import prices provided a combined positive impulse to the trade balance. Consequently, the ToT index stood close to 202 points (2007=100) in February, its highest level on record. Looking ahead, we expect some moderation in the ToT in the coming months, amid a projected slowdown in global economic activity associated with ongoing geopolitical tensions.
2026 Trade Balance Outlook: Wider Surplus Supported by Exports
For 2026, we project the trade surplus to reach USD 43bn, around 24% higher than in 2025. On the export side, in addition to higher prices, we also expect larger shipment volumes of non-traditional exports, particularly in agro-exports (avocados and blueberries) and fisheries (giant squid). This improvement would be partially offset by higher import volumes of consumer goods, intermediate inputs and capital goods, in line with the continued recovery in domestic demand.
Exports: Growth Driven Primarily by Prices
As of February, total exports amounted to USD 18.8bn, up 37.6% y/y. This strong expansion was largely explained by the price effect, with export prices rising 48.7%, while export volumes posted a more modest increase (+0.6%), according to the BCRP.
Traditional Exports: Strong Boost from Metal Prices
Traditional exports reached USD 15.0bn in February, marking a 49% y/y increase. This performance was driven almost entirely by higher prices (+49%), particularly for gold, copper and silver, while export volumes remained broadly unchanged (+0.6%).
By segment, mining exports surged 59% y/y, with gold and copper accounting for over 89% of the increase in total export values. Average prices during Jan–Feb rose 52.3% for copper, 74.2% for gold and 167.4% for silver, significantly boosting export revenues. In addition, coffee exports increased 72% y/y, supported by both higher international prices and larger shipment volumes.
Non-Traditional Exports: Uneven Performance Across Sectors
Non-traditional exports increased 3.9% y/y in Jan-Feb, remaining in positive territory. Growth was mainly driven by a 3.6% increase in export volumes, while average prices remained broadly stable.
The strongest performance was observed in non-traditional fisheries, where export volumes surged by nearly 110%, reflecting the recovery in giant squid shipments. Agricultural exports also expanded, with volumes up 7.7%, particularly for avocados, pomegranates and blueberries. In contrast, the textile sector contracted by 11% y/y, reflecting a still-challenging external environment, with lower shipment volumes to the United States, Canada and Colombia.
Imports: Recovery Reflects Strengthening Domestic Demand
Imports amounted to USD 10.0bn as of February, increasing 9% y/y, mainly driven by higher import volumes.
Capital goods imports rose nearly 18% y/y in Jan–Feb, in line with the gradual recovery in private investment, which has expanded for eight consecutive quarters through 4Q25. This increase was led by higher imports of construction materials (+48%). Meanwhile, consumer goods imports grew by close to 17% y/y, driven by a sharp rise in durable goods imports (+37.5%), reflecting stronger vehicle purchases consistent with recent record sales of new vehicles.
However, imports of intermediate goods declined slightly (-1%). While industrial inputs increased in volume, this was offset by lower fuel imports due to lower average prices, prior to the late-February rise in oil prices following the escalation of geopolitical tensions involving the United States, Israel and Iran. Finally, food imports declined, reflecting both lower volumes—particularly rice, sugar and dairy products—and lower average prices.
—Carlos Asmat
DISCLAIMER
This report has been prepared by Scotiabank Economics as a resource for the clients of Scotiabank. Opinions, estimates and projections contained herein are our own as of the date hereof and are subject to change without notice. The information and opinions contained herein have been compiled or arrived at from sources believed reliable but no representation or warranty, express or implied, is made as to their accuracy or completeness. Neither Scotiabank nor any of its officers, directors, partners, employees or affiliates accepts any liability whatsoever for any direct or consequential loss arising from any use of this report or its contents.
These reports are provided to you for informational purposes only. This report is not, and is not constructed as, an offer to sell or solicitation of any offer to buy any financial instrument, nor shall this report be construed as an opinion as to whether you should enter into any swap or trading strategy involving a swap or any other transaction. The information contained in this report is not intended to be, and does not constitute, a recommendation of a swap or trading strategy involving a swap within the meaning of U.S. Commodity Futures Trading Commission Regulation 23.434 and Appendix A thereto. This material is not intended to be individually tailored to your needs or characteristics and should not be viewed as a “call to action” or suggestion that you enter into a swap or trading strategy involving a swap or any other transaction. Scotiabank may engage in transactions in a manner inconsistent with the views discussed this report and may have positions, or be in the process of acquiring or disposing of positions, referred to in this report.
Scotiabank, its affiliates and any of their respective officers, directors and employees may from time to time take positions in currencies, act as managers, co-managers or underwriters of a public offering or act as principals or agents, deal in, own or act as market makers or advisors, brokers or commercial and/or investment bankers in relation to securities or related derivatives. As a result of these actions, Scotiabank may receive remuneration. All Scotiabank products and services are subject to the terms of applicable agreements and local regulations. Officers, directors and employees of Scotiabank and its affiliates may serve as directors of corporations.
Any securities discussed in this report may not be suitable for all investors. Scotiabank recommends that investors independently evaluate any issuer and security discussed in this report, and consult with any advisors they deem necessary prior to making any investment.
This report and all information, opinions and conclusions contained in it are protected by copyright. This information may not be reproduced without the prior express written consent of Scotiabank.
™ Trademark of The Bank of Nova Scotia. Used under license, where applicable.
Scotiabank, together with “Global Banking and Markets”, is a marketing name for the global corporate and investment banking and capital markets businesses of The Bank of Nova Scotia and certain of its affiliates in the countries where they operate, including; Scotiabank Europe plc; Scotiabank (Ireland) Designated Activity Company; Scotiabank Inverlat S.A., Institución de Banca Múltiple, Grupo Financiero Scotiabank Inverlat, Scotia Inverlat Casa de Bolsa, S.A. de C.V., Grupo Financiero Scotiabank Inverlat, Scotia Inverlat Derivados S.A. de C.V. – all members of the Scotiabank group and authorized users of the Scotiabank mark. The Bank of Nova Scotia is incorporated in Canada with limited liability and is authorised and regulated by the Office of the Superintendent of Financial Institutions Canada. The Bank of Nova Scotia is authorized by the UK Prudential Regulation Authority and is subject to regulation by the UK Financial Conduct Authority and limited regulation by the UK Prudential Regulation Authority. Details about the extent of The Bank of Nova Scotia's regulation by the UK Prudential Regulation Authority are available from us on request. Scotiabank Europe plc is authorized by the UK Prudential Regulation Authority and regulated by the UK Financial Conduct Authority and the UK Prudential Regulation Authority.
Scotiabank Inverlat, S.A., Scotia Inverlat Casa de Bolsa, S.A. de C.V, Grupo Financiero Scotiabank Inverlat, and Scotia Inverlat Derivados, S.A. de C.V., are each authorized and regulated by the Mexican financial authorities.
Not all products and services are offered in all jurisdictions. Services described are available in jurisdictions where permitted by law.