- Colombia: Further correction of external imbalance in Q2-23 in line with strong slowing of domestic demand
- Peru: July GDP to show low but positive growth... Probably
Overnight trading had an overall risk-off feel to it on weak Chinese and Eurozone PMIs that has left the USD stronger (with decent gains) against all major FX—with high-beta ex MXN underperforming—as USTs reopen with a bear steepening bias with 10s rising past 4.20%. US equity futures are down about 0.2%, coming back from overnight lows in the last couple of hours, but the move more pronounced in European hours, but leaving behind Asian bourses that retraced a large share of Monday’s rally.
WTI crude oil is about 0.5% lower, partly due to radio-silence from Saudi Arabia on cuts extension, but metals are mixed (copper down 1%, iron ore up 0.4%). It’s a relatively quiet day ahead in the G10 space, only the release of US factory orders and durable goods revisions on tap alongside ECB speakers.
In Latam, we have July Brazilian industrial production figures (seen declining in y/y and m/m terms) at 8ET as well as a collection of vehicle sales/exports/production data from Brazil and Mexico over the day. The results of the Citibanamex survey of economists in Mexico will also be published this afternoon, but eyes will be on the main event of the day, the BCCh’s decision.
At 17ET, Chile’s central bank will deliver another large interest rate cut. The median economist polled by Bloomberg sees the BCCh lowering its reference rate by 75bps to 9.50%, downshifting from the full-point reduction with which it started the cycle in late-July—though a 100bps cut will likely still be discussed as an option in today’s meeting. Note that 9 of 22 analysts surveyed by Bloomberg anticipate a 100bps cut. The BCCh will publish updated forecasts in its Monetary Policy Report tomorrow, which should see an upward revision to 2023 GDP growth after last week’s strong July GDP data (see here).
For the first time since September 2022, the bank’s benchmark rate will be in single digits, though will remain much too elevated, particularly in relation to actual and expected inflation. Assuming a 75bps cut, the real policy rate (nominal minus BCCh traders’ survey 12mth ahead forecast) would only fall to ~5.85%, or about 4ppts above where it sat in August 2022 in real terms (+1.85%, when the nominal rate was last below 10%). We’ll focus on guidance regarding the size of future cuts, which will also be guided by Friday’s August CPI data.
Our economists in Chile would not rule out dissenters in today’s decision, and note three points in favour of a 100bps cut: 1) it would maintain greater freedom in mon-pol in case the economy weakens more than anticipated in the MPR, 2) a long wait between today’s meeting and the first of Q4 (Oct 26) where August monthly economic activity could reverse the surprising strength in July, and 3) the median of the latest economic expectations survey—that the BCCh closely watches—sees a 100bps cut.
In favour of a 75bps cut, our team thinks: 1) it would not surprise swaps markets nor traders polled by the BCCh that see a 75bps cut as the most likely, 2) July activity figures would suggest the economy is ‘resisting’ the high policy rate level, 3) the July meeting minutes noted that subsequent hikes “could be smaller”, a message highlighted by BCCh head Costa, and 4) although a 100bps cut provides greater freedom, it is possible to offset the ‘loss’ of freedom from doing a 75bps cut by doing more of these.
—Juan Manuel Herrera
COLOMBIA: FURTHER CORRECTION OF EXTERNAL IMBALANCE IN Q2-23 IN LINE WITH STRONG SLOWING OF DOMESTIC DEMAND
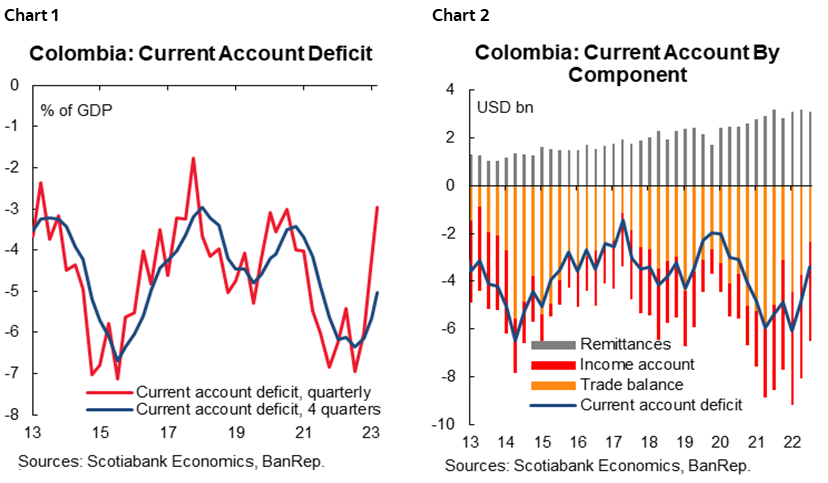
On Friday, BanRep released Q2-2023 balance of payments data. The current account deficit stood at USS 2.52 billion (3% of GDP), the lowest since Q3-2020, showing further correction of the external imbalance. Imports contracted by 4.22% q/q and 18.2% y/y, which reflects the economic activity slowdown. In fact, trade balance (goods and services) shrinks by 8.9% q/q and 32% y/y to -USS2.144 billion. Although we haven’t changed our current account forecast for the year of 4% of GDP, later results put some downward bias and affirm that Colombian economy is correcting its imbalances helping asset pricing to return to long run trends.
External accounts results demonstrate again that in Colombia the deficit reacts to the economic activity, while it has an endogenous financing. In fact, Financing came mainly from FDI, increasing by 23.3% q/q and +3.07% y/y. FDI inflows represented 200% the 2Q-2023 current account deficit, and investments were concentrated in the mining and oil sectors, manufacturing, and financial services. All in all, the previous result affirms our call for rate stability in Banrep’s September 29 meeting. On the FX side, a significantly lower external deficit will also consolidate the lower exchange rate that Colombia has experienced for the last couple of months.
Twin deficits, especially the structurally high current account deficit, have been the weakest fundamental for the Colombian economy. Having said that, 2023 is proving that the external deficit responds to the economic activity dynamic and has shown that Colombian economic activity has its own stabilizers that are working to ensure long run sustainability. In fact, the narrowing of the deficit was stronger than expected by market consensus, while the financing is healthy since is concentrated in FDI.
The COP has appreciated more than 16% during the year, and the lower external deficit contributes to reducing the possibility of a strong depreciation. Imports are decreasing significantly, while services exports remain close to historical highs.
Current account:
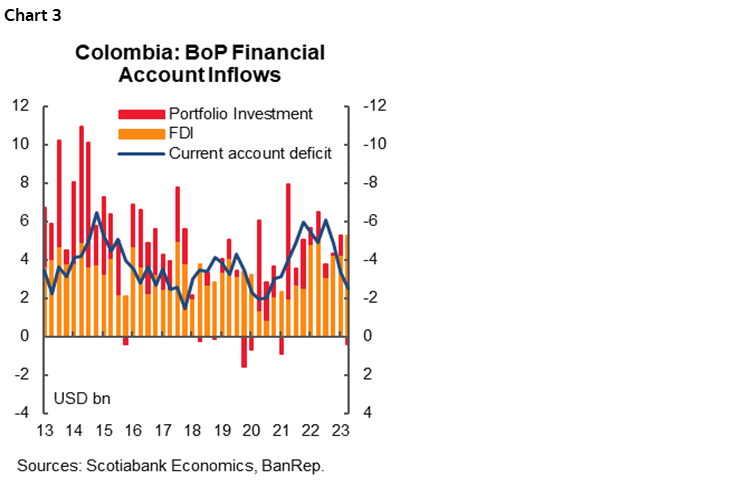
- In Q2-2023, the current account deficit stood at USD 2.52 bn (3% of GDP, chart 1). The deficit was 25.4% lower than the Q1-2023 current account deficit. In absolute terms, the main source of the current account deficit was, again, the net outflows in the income account (USD 3.4 bn) due to payments to companies with FDI (chart 2). The trade deficit was the second main contributor; however, it fell by 31.9% y/y and 8.9% q/q. Net transfers remain at a high level amid still strong remittances inflows.
- Trade balance:
- In 2Q-2023, total exports contracted by 3.57% q/q showing a reduction in goods, which reflects weaker commodity prices and in a lesser extend due to lower exported volume. It is important to say that services exports remain close to their historical high, especially related to the IT sector such as call centers, and consultancy services, among others. On the other side, structural weaker peso with respect to pre-pandemic times and the total reopening are reflected in higher touristic activity.
- Imports reflected the main response to the economic slowdown. It contracted by 4.2% q/q and 18.2% y/y. Reaching the weakest level since Q3-2021. According to DANE’s statistics. Imports are weakening especially on capital goods and raw materials.
- The trade deficit in Q2-2023 stood at USD 2.14 bn, the lowest level since early 2018, shrinking by USD 1, bn vs the previous year (-31,9% y/y).
- Income account: Net outflows stood at USD 3.4bn. Compared with the previous year, it is showing lower outflows, although still the higher source of outflows in the current account due to earnings payments to foreign companies with FDI in Colombia. The other big component that takes higher income account net outflows was interest payment (USS273mn).
- Net current transfer inflows stood at USD 3.0 bn in Q2-2022, remaining at historically high levels but moderating around 2.5% versus the previous quarter. Remittances stood at USD 2,3 bn very similar to 2Q-2022 and to past quarter, which represents 2,7% of GDP and 11,4% of total current inflows in the BoP.
Financial Balances
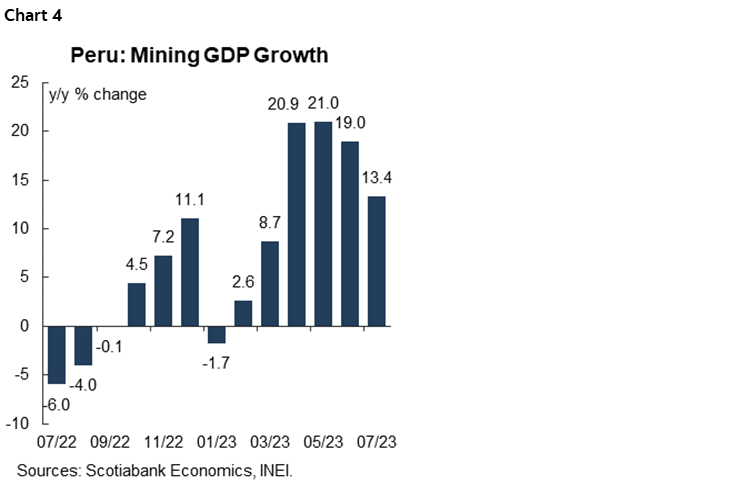
The financial account registered net inflows of USD 2.8 bn. The FDI continues the main source of current account financing. In fact, during 2Q-2023 FDI inflows was USS5.3bn, while outflows due to Colombians investing abroad fell to USS420mn, which reflects better perception of domestics to the Colombian economy. As Said above, the current account deficit financing came mainly from the FDI (chart 3), which totaled net inflows of USD 5.3 bn, 3% y/y and 23% q/q. Net portfolio investment was negative, during 2Q-2023 exited USS 420mn due to portfolio investment. Either way, it is good news to see that most of the financing comes from FDI.
- Foreign Direct Investment: In Q1-2023, FDI inflows stood at USD 5.2 bn (6.1% of GDP). FDI was allocated 59.6% in the oil and mining sector, 10.1% in manufacturing, 8.8% in commerce and hotels, 8.1% in financial services, 6.6% in transport, and 6.8% in other sectors.
- Capital Investment: Net capital investments registered outflows of 420 million (0.5% of GDP). Although portfolio investment wasn’t relevant this quarter, it shows the lower appetite that offshore agents has to the EM due to the higher for longer policy from the Fed.
—Sergio Olarte, Jackeline Piraján & Santiago Moreno
PERU: JULY GDP TO SHOW LOW BUT POSITIVE GROWTH… PROBABLY
Early growth indicators for July were released over the weekend for mining GDP, oil & gas production, fishing GDP, and cement consumption.
Mining GDP rose 13.4% y/y in July (chart 4). This was good. But not quite as good as the past few months. Between April and June, mining growth had averaged 20.3% y/y. Given a low 2022 base, it seemed quite reasonable to expect a similar figure in July. This was not to be and so the mining GDP growth that was released was, contradictorily, both quite robust and also a mild disappointment.
Oil & Gas growth was -1.6% y/y, but this is in line with expectations. The sector has seen low to negative monthly growth rates over the past twelve months. Peru is not an oil & gas country, and oil production in the rainforest in particular has been prone to interruptions.
Fishing GDP fell a spectacular 48% y/y in July. One can thank El Niño for that. And yet there is no need to worry too much, as July is not a main fishing season month, and the magnitude of the decline was actually a nudge better than expected.
Cement consumption fell 6.1% y/y, in July, which was also within expectations (chart 5). More importantly, it represented the best result (lowest decrease) since November 2022. Monthly declines from January to June this year were between 11% and 16%, so it’s actually comforting to finally have gotten out of double-digit negative growth territory.
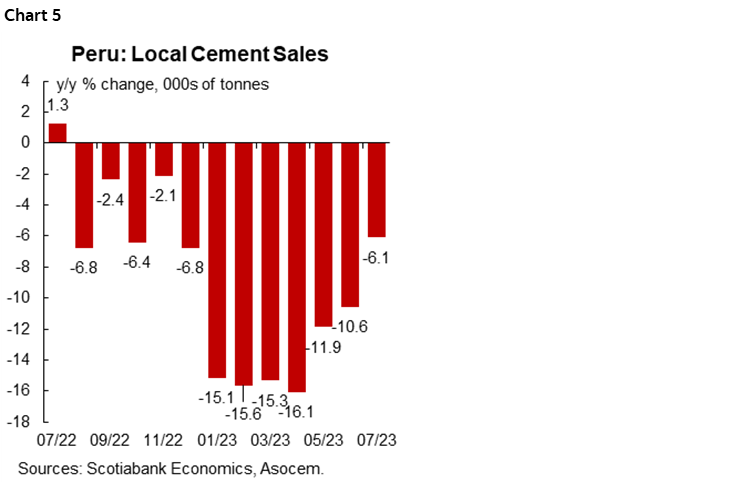
What all this mean for our July growth expectations is that GDP growth in July is likely to come in below our forecast of 1%, perhaps closer to 0.5%. All the negative data that has been released has been in line with expectations, while the only truly positive growth number, mining (13.4% y/y) was a few points lower than our expectations.
Our concern is that July GDP is too close to nil or even slightly negative growth for comfort. Ministry of Finance officials have stated their confidence that GDP growth in July will be positive, and we hope they are right, but this will depend on industrial GDP growth, which has been erratically negative of late.
—Guillermo Arbe
DISCLAIMER
This report has been prepared by Scotiabank Economics as a resource for the clients of Scotiabank. Opinions, estimates and projections contained herein are our own as of the date hereof and are subject to change without notice. The information and opinions contained herein have been compiled or arrived at from sources believed reliable but no representation or warranty, express or implied, is made as to their accuracy or completeness. Neither Scotiabank nor any of its officers, directors, partners, employees or affiliates accepts any liability whatsoever for any direct or consequential loss arising from any use of this report or its contents.
These reports are provided to you for informational purposes only. This report is not, and is not constructed as, an offer to sell or solicitation of any offer to buy any financial instrument, nor shall this report be construed as an opinion as to whether you should enter into any swap or trading strategy involving a swap or any other transaction. The information contained in this report is not intended to be, and does not constitute, a recommendation of a swap or trading strategy involving a swap within the meaning of U.S. Commodity Futures Trading Commission Regulation 23.434 and Appendix A thereto. This material is not intended to be individually tailored to your needs or characteristics and should not be viewed as a “call to action” or suggestion that you enter into a swap or trading strategy involving a swap or any other transaction. Scotiabank may engage in transactions in a manner inconsistent with the views discussed this report and may have positions, or be in the process of acquiring or disposing of positions, referred to in this report.
Scotiabank, its affiliates and any of their respective officers, directors and employees may from time to time take positions in currencies, act as managers, co-managers or underwriters of a public offering or act as principals or agents, deal in, own or act as market makers or advisors, brokers or commercial and/or investment bankers in relation to securities or related derivatives. As a result of these actions, Scotiabank may receive remuneration. All Scotiabank products and services are subject to the terms of applicable agreements and local regulations. Officers, directors and employees of Scotiabank and its affiliates may serve as directors of corporations.
Any securities discussed in this report may not be suitable for all investors. Scotiabank recommends that investors independently evaluate any issuer and security discussed in this report, and consult with any advisors they deem necessary prior to making any investment.
This report and all information, opinions and conclusions contained in it are protected by copyright. This information may not be reproduced without the prior express written consent of Scotiabank.
™ Trademark of The Bank of Nova Scotia. Used under license, where applicable.
Scotiabank, together with “Global Banking and Markets”, is a marketing name for the global corporate and investment banking and capital markets businesses of The Bank of Nova Scotia and certain of its affiliates in the countries where they operate, including; Scotiabank Europe plc; Scotiabank (Ireland) Designated Activity Company; Scotiabank Inverlat S.A., Institución de Banca Múltiple, Grupo Financiero Scotiabank Inverlat, Scotia Inverlat Casa de Bolsa, S.A. de C.V., Grupo Financiero Scotiabank Inverlat, Scotia Inverlat Derivados S.A. de C.V. – all members of the Scotiabank group and authorized users of the Scotiabank mark. The Bank of Nova Scotia is incorporated in Canada with limited liability and is authorised and regulated by the Office of the Superintendent of Financial Institutions Canada. The Bank of Nova Scotia is authorized by the UK Prudential Regulation Authority and is subject to regulation by the UK Financial Conduct Authority and limited regulation by the UK Prudential Regulation Authority. Details about the extent of The Bank of Nova Scotia's regulation by the UK Prudential Regulation Authority are available from us on request. Scotiabank Europe plc is authorized by the UK Prudential Regulation Authority and regulated by the UK Financial Conduct Authority and the UK Prudential Regulation Authority.
Scotiabank Inverlat, S.A., Scotia Inverlat Casa de Bolsa, S.A. de C.V, Grupo Financiero Scotiabank Inverlat, and Scotia Inverlat Derivados, S.A. de C.V., are each authorized and regulated by the Mexican financial authorities.
Not all products and services are offered in all jurisdictions. Services described are available in jurisdictions where permitted by law.