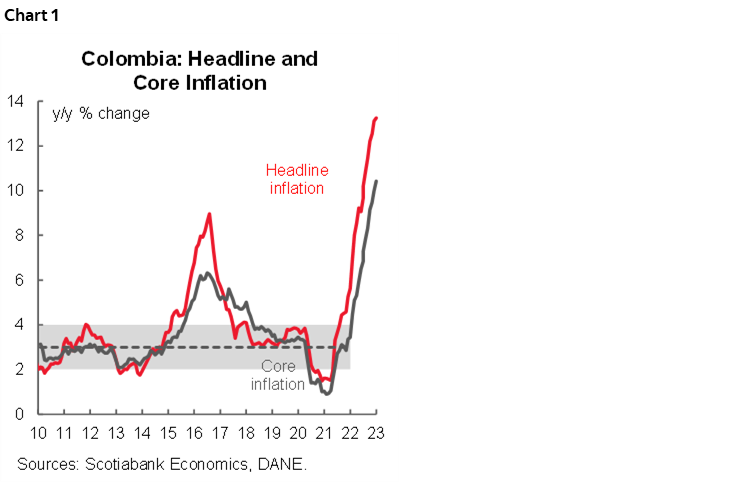
- Colombia: Headline inflation reached 13.25%, reflecting strong indexation effects but also showing signs of stabilization
The global market mood remains fragile after Friday’s massive US nonfarm payrolls print, with US-China tensions likely adding to negativity in Asia, ahead of a quiet session today with little of note on the calendar. SPX futures are off about 0.8%, in line with FTSE losses while ESX sheds 1.5%+, crude oil is moderately higher by 0.5% against copper down 0.5% and iron ore down 1.5%.
Over the weekend, Colombia’s statistics agency released CPI data that showed a lower than expected pace of headline inflation (see below), though our economists expect BanRep to follow its January 75bps hike with a final 25bps increase in March. We’re monitoring social unrest in Colombia as President Petro called on Friday for marches in support of his health reform plans (with limited details presented to date) ahead of an address in Bogota scheduled for the 14th.
The day ahead is quiet in the Latam region as we look to the week’s key events: Chilean CPI on Wednesday, and a packed Thursday with Mexican and Brazilian CPI releases, and Banxico (+25bps) and BCRP (+25bps) rate decisions. See more in Friday’s Latam Weekly. Off-calendar risks will also feature in protests in Peru (after Congress blocked until August debate on early elections) and Lula’s run-ins with the BCB (he speaks at multiple events today).
—Juan Manuel Herrera
COLOMBIA: HEADLINE INFLATION REACHED 13.25%, REFLECTING STRONG INDEXATION EFFECTS BUT ALSO SHOWING SIGNS OF STABILIZATION
Colombia’s rate of monthly CPI inflation was 1.78% m/m in January (non-seasonally adjusted), according to DANE data released on Saturday, February 4. The monthly increase in January represented the highest inflation reading in Colombia since 2001.
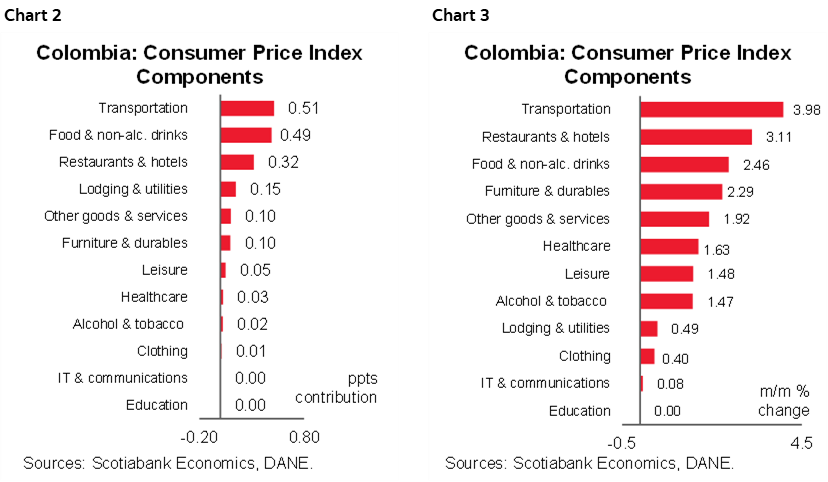
The result was above that projected in BanRep survey’s (1.63% m/m), below recent surveys (Bloomberg: 1.87% m/m), and above Scotiabank Economics’ projection of 1.63% m/m. Transport and food inflation accounted for 56% of the total rise in prices, increasing by 3.98% m/m (0.51ppts contribution) and 2.46% m/m (0.49ppts contribution), respectively.
Year-on-year inflation rose from 13.12% in December to 13.25% in January (chart 1), reaching a new high since March 1999. However, this was the slowest year-on-year CPI increase since May 2022 as statistical base effects, especially in food prices, contribute to reaching a ceiling. Core inflation (ex food) increased from 9.99% to 10.43% y/y, with an elevated acceleration compared to the previous month. Inflation ex-food and regulated prices went from 9.51% to 9.78% y/y, in turn exhibiting its slowest acceleration in seven months.
January’s inflation reflected the strong impact of indexation effects in Colombia. Despite the government freezing some regulated tariffs, this was not enough to contain overall indexation effects. Instead, the government’s actions added to fiscal pressures; a notable example is the freezing of toll charges that at a COP600bn cost per year. In February, monthly inflation will continue to show indexation effects, especially in education fees. In any case, statistical base effects will continue helping annual inflation to reach a ceiling, but remaining elevated.
That said, inflation data reinforce expectations of a potential final rate hike of 25bps on March 31st. There is still a chance that inflation will reach a ceiling in Q1-2023, mainly due to a historically-high statistical base level. If inflation starts to decelerate in February (February CPI will be released on March 4th, thus before the March meeting), BanRep may be allowed to consider a pause at the March meeting. Additionally, economic activity deceleration is also relevant for anticipating a pause from BanRep. Therefore, the next relevant milestone to keep an eye on is the Q4-2022 GDP release on February 15th.
Looking at January’s numbers in detail, all twelve topline components of the CPI basket contributed positively to monthly inflation (charts 2 and 3).
Highlights:
- The transport group was the main contributor to monthly inflation, showing a 3.98% m/m figure, resulting in a contribution of 0.51ppts to overall inflation. The transport group reflected the increase in public transport system fees which increased in main cities, mostly aligned with the previous year’s inflation of ~13%.
The transportation group also accounts for higher vehicle prices (+2.41% m/m), which posted the highest monthly variation since 2015, probably responding to the FX depreciation. Additionally, gasoline prices increase also contribute to the upside pressure.
It is worth noting that the Government froze tolls fees; however, the potential contribution of a regular increase in those prices would have contributed only 2bps to the overall inflation. It demonstrates that natural indexation effects woes beyond the possibilities of regulation by the Government.
- Foodstuff inflation was the second main contributor (+2.46% m/m and 0.49ppts contribution). Although inflation remained elevated, statistical base effects contribute to moderate annual food inflation. We expect this to continue in the forthcoming months.
- During January, food prices continued showing the impact of the atypical strong rainy season on the productivity of the agriculture sector. On the other side, landslides on the roadblock of a relevant food producer zone in Colombia also impacted the prices in January. However, it was not enough to surpass the record high inflation of the previous year.
In January, price gain was led by milk (+3.74% m/m), bananas (+10.67% m/m), potatoes (+8.84 % m/m), onion (+12.57% m/m) and tomatoes (+12.78% m/m). Only two out of the 59 food items contracted during the month: yucca(-0.93% m/m) and seasonings (-3.10% m/m).
Despite the still challenging context for the agriculture due to high input prices, climate, and bottlenecks due to landslides, we think that statistical base effects will continue contributing to stabilizing annual inflation in this group.
- The third most significant contributor to headline inflation (+0.32ppts) was the restaurant and hotels group (+3.11% m/m). Restaurants’ inflation usually reflects the passing of input costs (food), but January also reflects the indexation effect to the minimum wage, as it is a labor-intensive activity. On the other side, hotel inflation (+3.93% m/m) showed the impact of regional festivals that resumed celebrations for the first time since the pandemic began.
- Housing and Utilities contributed 0.15ppts to the overall figure (+0.49% m/m). Rent fees increased the most in recent years, reflecting indexation effects to the previous year’s inflation. In the case of utilities, electricity fees (+0.71% m/m) contribute the most to the overall figure.
- In January, goods inflation fell from 15.04% to 14.38%, the first moderation in one year, while services sectors continued pointing north accelerating from 7.41% to 8%. Regulated prices accelerated to 12.81% y/y from the previous 11.77% y/y last month due to higher public transport fees.
- The inflation for the low-income population stood at 14.76% y/y, well above the country average of 13.25% y/y. In February, the Government will present a budget addition of COP25tn, which probably will focus on subsidies to the low-income population.
—Sergio Olarte, María (Tatiana) Mejía & Jackeline Piraján
DISCLAIMER
This report has been prepared by Scotiabank Economics as a resource for the clients of Scotiabank. Opinions, estimates and projections contained herein are our own as of the date hereof and are subject to change without notice. The information and opinions contained herein have been compiled or arrived at from sources believed reliable but no representation or warranty, express or implied, is made as to their accuracy or completeness. Neither Scotiabank nor any of its officers, directors, partners, employees or affiliates accepts any liability whatsoever for any direct or consequential loss arising from any use of this report or its contents.
These reports are provided to you for informational purposes only. This report is not, and is not constructed as, an offer to sell or solicitation of any offer to buy any financial instrument, nor shall this report be construed as an opinion as to whether you should enter into any swap or trading strategy involving a swap or any other transaction. The information contained in this report is not intended to be, and does not constitute, a recommendation of a swap or trading strategy involving a swap within the meaning of U.S. Commodity Futures Trading Commission Regulation 23.434 and Appendix A thereto. This material is not intended to be individually tailored to your needs or characteristics and should not be viewed as a “call to action” or suggestion that you enter into a swap or trading strategy involving a swap or any other transaction. Scotiabank may engage in transactions in a manner inconsistent with the views discussed this report and may have positions, or be in the process of acquiring or disposing of positions, referred to in this report.
Scotiabank, its affiliates and any of their respective officers, directors and employees may from time to time take positions in currencies, act as managers, co-managers or underwriters of a public offering or act as principals or agents, deal in, own or act as market makers or advisors, brokers or commercial and/or investment bankers in relation to securities or related derivatives. As a result of these actions, Scotiabank may receive remuneration. All Scotiabank products and services are subject to the terms of applicable agreements and local regulations. Officers, directors and employees of Scotiabank and its affiliates may serve as directors of corporations.
Any securities discussed in this report may not be suitable for all investors. Scotiabank recommends that investors independently evaluate any issuer and security discussed in this report, and consult with any advisors they deem necessary prior to making any investment.
This report and all information, opinions and conclusions contained in it are protected by copyright. This information may not be reproduced without the prior express written consent of Scotiabank.
™ Trademark of The Bank of Nova Scotia. Used under license, where applicable.
Scotiabank, together with “Global Banking and Markets”, is a marketing name for the global corporate and investment banking and capital markets businesses of The Bank of Nova Scotia and certain of its affiliates in the countries where they operate, including; Scotiabank Europe plc; Scotiabank (Ireland) Designated Activity Company; Scotiabank Inverlat S.A., Institución de Banca Múltiple, Grupo Financiero Scotiabank Inverlat, Scotia Inverlat Casa de Bolsa, S.A. de C.V., Grupo Financiero Scotiabank Inverlat, Scotia Inverlat Derivados S.A. de C.V. – all members of the Scotiabank group and authorized users of the Scotiabank mark. The Bank of Nova Scotia is incorporated in Canada with limited liability and is authorised and regulated by the Office of the Superintendent of Financial Institutions Canada. The Bank of Nova Scotia is authorized by the UK Prudential Regulation Authority and is subject to regulation by the UK Financial Conduct Authority and limited regulation by the UK Prudential Regulation Authority. Details about the extent of The Bank of Nova Scotia's regulation by the UK Prudential Regulation Authority are available from us on request. Scotiabank Europe plc is authorized by the UK Prudential Regulation Authority and regulated by the UK Financial Conduct Authority and the UK Prudential Regulation Authority.
Scotiabank Inverlat, S.A., Scotia Inverlat Casa de Bolsa, S.A. de C.V, Grupo Financiero Scotiabank Inverlat, and Scotia Inverlat Derivados, S.A. de C.V., are each authorized and regulated by the Mexican financial authorities.
Not all products and services are offered in all jurisdictions. Services described are available in jurisdictions where permitted by law.