- Colombia: Inflation surprised again on the upside and now is above 4%; we affirm our view of a 25 bps hike in September’s BanRep meeting
- Mexico: Gross fixed investment and private consumption decline; mixed signals from the auto sector
- Peru: Growth and foreign trade figures continue to be strong in July
COLOMBIA: INFLATION SURPRISED AGAIN ON THE UPSIDE AND NOW IS ABOVE 4%; WE AFFIRM OUR VIEW OF A 25 BPS HIKE IN SEPTEMBER’S BANREP MEETING
Monthly CPI inflation was 0.45% m/m in August 2021, according to DANE data published on Saturday, September 4. This result is well above the median forecast in BanRep’s survey (0.19% m/m), Bloomberg’s survey (0.19% m/m), and Scotiabank Economics’ projection (0.21% m/m). Foodstuff, restaurants, and hotels led the increase in prices, contributing 28 bps to the overall figure. Only one component of the overall index fell, suggesting that Colombia is experiencing a generalized adjustment in prices stemming from the consolidation of the economic recovery.
August’s CPI result brings annual headline inflation to 4.40% y/y, up from 3.97% y/y in July (chart 1), above the ceiling of BanRep’s target range (2%–4%), and the highest since mid-2016. While this outcome nudges our current 4.40% forecast for December 2021 to the upside, our inflation expectation remains anchored close to 3% in the medium term.
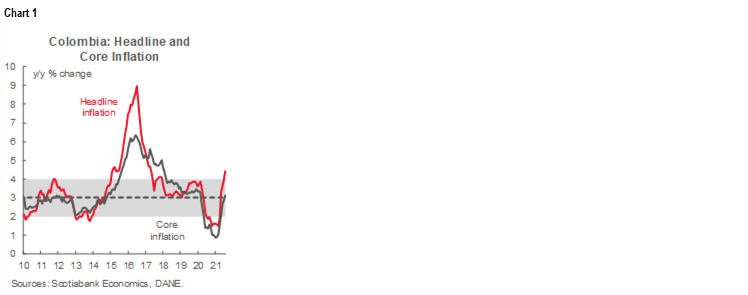
Core inflation metrics remained close to the 3% target. Inflation ex-food stood at 3.11% (increasing from 2.86% y/y in July) and ex-food and regulated goods inflation was 2.32% y/y (increasing from the 2.05% in the previous month), which affirms our expectation of a 25 bp hike in the next BanRep’s meeting. However, if headline inflation continues deviating from the target range in coming months, the BanRep Board would likely be motivated to accelerate the pace of policy normalization.
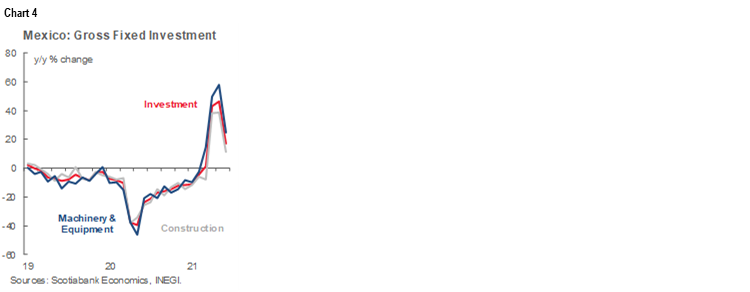
Looking at the August numbers in detail, only 1 of 12 sectors fell (charts 2 and 3). We also see clues that could, if sustained, could lead the central bank Board to hike more aggressively. The main highlights are:
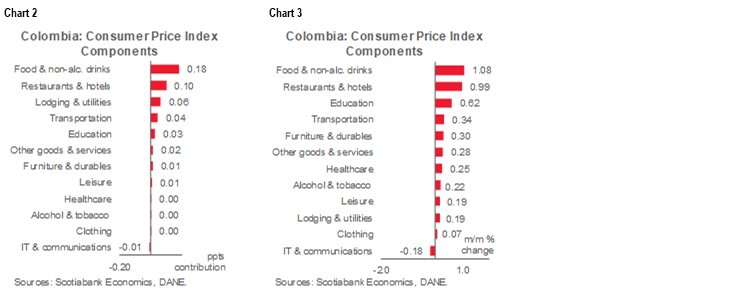
- Foodstuffs inflation had the largest contribution (18 bps and 1.08% m/m). Increases in the price of meat, chicken, fruits and bananas explain two-thirds of total increase. However, price declines for other key items, such as eggs(-3.53% m/m), rice (-2.66% m/m) and onions (-4.86% m/m), point to some normalization after the significant impact from the nationwide strike. We believe that food prices will moderate in coming months, as local conditions continue to normalize. Having said that, it is not difficult to see sustained inflation lead by foodstuffs motivating a 50 bps hike in the next BanRep meeting.
- Restaurants & Hotels inflation had the second-largest contribution (10 bps and +0.99% m/m). This sector was again affected by higher prices for inputs; however, this impact should diminish as foodstuff inflation moderates.
- Other components of core inflation continued to normalize, showing the effect of the economic recovery:
- The lodging and utility group had the third-largest contribution (6 bps and 0.19% m/m). Rental fees inflation increased 0.16% m/m (same as the previous month), contributing 4 bps to the headline inflation. We highlight that rental fees inflation has returned to its pre-pandemic path without an overshooting effect.
- Educational fees unexpectedly increased as DANE updated some information from technical institutions, which reduced fees in the pandemic and now are normalizing them. In September, we will see an additional effect in this group, reflecting a seasonal effect from the school year.
- IT & Communications inflation fell (-0.18% m/m) owing to lower cellphone prices, while mobile plans fees remained stable.
Looking at annual inflation across major categories, price gains accelerated across the board. For instance, goods inflation increased to 2.73% y/y (versus 2.66% y/y in July), services inflation rose by 34 bps from 1.81% y/y to 2.16% y/y. Regulated-price inflation accelerated by 18 bps to 6.20% y/y, the highest print since March 2019, reflecting normalization after the pandemic effect, which froze relevant prices, but also to some FX pressures on gas fees.
All in all, inflation surprise to the upside looks completely explained by a foodstuff price effect, which we expect to start to moderate in the forthcoming months. That said, we affirm our expectation of a 25 bps hike in September’s BanRep meeting; however, 50 bps hikes could be possible in future meetings if prices continue exceeding the 4% target ceiling. For now, we don’t think the central bank will start its hiking cycle with a 50 bps move because uncertainty remains about the output gap and employment recovery. Most important, current inflation pressures could be transitory and, for now, inflation expectations in the medium-term remain anchored. It is worth noting in this regard that Colombia’s central bank, in recent history, has never started a hiking cycle with a move higher than 25 bps.
—Sergio Olarte & Jackeline Piraján
MEXICO: GROSS FIXED INVESTMENT AND PRIVATE CONSUMPTION DECLINE; MIXED SIGNALS FROM THE AUTO SECTOR
I. Gross fixed investment and private consumption decline for the second time this year
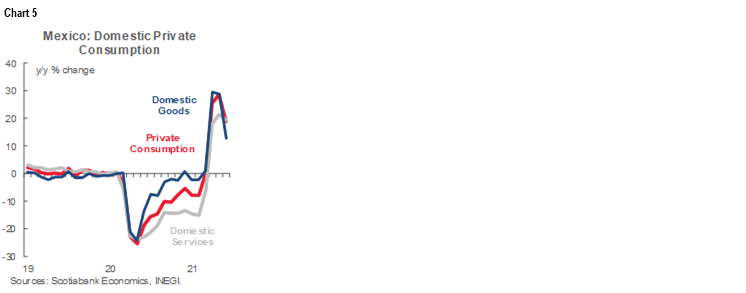
According to data released by the statistical agency, INEGI, gross fixed investment (GFI) for the month of June fell -1.8% m/m—the largest decline observed since September 2020 when the indicator decreased -2.2% m/m (chart 4). The figure comes on the heels of a 0.5% m/m growth observed in May and compares with growth of 23.5% m/m in June of last year, when GFI grew at an unprecedented pace following the re-opening of non-essential activities after a couple of months of confinement. By components, expenditures made in construction decreased -2.9% m/m and total machinery and equipment decreased -0.4% m/m in June.
In terms of annual changes, investment grew 17.1% y/y in June from the 46.5% y/y observed in May, a still-high level that reflects continuing base effects, although these effects are beginning to dissipate. Its main components, construction and machinery and equipment, grew 11.5% y/y (versus 38.6% y/y previously) and 24.5% y/y (versus 58% y/y registered in May), respectively.
Gross fixed investment continues to show signs of weakness and remains below the levels reported before the health emergency. At the same time, producers have remained cautious in their investment decisions and this sentiment is likely to continue throughout 2021.
Private consumption, which contributes approximately 65% to GDP, posted its second monthly decline this year, according to data released by INEGI (chart 5). In June , consumption fell -0.8% m/m after three consecutive months of growth. This figure compares to a 7.4% increase recorded in June of last year, which was driven by the reopening of activities, and comes from a monthly advance of 0.7% m/m observed in May. By components, consumption in goods of imported origin decreased -0.9% m/m and in goods and services of national origin fell -0.5% m/m in June 2021.
On a year-over-year basis, private consumption grew 19.1% y/y from the 28.9% y/y registered in May, still affected by comparison base effects, while in the first six months of the year, the indicator advanced 7.9% y/y.
Although consumer spending moderated at the end of the second quarter of the year, going forward we expect a good dynamism mainly in services associated with lodging, transportation and food, given the reduced restrictions on mobility, and higher public spending, reflecting both the COVID-19 support measures, and the normalization of public education and health services. A risk to our forecast is the higher number of infections observed during July and August.
—Paulina Villanueva
II. Mixed signs in auto industry in August—domestic sales decrease while production rose; yet inputs shortages persisted in August, hindering supply outlook for the rest of the year
August INEGI data for the auto industry showed mixed signs, as domestic sales diminished while production and exports increased, despite continuing chip shortages. Domestic sales went down for the second straight month, -7.4% m/m to -4.8% m/m, in line with recent loss of consumer confidence as COVID-19 cases went up in July and August in a third wave of contagion. Auto sales reached 78,235 units, totalling 681 thousand units in the January-August period, equivalent to a 1.4% y/y increase in August and 16.1% on a year-to-date cumulative basis (chart 6). However, domestic sales were down -31.2% y/y in August and -20.3% in the January–August period in comparison to 2019.
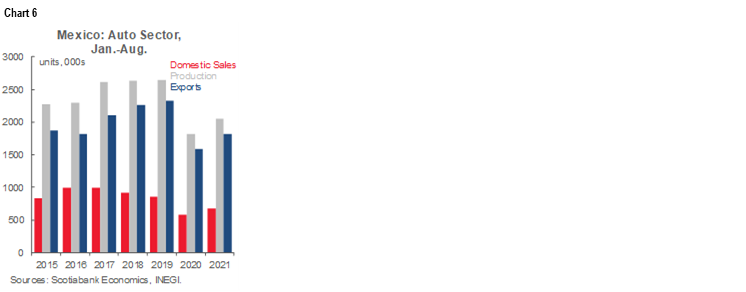
The story is different for auto production and exports, albeit also with significant challenges. Auto production rebounded from a -16.0% m/m decline in July to an increase of 6.9% m/m (237.040 units) in August. On a year-over-year basis, production is down 21.4% as chip scarcity and shortages continue to hinder capacity potential. On a cumulative basis from January to August, production totalled 2.05 million units, representing a 13.3% YTD increase compared to 2020 numbers, but -22.3% below January–August 2019.
Lastly, exports also rebound in August on a month-over-month basis, but significant challenges remain owing to input disruptions, as well as trade disagreements that are worth keeping an eye on. Exports rebounded from a decline of -13.8% m/m in July, increasing 6.9% m/m to total 212,687 units in August. However, low production levels negatively affected exports measured on a year-over-year basis, which fell -19.6%. For January to August, exports summed to 1.82 million units, representing a 5.3% year-to-date increase. Yet, as with production numbers, exports were negatively affected by chip shortages. Exports in August were down -25.7% y/y and -21.9% YTD compared to 2019 numbers.
Looking ahead, exports could lag below potential as chip shortages might remain prevalent for the rest of 2021, hindering supply despite an overall more positive economic outlook. However, on the demand side, auto sales are expected to continue to recover as the labour market returns to pre-pandemic trends and COVID-19-related risks and uncertainty dissipate thanks to lower contagions rates and a higher share of vaccinated population.
Special attention should remain on the recent dispute between US and Mexican governments over the interpretation of the rules of origin in the USMCA agreement. Despite this, possible negative changes in trade rules remain unlikely as both parties continue to show efforts and intentions to negotiate under the USMCA rules.
—Miguel Saldaña
PERU: GROWTH AND FOREIGN TRADE FIGURES CONTINUED STRONG IN JULY
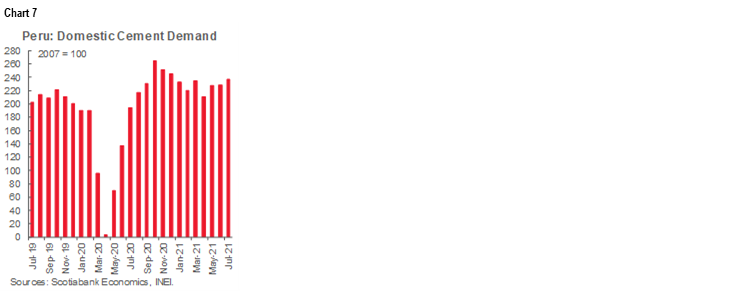
Early indicators of GDP growth were robust in July, according to figures released late last week by the statistical agency, INEI. The highlights included:
- Cement demand was up 22.4% y/y, in July (chart 7). To put this figure into context, considering the partial lockdown still in place in July 2020, this represented an almost equally significant 17% increase over July 2019. Thus, construction continues to be a clear driver of growth over and above the y/y rebound effect.
- Mining (metals) rose 1.6% y/y. This is still a quite modest growth figure.
- Oil & gas fell 13.6%, y/y, mostly owing to lower gas production (-38.6%). Oil output, up 12%, partially offset the decline.
- Fishing plummeted 41.4%, y/y, in July, although this figure is a non-issue, as reflects an off-season for fishmeal fishing.
- Government investment rose a huge 101.5% y/y in July, which also helps explain the strong increase in cement demand. Fiscal current spending was also up, 14.4% y/y. July was the last month before the change in government, and it will be interesting to see if the new Castillo regime kept up the pace in spending in August.
These figures released by INEI suggest that GDP in July could come in higher than our 8% y/y in forecast for the quarter. Looking forward, the low base effect from the lockdown in 2020 is dissipating, and growth should become more representative of what’s really happening with the economy, especially beginning in October.
The trade surplus is on its way to a record year, according to trade figures for July released by the BCRP on September 2 (chart 8). The BCRP reported a USD 922 mn surplus for the month, and a USD 12.5 bn surplus for the past twelve months. This is in line with our expectation of a USD 13.8 bn surplus for full-year 2021, which would constitute an all-time high. The previous trade surplus record was USD 9.2 bn in 2011.
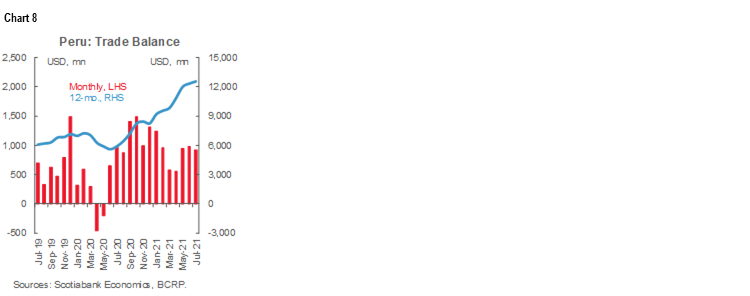
Both exports and imports have been rising strongly. Exports were up 33% y/y for the month of July, and 59% YTD. Imports rose a huge 47% y/y for the month, and 42% YTD.
Mining, of course, was the greatest factor feeding into exports growth, both in total value and in percent increase, up nearly 70% YTD. However, all major export sectors showed robust growth. Note that aggregate exports were up nearly 22% YTD with respect to 2019 pre-COVID-19 levels.
In terms of imports, both capital and intermediate goods imports rose equally, about 48% YTD. Fuel imports surged 80%. However, the increase in capital goods imports was more encouraging, especially as it was across the board. Meanwhile, imports of consumer goods lagged, but still rose a hefty 24% YTD.
—Guillermo Arbe
DISCLAIMER
This report has been prepared by Scotiabank Economics as a resource for the clients of Scotiabank. Opinions, estimates and projections contained herein are our own as of the date hereof and are subject to change without notice. The information and opinions contained herein have been compiled or arrived at from sources believed reliable but no representation or warranty, express or implied, is made as to their accuracy or completeness. Neither Scotiabank nor any of its officers, directors, partners, employees or affiliates accepts any liability whatsoever for any direct or consequential loss arising from any use of this report or its contents.
These reports are provided to you for informational purposes only. This report is not, and is not constructed as, an offer to sell or solicitation of any offer to buy any financial instrument, nor shall this report be construed as an opinion as to whether you should enter into any swap or trading strategy involving a swap or any other transaction. The information contained in this report is not intended to be, and does not constitute, a recommendation of a swap or trading strategy involving a swap within the meaning of U.S. Commodity Futures Trading Commission Regulation 23.434 and Appendix A thereto. This material is not intended to be individually tailored to your needs or characteristics and should not be viewed as a “call to action” or suggestion that you enter into a swap or trading strategy involving a swap or any other transaction. Scotiabank may engage in transactions in a manner inconsistent with the views discussed this report and may have positions, or be in the process of acquiring or disposing of positions, referred to in this report.
Scotiabank, its affiliates and any of their respective officers, directors and employees may from time to time take positions in currencies, act as managers, co-managers or underwriters of a public offering or act as principals or agents, deal in, own or act as market makers or advisors, brokers or commercial and/or investment bankers in relation to securities or related derivatives. As a result of these actions, Scotiabank may receive remuneration. All Scotiabank products and services are subject to the terms of applicable agreements and local regulations. Officers, directors and employees of Scotiabank and its affiliates may serve as directors of corporations.
Any securities discussed in this report may not be suitable for all investors. Scotiabank recommends that investors independently evaluate any issuer and security discussed in this report, and consult with any advisors they deem necessary prior to making any investment.
This report and all information, opinions and conclusions contained in it are protected by copyright. This information may not be reproduced without the prior express written consent of Scotiabank.
™ Trademark of The Bank of Nova Scotia. Used under license, where applicable.
Scotiabank, together with “Global Banking and Markets”, is a marketing name for the global corporate and investment banking and capital markets businesses of The Bank of Nova Scotia and certain of its affiliates in the countries where they operate, including; Scotiabank Europe plc; Scotiabank (Ireland) Designated Activity Company; Scotiabank Inverlat S.A., Institución de Banca Múltiple, Grupo Financiero Scotiabank Inverlat, Scotia Inverlat Casa de Bolsa, S.A. de C.V., Grupo Financiero Scotiabank Inverlat, Scotia Inverlat Derivados S.A. de C.V. – all members of the Scotiabank group and authorized users of the Scotiabank mark. The Bank of Nova Scotia is incorporated in Canada with limited liability and is authorised and regulated by the Office of the Superintendent of Financial Institutions Canada. The Bank of Nova Scotia is authorized by the UK Prudential Regulation Authority and is subject to regulation by the UK Financial Conduct Authority and limited regulation by the UK Prudential Regulation Authority. Details about the extent of The Bank of Nova Scotia's regulation by the UK Prudential Regulation Authority are available from us on request. Scotiabank Europe plc is authorized by the UK Prudential Regulation Authority and regulated by the UK Financial Conduct Authority and the UK Prudential Regulation Authority.
Scotiabank Inverlat, S.A., Scotia Inverlat Casa de Bolsa, S.A. de C.V, Grupo Financiero Scotiabank Inverlat, and Scotia Inverlat Derivados, S.A. de C.V., are each authorized and regulated by the Mexican financial authorities.
Not all products and services are offered in all jurisdictions. Services described are available in jurisdictions where permitted by law.