- Chile: Senate floor rejected impeachment bill against President Piñera, as expected
- Colombia: Q3 GDP shows economy operated 2.6% above pre-pandemic; with imports up, external deficit remains a concern
CHILE: SENATE FLOOR REJECTED IMPEACHMENT BILL AGAINST PRESIDENT PIÑERA, AS EXPECTED
On Tuesday, November 16, the Senate floor rejected the impeachment accusation against President Piñera (see our Latam Daily from October 13), as expected. The bill was based on possible crimes of bribery and tax evasion in the sale of Minera Dominga and had two chapters, which needed a two-thirds majority to be approved. In the Senate floor, the first chapter was rejected with only 24 votes in favour (short of the 29 votes needed to impeach a head of state), 18 votes against and 1 abstention. Also, the second chapter of the impeachment was rejected with 22 votes in favour, 20 votes against and one abstention.
—Anibal Alarcón
COLOMBIA: Q3 GDP SHOWS ECONOMY OPERATED 2.6% ABOVE PRE-PANDEMIC; WITH IMPORTS UP, EXTERNAL DEFICIT REMAINS A CONCERN
I. In Q3-2021 the Colombian economy operated 2.6% above pre-pandemic production levels
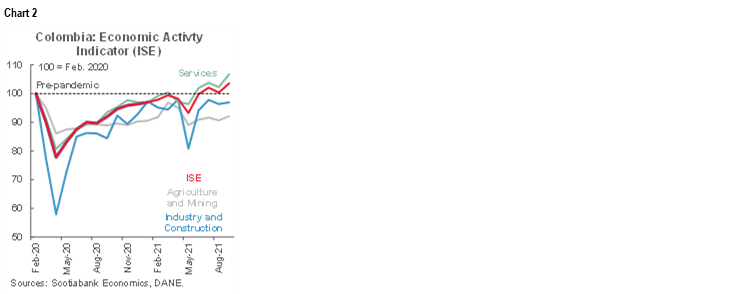
Data released on Tuesday, November 16 by Colombia’s statistical agency, DANE, showed Colombia’s real GDP grew by 13.2% y/y in Q3-2021, above consensus (12.5% y/y according to Bloomberg) and above our own expectation of 11.1% y/y. Q3-2021 was a period in which Colombia consolidated a full reopening and lifted all mobility restrictions. On a sequential basis, the economy grew by a robust 5.7% q/q, showing a strong recovery after the volatile Q2-2021 in which economic activity had the impact of the third COVID-19 wave and a long-lasting nationwide strike. In the YTD, the economy grew by 10% y/y and, now economic activity is 2.6% above pre-pandemic levels (chart 1). These results put an upward bias to our annual 9.1% GDP growth forecast for 2021. However, uncertainty remains and, high international prices and new COVID-19 waves would still be a challenge for the recovery.

According to the monthly economic activity indicator (ISE), September’s activity rebounded by 3.2% m/m sa, closing a robust quarter (chart 2) and operating at a solid 3.6% above pre-pandemic levels (February 2020). By sectors, the recovery was especially significant in services (+4.3% m/m; chart 2, again), such as financial sector (+14.9% m/m). On a yearly basis, the gain was 12.9% (above market consensus; 11.5% y/y).
Supply side GDP Q3-2021 (charts 3 and 4):
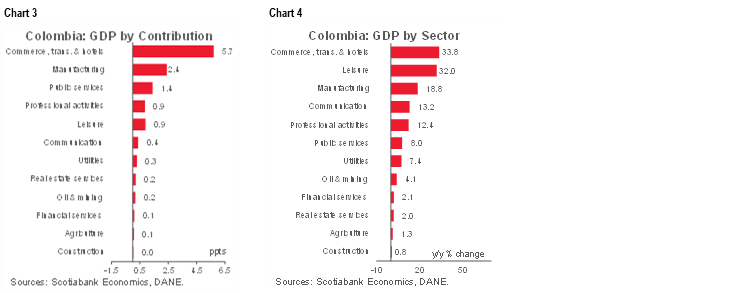
The most relevant increases were in commerce, transport, and hotels that grew by 33.8% y/y and added 5.7 ppts to the headline figure; industry expanded by 18.8% y/y and added 2.4 ppts to the total GDP expansion; and the public administration, defense, education, and social security services expanded by 8.0% (+1.4 ppts to the Q3-2021 GDP growth).
It is worth noting that compared with the pre-pandemic, the main lags are still concentrated in the mining and construction sector, which in the third quarter operated 18.9% and 28.9% below pre-pandemic, respectively. However, in Q3, construction significantly rebounded amid better dynamics in the building sector, especially those related to middle-income houses constructions and warehouses. On the mining side, we saw a mixed effect with a recovery in coal production and mining products related to construction, while oil production slightly fell versus Q3-2020. Meanwhile, the agricultural sector is losing momentum, deserving attention going forward.
Expenditure side GDP Q3-2021:
Domestic demand increased by 16.8% y/y in Q3-2021 (chart 5), well above the GDP growth and pointing to a widen real external deficit. On a sequential basis, domestic demand expanded by 5.9% q/q sa.
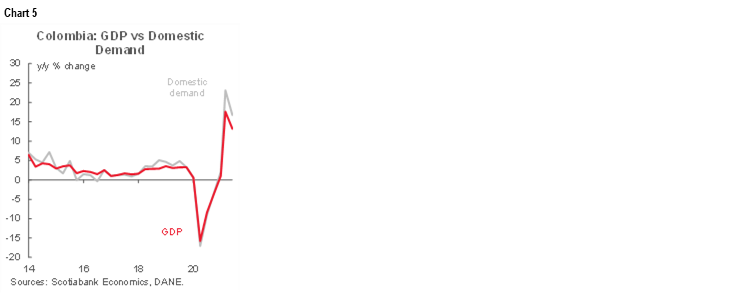
Consumption spending expanded by 20.0% y/y amid robust expansion in both, private (+20.2% y/y) and public spending (+19.1% y/y). Private consumption showed a robust rebound in services demand, especially those related with transport (+56.1% y/y), restaurants & hotels (+81.4% y/y).
Investment expanded by 4.5% y/y and +7.4% q/q sa, showing a positive rebound after the negative impact of the nationwide strike. Investment in housing activities (+14.5% y/y) and machinery and equipment (+17.8% y/y) led the gains.
Net exports contributed negatively to Q3-2021 growth (-4.9 ppts, chart 6) on the back of a very strong performance of imports, which expanded 40% y/y, against exports growth of 24.4% y/y. Two forces were at play here: the strong recovery in demand boosted imports, notably raw materials and capital goods; while some mining-related exports are still lagging the recovery despite the rebound in commodities prices.

All in all, Colombia’s Q3 GDP showed a better-than-expected performance in September which offset previous moderated monthly results. That said, the economy already surpassed pre-pandemic levels and in the YTD is growing at 10% (above consensus). Ahead of Q4, services sectors would continue gaining ground as restrictions were eliminated and now occupation in massive events is allowed at 100% in Bogota, if attendees are vaccinated. Going forward, GDP results affirm our expectation of a 50 bps hike in December’s monetary policy meeting, while recent results would skew our current 9.1% growth projection to the upside. The external deficit remains a concern since the current account deficit would widen more than expected.
II. September imports rose 64.9% and monthly trade deficit widened to the highest level since mid-2015
September’s imports data, released by DANE on Tuesday, November 16, came in at USD 5.35 bn (CIF terms), expanding 64.9% y/y (chart 7), reaching their highest level since October 2014. Compared with September 2019, imports increased by 36.5%, showing the effect of a robust economic recovery as well as that of higher international prices.
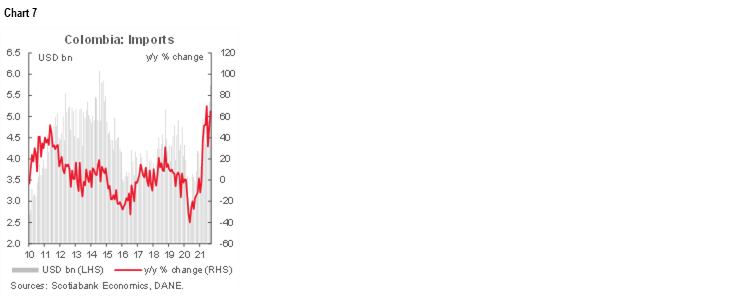
Raw material imports are close to the historical high, while capital goods imports are close to their 2015 average. Manufacturing imports grew by 66.5% y/y (+41.4% versus September-2019) accounting for the strongest positive contribution to annual imports growth, while agriculture-related imports increased by 39.5% y/y and mining-related imports grew by 105.9% y/y. As a result, the monthly trade deficit widened to USD 1.71 bn (FOB), the highest since January 2015 (chart 8). Colombia’s YTD trade deficit stood at USD 11.16 bn for January–September affirming our expectation of a current account deficit of 5.2% of GDP in 2021, financed mainly by FDI.

From the perspective of imports by use, the three major segments showed positive signals compared with September 2020 (chart 9):
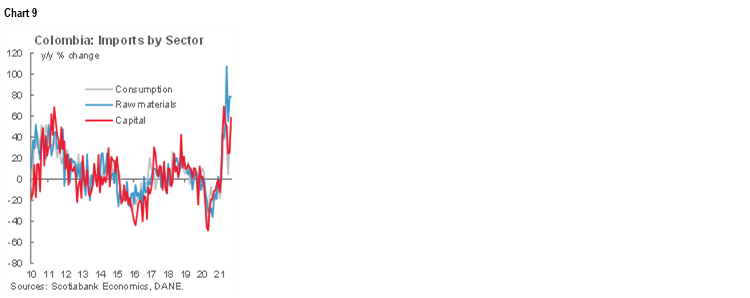
- Consumption-goods imports increased by +49.8% y/y and stood at USD 1.3 bn, close to their record high. Durable-goods imports (+58.7% y/y) and non-durable goods imports (+43.2% y/y) are equally contributing to the rise in consumption imports. Vehicles imports (+72.6% y/y), pharma products (+46.8% y/y) and foodstuff (+45.7% y/y) are leading the gains. Non-durable goods are at a historical high, while durable goods imports are close to their 2014 average.
- Raw-materials imports grew by 78.2% y/y, due to larger purchases of foreign goods for the industrial sector (+75.3% y/y), especially those related to chemical products (+64.9%y/y) and mining products (+115.7% y/y). Raw materials imports, in dollar terms, are now in the historical high, and it continued showing the effect of higher prices as well as the ongoing economic recovery.
- Capital-goods imports were up by 58.6% y/y (USD 1.69 bn), led by higher purchases of investment-related goods in the industry (43.6% y/y) and transport equipment (+81.6% y/y). Capital-goods imports already surpassed pre-pandemic averages (2019: USD 1.37 bn) and are closer to 2014 averages (USD 1.81 bn), which let us affirm our expectation of better FDI in the coming months.
All in all, September’s strong imports are affirming the thesis of a robust economic recovery, but also the impact of international prices since raw materials imports are at historical highs. We continue vigilant of the trade balance since the deficit is escalating to its worst level since 2015 and it would point to structural pressure on the FX. Additionally, Current Account Balance (BoP) results to be released early in December will be key as they would confirm whether financing is coming from FDI rather than from government indebtedness. For now, we maintain our expectation of a 5.2% of GDP in the current account deficit in 2021.
—Sergio Olarte & Jackeline Piraján
DISCLAIMER
This report has been prepared by Scotiabank Economics as a resource for the clients of Scotiabank. Opinions, estimates and projections contained herein are our own as of the date hereof and are subject to change without notice. The information and opinions contained herein have been compiled or arrived at from sources believed reliable but no representation or warranty, express or implied, is made as to their accuracy or completeness. Neither Scotiabank nor any of its officers, directors, partners, employees or affiliates accepts any liability whatsoever for any direct or consequential loss arising from any use of this report or its contents.
These reports are provided to you for informational purposes only. This report is not, and is not constructed as, an offer to sell or solicitation of any offer to buy any financial instrument, nor shall this report be construed as an opinion as to whether you should enter into any swap or trading strategy involving a swap or any other transaction. The information contained in this report is not intended to be, and does not constitute, a recommendation of a swap or trading strategy involving a swap within the meaning of U.S. Commodity Futures Trading Commission Regulation 23.434 and Appendix A thereto. This material is not intended to be individually tailored to your needs or characteristics and should not be viewed as a “call to action” or suggestion that you enter into a swap or trading strategy involving a swap or any other transaction. Scotiabank may engage in transactions in a manner inconsistent with the views discussed this report and may have positions, or be in the process of acquiring or disposing of positions, referred to in this report.
Scotiabank, its affiliates and any of their respective officers, directors and employees may from time to time take positions in currencies, act as managers, co-managers or underwriters of a public offering or act as principals or agents, deal in, own or act as market makers or advisors, brokers or commercial and/or investment bankers in relation to securities or related derivatives. As a result of these actions, Scotiabank may receive remuneration. All Scotiabank products and services are subject to the terms of applicable agreements and local regulations. Officers, directors and employees of Scotiabank and its affiliates may serve as directors of corporations.
Any securities discussed in this report may not be suitable for all investors. Scotiabank recommends that investors independently evaluate any issuer and security discussed in this report, and consult with any advisors they deem necessary prior to making any investment.
This report and all information, opinions and conclusions contained in it are protected by copyright. This information may not be reproduced without the prior express written consent of Scotiabank.
™ Trademark of The Bank of Nova Scotia. Used under license, where applicable.
Scotiabank, together with “Global Banking and Markets”, is a marketing name for the global corporate and investment banking and capital markets businesses of The Bank of Nova Scotia and certain of its affiliates in the countries where they operate, including; Scotiabank Europe plc; Scotiabank (Ireland) Designated Activity Company; Scotiabank Inverlat S.A., Institución de Banca Múltiple, Grupo Financiero Scotiabank Inverlat, Scotia Inverlat Casa de Bolsa, S.A. de C.V., Grupo Financiero Scotiabank Inverlat, Scotia Inverlat Derivados S.A. de C.V. – all members of the Scotiabank group and authorized users of the Scotiabank mark. The Bank of Nova Scotia is incorporated in Canada with limited liability and is authorised and regulated by the Office of the Superintendent of Financial Institutions Canada. The Bank of Nova Scotia is authorized by the UK Prudential Regulation Authority and is subject to regulation by the UK Financial Conduct Authority and limited regulation by the UK Prudential Regulation Authority. Details about the extent of The Bank of Nova Scotia's regulation by the UK Prudential Regulation Authority are available from us on request. Scotiabank Europe plc is authorized by the UK Prudential Regulation Authority and regulated by the UK Financial Conduct Authority and the UK Prudential Regulation Authority.
Scotiabank Inverlat, S.A., Scotia Inverlat Casa de Bolsa, S.A. de C.V, Grupo Financiero Scotiabank Inverlat, and Scotia Inverlat Derivados, S.A. de C.V., are each authorized and regulated by the Mexican financial authorities.
Not all products and services are offered in all jurisdictions. Services described are available in jurisdictions where permitted by law.