- Colombia: Policy rate on hold, but hawkish tone set; Employment; Exports benefit from high commodity prices
- Chile: Mixed signals between administrative data (AFP contributors) and surveys (INE); June Imacec expands 20.1% y/y
- Mexico: GDP; Banxico’s expectations survey; Mixed financial sector results
- Peru: Inflation breaches target.
COLOMBIA: RATES ON HOLD; EMPLOYMENT; EXPORTS
I. BanRep held its benchmark monetary-policy rate at 1.75% in a split vote and with a hawkish call
On Friday, July 30, BanRep’s Board left its benchmark monetary-policy rate at 1.75% in a split vote, with two members voting for a 25 bps rate hike. The meeting sounded a hawkish tone, however, as Governor Villar indicated that the Board will reduce its expansionist stance in coming months. Bank staff raised its GDP growth projection from 6.5% y/y to 7.5% y/y for 2021, underscoring that pressures on prices would persist, possibly fueling a rise in inflation expectations. The Board also highlighted that the external environment would tighten financial conditions. That said, as expected by the Scotiabank Economics team, BanRep is likely to start a hiking cycle in the next meeting in September.
Some additional key features of the decision included:
- The forecast for 2021 GDP growth was revised up from 6.5% y/y to 7.5% y/y. Despite challenges from the nationwide strike, leading indicators suggest the economy is improving faster than expected.
- The communiqué underscored the increase in inflation. Despite core inflation below 3% (1.87% for inflation ex-food and regulated prices), some pressure is expected on inflation expectations. We consider the a hawkish signal that the BanRep will start its hiking cycle soon.
- On the balance of the risks: BanRep highlighted that inflation pressures abroad would tighten financial conditions, while the current account deficit projection is expected to increase from 3.4% of GDP in 2020 to 4.5% of GDP in 2021 and 4.3% in 2022, which would also point to higher rates in the future.
In the press conference, Governor Villar’s language was decidedly hawkish. He noted that monetary policy needs to be less expansionary in the future, and indicated that all Board members agreed on that, with the discussion focused on timing. Villar highlighted that monetary policy will continue to be expansionary, but will gradually be adjusted, with core inflation a key variable to watch. Governor Villar also underscored that, while economic recovery has been more robust than expected, risks remain.
We keep our call that the BanRep will start a hiking cycle in September 2021 in a gradual path of 25 bps per meeting to close 2021 at 2.50% and 2022 at 4%. Next week, the Monetary Policy Report release will provide further details about projections and the balance of risks.
II. Gradual recovery in employment stalls as reopening consolidates
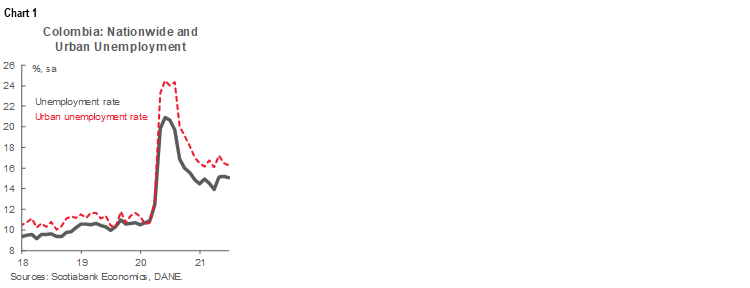
In early June, major cities relaxed lockdown measures, allowing a large part of the economy to operate normally. In that context, on Friday, July 30, the Colombian statistical agency DANE reported June’s nationwide unemployment rate was 14.4% (not seasonally adjusted). This outcome is below the June 2020 level of 19.8% but still well above the pre-pandemic (June 2019) level of 10.7%. The urban unemployment rate for 13 major cities was 17.1%, higher than the 16.5% expected by Bloomberg’s survey market consensus. On a seasonally adjusted basis, the national unemployment rate was broadly unchanged at 15.1% in June versus 15.2% in May 2021, while the urban unemployment rate fell from 16.5% in May 2021 to 16.3% in June (chart 1).
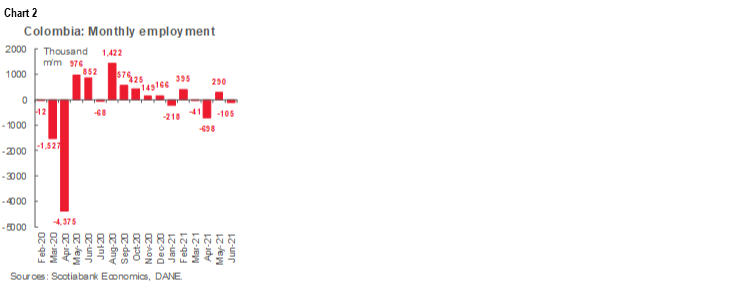
May’s surprising recovery in employment, despite widespread protests, was followed by an unexpected contraction in employment in June on a seasonally adjusted basis. Total active jobs contracted by 105 thousand m/m in June (chart 2), and remain down by 1.99 million (-8.8%) relative to June 2019. Inactive workers remained high, with the inactive labor force at 13.1% above the pre-pandemic level (16.3 million in June 2021 versus 14.4 million in June 2019). And despite the better dynamic in major cities attributable to the reopening, job losses remained concentrated in urban areas, which accounted for around of 50% of total job losses.
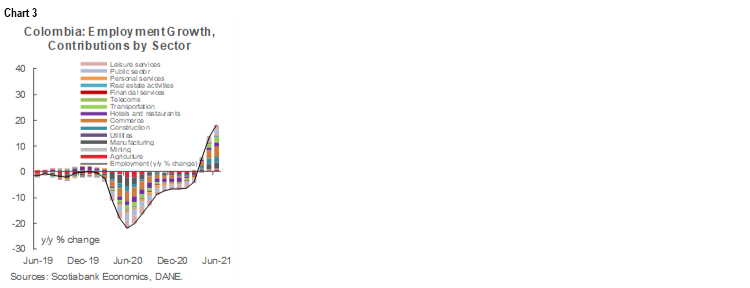
From a sectoral perspective (chart 3), 88% of employment losses as of June 2021 versus pre-pandemic levels remained concentrated in four sectors: leisure (-593 thousand), agriculture (-417 thousand), manufacturing (-402 thousand), and public administration and education (-343 thousand). It is worth noting the most hard-hit specific activities are those related to personal services (-207 thousand), homemaker services (-199 thousand), and employment-related with basic education services (-113 thousand), likely reflecting the reduction in household income that affects the demand of those services. On the positive side, employment gains came from transport (+120 thousand), utilities (82 thousand), and real estate (19 thousand); with real estate employment pointing to the positive impact from government programs.
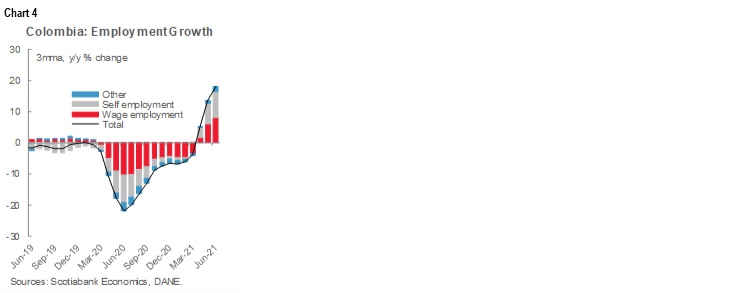
June’s labour market numbers also reveal important structural challenges: a wide gap between female unemployment rate (19%) and male rate (11.2%), though it has narrowed recently; concerns to the evolving quality of jobs, with around 46% of employment recovery attributable to higher self-employment (chart 4), and about 12% of hiring related to big companies, while informal employment increased from 46.2% of total jobs in June 2020 to 48.5% in June 2021. In this respect, DANE data underscore that, while pandemic restrictions are less of a constraint, labour market indicators continue to lag despite the strong recovery in economic activity.
Summing up, June showed an overall recovery in the labor market, but key characteristics of this recovery remain a concern. We expect the labour market to continue gradually improving, as major cities relax restrictions for large events. In addition, the vaccine roll-out is progressing; in July, private companies started vaccinating employees, and people above 25-years are now eligible to be vaccinated, which should foster economic recovery and employment creation.
III. Exports improved amid better commodity prices and better demand for manufacturing and agricultural products
According to DANE’s data release on Monday, August 2, June’s monthly exports totaled USD 3.05 bn, up 33.1% y/y (chart 5). Oil & mining-related exports led the gains, rebounding by 56.3%, while manufacturing and agricultural-related exports expanded 38.4% y/y and 1.5% y/y, respectively. The year-on-year growth rates are skewed by the comparison with 2020 lockdowns, which severely affected economic activity. In fact, June´s exports were similar to those observed in May.

- Traditional commodity exports as a whole were up 37.4% y/y in June (chart 6), on the back of higher commodity prices. Oil-related items represented 33% of June’s total exports, still below the average of 40% in 2019. The favorable price effect drove the value of exports up 79.9% y/y, despite lower production levels, which drove the sector’s export volumes down by -16.3% y/y. Similarly, the value of coal exports expanded by 15.2% y/y owing to higher prices, while production contracted by 20.4% y/y even when compared with the worst month of lockdown. Coffee exports contracted by 43.2% y/y in June, as lower export volumes due to interruptions probably associated with the nationwide strike offset the positive effect from prices. In July, we expect the mining exports to continue leading the recovery, and from a coffee perspective, normalization in the harvest and transportation process would lead to better performance.
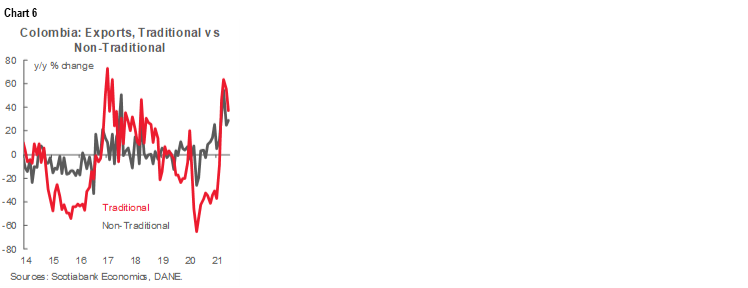
- The value of non-traditional exports amounted to USD 1.57 bn in June, an increase of 37.4% y/y compared with a year ago (chart 6). Exports of manufactured products (up 38.4% y/y), such as chemical products (a 53.8% y/y rise), as well as agricultural products, such as flowers (a 24.5% y/y gain) and bananas (+23.1% y/y), drove the overall advance in non-traditional goods exports.
All in all, June’s exports showed again positive effects from rising international commodity prices, and higher demand for some manufacturing products. In June, coffee exports were adversely affected by transportation disruptions resulting from the nationwide strike; however, as the situation stabilized in July, we expect better numbers in the future. At the same time, we see room for further improvements as the global recovery progresses. That said, although exports should keep rising in 2021, imports could see even more significant gains as domestic demand expands. All in all, we still expect a current account deficit of about -4.0% (or wider) of GDP in 2021, an increase over the -3.3% deficit observed in 2020.
—Sergio Olarte & Jackeline Piraján
CHILE: MIXED SIGNALS BETWEEN ADMINISTRATIVE DATA (AFP CONTRIBUTORS) AND SURVEYS (INE); JUNE IMACEC EXPANDS 20.1% Y/Y
I. Unemployment rate falls to 9.5% as workforce declines. AFP contributors show formal employment almost entirely recovered—Is new aid justified?
On July, Friday 30, the INE reported a drop in the unemployment rate to 9.5% in the quarter that ended in June—better than expected by the market and Scotiabank (10%). However, this drop reflects a decline in the workforce in the context of stagnant employment creation. Going forward, the key question is what is the prognosis for the labour market. A decline in labour participation rates, especially of women, would not auger well for the outlook since it would affect medium-term growth capacity. That said, a complete diagnosis would incorporate the fact that administrative data (AFP contributors) indicate that formal salaried employment has almost recovered compared to its pre-pandemic levels.
These mixed signals must be interpreted with caution, since proposals for new fiscal support and pension fund withdrawals now being discussed in Congress are predicated on the assumption that close to 1 million jobs remain to be recovered. Such jobs would likely be informal and self-employment, which we consider difficult to recover or replace in the formal labour market as long as the pandemic continues.
According to the INE, despite the fact that m/m total employment was flat, private salaried workers increased by about 35 thousand, concentrated in the transport, construction and health sectors. However, both the salaried sector and the self-employed continue to show a lag in levels compared to the situation prior to the pandemic.
In contrast, the administrative data (AFP contributors) show an almost complete recovery of dependent contributors as of April. The total figures show a recovery from the pre-pandemic level in terms of dependent employment, with a faster recovery in male employment to the detriment of a lag in female employment.
II. Explained by the boost from the reopening, public spending and pension fund withdrawals—we forecast a seasonally adjusted contraction in 2021-Q4
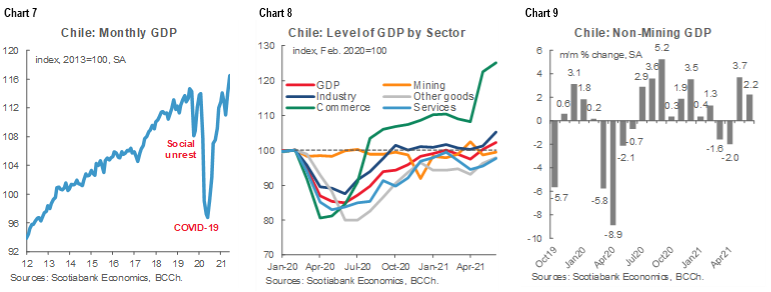
On August, Monday 2, Chile’s central bank (BCCh) released the June monthly activity index (Imacec), which expanded 20.1%, y/y, marginally exceeding private expectations, pointing to GDP growth in the upper part of our 7.5–8.5% range. Economic activity expanded 17.4% y/y in 2021-Q2. These encouraging figures are the product of a few specific ingredients: greater openness and mobility, a very strong expansion of public spending on direct transfers to households, and capital spending in conjunction with liquidity injections from withdrawals of pension funds. For July, with base effects declining in importance and a loss of momentum, we preliminarily estimate an expansion of the Imacec between 16–18% y/y.
Activity gaps are closing, but with high sectoral heterogeneity and continued exposure to relevant risks in the health and political spheres that would slow the recovery if realized (chart 7 and chart 8). Seasonally adjusted growth exceeds pre-pandemic levels, reaching figures closer to the trend before the social unrest. Compared to the previous month, the seasonally adjusted Imacec increased 2.1% m/m and the non-mining Imacec by 2.2% m/m (chart 9), with the greatest contribution coming from the services sector (+2.3% m/m), mainly education and health services, together with the manufacturing industry.
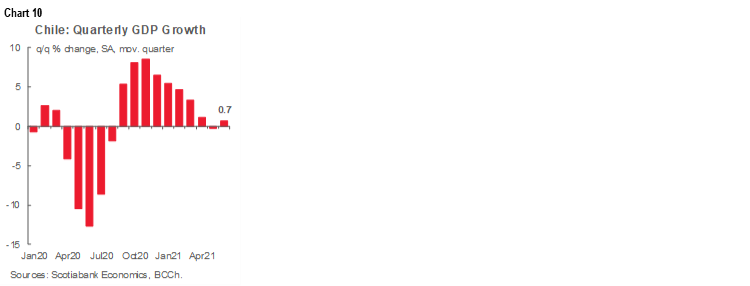
We expect the economy to be flat or contract somewhat in 2021-Q4, which would be highly relevant for the normalization of the Monetary Policy Rate. Economic activity grew 2.6% q/q in annualized terms in 2021-Q2, decelerating compared to the 2021-Q1 (13.8% q/q) and the last quarter of 2020 (28.5% q/q), suggesting that the best growth performance is in the past (chart 10). Indeed, although double-digit y/y rates are expected until September given the low comparison bases, the economy is likely to show a seasonally adjusted contraction in 2021 Q4 explained by: (1) the waning positive effects of a relaxation of lockdown restrictions in m/m comparisons; (2) public spending that declines relative to previous quarters; (3) Covid-19 cases that may increase towards the end of September, leading to new quarantine measures; (4) political uncertainty that could affect sector dynamics and propensity to consume. This scenario is compatible with economic growth at the top of our 2021 GDP growth range, but raises risks towards 2022.
According to figures from the Budget Office (Dipres), public spending grew 37% y/y in real terms in June, again driven by spending on subsidies and donations (+89.5% y/y). Current spending grew 39.7% y/y in real terms, while capital spending grew 19.1% y/y. With these outcomes, public grew 27% y/y in the first half of 2021, mainly driven by the increase in current spending (29.1% y/y). In the second semester, public spending growth will face higher bases of comparison, mainly in 2021-3Q, which added to the strong progress in the spending execution during the first semester (mainly current spending) will reduce dynamics to the y/y growth over the next few months.
—Jorge Selaive, Anibal Alarcón, & Waldo Riveras
MEXICO: Q2 GDP, BANXICO’S EXPECTATIONS SURVEY, FINANCIAL ACTIVITY MIXED
I. Mexico: GDP Q2 figures below consensus
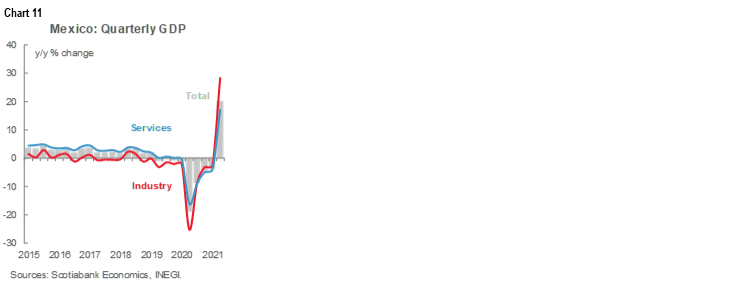
Preliminary GDP data released by INEGI for the second quarter of 2021 suggest that the economy grew 19.6% y/y, slightly below the 19.8% y/y anticipated by the market, recovering from the -3.5% y/y decline recorded in the previous quarter. As with other economic indicators, base effects explain most of the advance. However, the quarter-on-quarter reading was also positive, with an increase of 1.5% q/q, but below the consensus of 1.8% q/q. By components, the industrial sector expanded 28.2% y/y (chart 11), boosted by exports and the recent rebound in construction and mining. The services sector, which was the sector most affected by lockdowns and economic contraction in 2020, also expanded strongly, surging 17.0% y/y, reflecting progress in the vaccine rollout and fewer mobility restrictions. Agriculture advanced at a more moderate pace (6.8% y/y), mainly owing to the weather disruptions that affected much of the second quarter of 2021. Looking ahead, we expect monthly activity to continue with moderate gains, although the third wave of contagions poses the major downside risk for the coming months. That said, growth in Q2 proved more resilient to the Delta-wave of the pandemic and the post election spending slump in June, which puts some upwards risk to our forecasts for annual GDP.
II. Banxico’s Survey of Expectations with upward revisions in inflation, policy rate and GDP figures
Banxico’s latest survey expectations revealed that the expected headline inflation rate for the end of 2021 increased considerably, from 5.58% to 5.94%, moving further and further away from the 3.0% target (see table 1) Expected core inflation also rose from 4.38% y/y to 4.65% y/y. The change in the inflation outlook reflects the higher-than-expected inflation reading in the first half of July, which came in at 0.37% biweekly versus the 0.26% average estimate, bringing the annual rate to 5.75% from 5.74% previously. We believe that with inflation and expectations both materially above Banxico’s target rate, the August 12 meeting is likely to see another 25bps hike.
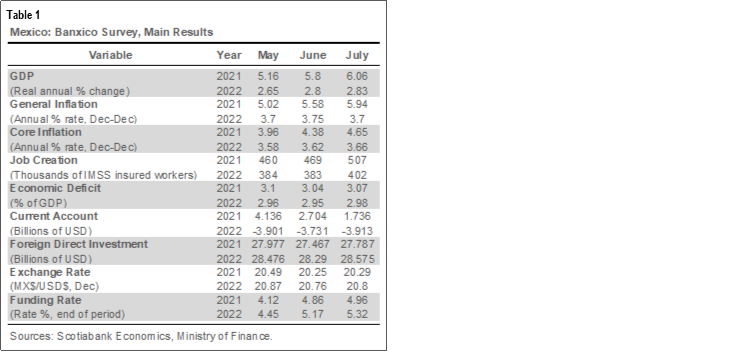
Expectations for the reference interest rate stood at 4.96% from 4.86% previously, the median for the monetary policy rate points to the rate closing the year at 5.00% from 4.88% previously. This would imply three additional increases of 25 basis points each, distributed among the remaining four decisions. This scenario differs somewhat from our forecast of a 25 basis point increase for each of the following meetings—and what markets are discounting, which matches out own expectations. Our view incorporates the fact that, owing to inflationary inertia, services will face significant price pressures by the end of the year, as well as the increasing correlation of price sub indices (suggesting contamination). In our view, this explains why the Bank of Mexico has begun a period of bullish monetary policy, which will end next year with the reference rate at a level of 6.0%, in order to achieve its sole mandate to maintain low and stable inflation around three percent. In addition, at the last monetary policy meeting, the Board of Governors of Banco de México considered that the balance of risks for inflation remains biased to the upside and one board member commented in a note published last week that the decisions will be taken based on the information available: "that the decisions will be data driven or data dependent and that the monetary policy regime is not only inflation targeting but specifically inflation forecast targeting." The main risks we see to our view are: 1) deputy governor Heath’s note last week which signalled he does not see an uninterrupted hike cycle (Heath is seen as the swing voter in the board), and 2) the arrival of FinMin Herrera to Banxico’s board leadership, with the former FinMin being seen as dovish (replacing Diaz de Leon, widely regarded as a pragmatic hawk).
Survey respondents also revised up their growth forecasts for 2021, with real GDP growth of 6.06% for this year. This is well above the 5.3% growth rate we at Scotiabank expect, although we recognize that the economy is recovering at a faster pace and do not exclude the possibility that our next adjustment is an upward revision. Overall, Mexico's economy continues to recover—and is showing a more balanced expansion than in 2020, and the outlook is for this positive trend to continue as Mexico's vaccination process evolves and the process of normalization and reopening of other productive activities progresses. However, Covid-19 delta contagions could put pressure on some sectors early in the third quarter, particularly as Mexico’s vaccination campaign lags other large economies and the country has one of the highest diabetes incidences globally, meaning the vulnerable population extends beyond the elderly. In line with the economic recovery, analysts increased the number of formal employment positions to 507 thousand new jobs this year, compared to the 469 thousand expected in the June survey. Thus, the recovery is expected to be driven not only by the dynamism of our main trading partner, the United States, which is expected to grow at a real annual rate of 6.61% this year, but also by an improvement in domestic demand.
The expectation for the exchange rate at the end of 2021 remained practically unchanged with respect to the previous survey and the Mexican currency is expected to close the year at 20.29 pesos per dollar (vs. 20.25 ppd previously); while for 2022 the currency is expected to close at 20.80 pesos per dollar, up from 20.80 pesos per dollar previously.
In July, despite the upward revisions in growth, the number of respondents who think the economy will improve decreased from 59% to 45%. However, the percentage of respondents who believe it is a good time to invest increased slightly from 26% to 27%. For the next six months, respondents believe that growth in economic activity will depend largely on governance (47% of responses) and domestic economic conditions (29% of responses). In particular, the main factors are: problems of public insecurity (16% of responses); uncertainty about the domestic political situation (14% of responses); weakness of the domestic market (10% of responses); domestic economic uncertainty (10% of responses); and public spending policy (10% of responses).
III. Mixed results in financial activity in June
Financial activity in June generated mixed results (chart 12). On one hand, commercial banks' total deposits from the non-bank public declined -6.4% real y/y (compared to -6.3% y/y in May, and year earlier growth rate of 8.6% y/y). The decline was driven by a contraction of term deposits, which declined -20.0% y/y in real terms (-19.7% y/y in May). Demand deposits, in contrast, maintained a steady advance of 2.2% y/y. The persistent fall in term deposits reflects the recent low saving capacity of agents after a year of historical falls in all sectors of the economy. Additionally, total direct financing also contracted at a faster pace, from -7.1% y/y in May to -8.2% y/y in June, with the decline driven by a much lower financing to the public sector, which represents about 26% of the total. Public financing cooled from 11.9% y/y growth in May to only 1.9% y/y in June.
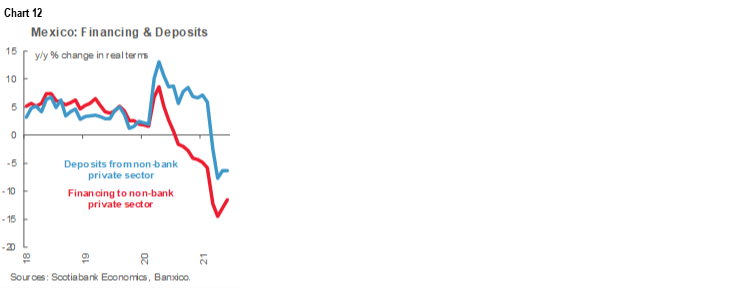
On the other hand, the contraction of total commercial bank financing to the private sector (64% of total financing) slowed from -13.0% real y/y to -11.5% y/y, narrowing the negative gap for the second consecutive month. June represents the eleventh consecutive month in which financing to the private sector declined, and it there is scant evidence that this trend will soon reverse, although the contraction seems to have bottomed out in April. The decline in the portfolio of total performing loans also slowed somewhat, from -13.1% to -11.8%. By component, the corporate sector, with a contribution of close to 56% of the total, continues to be the most affected. In June, the decline in corporate loans attenuated slightly from -18.2% y/y in real terms to -16.9% y/y, reflecting the contraction of bank credit to both large and small size companies. Meanwhile, consumer-oriented credit went from -10.1% y/y in May to -8.5% y/y in June, and mortgages expanded from 2.7% y/y to 2.9% y/y. The behavior of financing and credit to the private sector is consistent with the recovery we have observed in other sectors of the economy and we expect this trend to continue.
—Miguel Saldaña & Paulina Villanueva
PERU: INFLATION JUMP IN JULY, REACHES HIGHEST PACE IN 52 MONTHS
Inflation jumped in July, exceeding the upper limit of the 3.0% target range for the second consecutive month (chart 13). Inflation was 1.01% m/m in July, up from 0.52% m/m in June, and materially above the Bloomberg consensus of 0.50% m/m and our own forecast of 0,90% m/m. Headline inflation rose from 3.25% y/y in June to 3.81% y/y in July, above the upper limit of the target range (between 1% and 3%) for the second consecutive month and reaching the highest rate since March 2017. This rate also exceeds the BCRP's year-end forecast of 3.0% y/y. Core inflation rose from 1.89% y/y in June to 2.14% y/y in July, exceeding the 2% y/y target for headline inflation for the first time in 16 months.
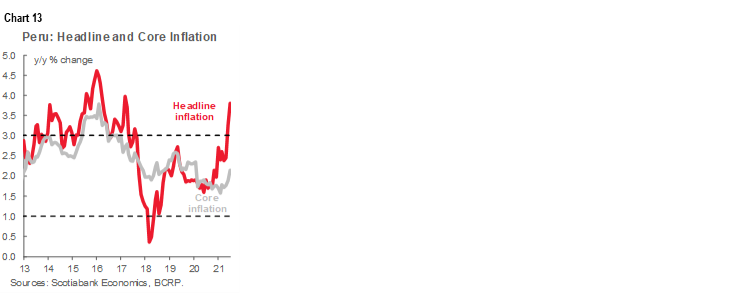
We see the increase in inflation as reflecting increased costs rather than demand. These cost factors include rising raw materials and oil, which should be temporary but have persisted longer than expected, and pressures from the depreciation of the PEN against the dollar. These sources of pressure on headline inflation are likely to persist for the rest of the year. Based on these factors, our inflation forecast for the full-year 2021 of 3.5% have an upward bias.
The depreciation of the PEN has doubled, from 6.5% against the USD during 2021-1H to 12.3% until July. The carry-over effects of the FX on inflation are becoming more visible, a situation that could persist in the coming months if pressures on the PEN persist.
Core inflation exceeded the midpoint of the target range reflecting possible contamination by higher headline inflation. Inflationary expectations have also been creeping upward, raising the possibility of changes in monetary policy decisions earlier than expected in a similar way to what has already been observed by other central banks in emerging economies. In the short term, market attention will be focused on the new composition of the BCRP’s board to assess possible changes in the direction/manage of monetary policy.
—Mario Guerrero
DISCLAIMER
This report has been prepared by Scotiabank Economics as a resource for the clients of Scotiabank. Opinions, estimates and projections contained herein are our own as of the date hereof and are subject to change without notice. The information and opinions contained herein have been compiled or arrived at from sources believed reliable but no representation or warranty, express or implied, is made as to their accuracy or completeness. Neither Scotiabank nor any of its officers, directors, partners, employees or affiliates accepts any liability whatsoever for any direct or consequential loss arising from any use of this report or its contents.
These reports are provided to you for informational purposes only. This report is not, and is not constructed as, an offer to sell or solicitation of any offer to buy any financial instrument, nor shall this report be construed as an opinion as to whether you should enter into any swap or trading strategy involving a swap or any other transaction. The information contained in this report is not intended to be, and does not constitute, a recommendation of a swap or trading strategy involving a swap within the meaning of U.S. Commodity Futures Trading Commission Regulation 23.434 and Appendix A thereto. This material is not intended to be individually tailored to your needs or characteristics and should not be viewed as a “call to action” or suggestion that you enter into a swap or trading strategy involving a swap or any other transaction. Scotiabank may engage in transactions in a manner inconsistent with the views discussed this report and may have positions, or be in the process of acquiring or disposing of positions, referred to in this report.
Scotiabank, its affiliates and any of their respective officers, directors and employees may from time to time take positions in currencies, act as managers, co-managers or underwriters of a public offering or act as principals or agents, deal in, own or act as market makers or advisors, brokers or commercial and/or investment bankers in relation to securities or related derivatives. As a result of these actions, Scotiabank may receive remuneration. All Scotiabank products and services are subject to the terms of applicable agreements and local regulations. Officers, directors and employees of Scotiabank and its affiliates may serve as directors of corporations.
Any securities discussed in this report may not be suitable for all investors. Scotiabank recommends that investors independently evaluate any issuer and security discussed in this report, and consult with any advisors they deem necessary prior to making any investment.
This report and all information, opinions and conclusions contained in it are protected by copyright. This information may not be reproduced without the prior express written consent of Scotiabank.
™ Trademark of The Bank of Nova Scotia. Used under license, where applicable.
Scotiabank, together with “Global Banking and Markets”, is a marketing name for the global corporate and investment banking and capital markets businesses of The Bank of Nova Scotia and certain of its affiliates in the countries where they operate, including; Scotiabank Europe plc; Scotiabank (Ireland) Designated Activity Company; Scotiabank Inverlat S.A., Institución de Banca Múltiple, Grupo Financiero Scotiabank Inverlat, Scotia Inverlat Casa de Bolsa, S.A. de C.V., Grupo Financiero Scotiabank Inverlat, Scotia Inverlat Derivados S.A. de C.V. – all members of the Scotiabank group and authorized users of the Scotiabank mark. The Bank of Nova Scotia is incorporated in Canada with limited liability and is authorised and regulated by the Office of the Superintendent of Financial Institutions Canada. The Bank of Nova Scotia is authorized by the UK Prudential Regulation Authority and is subject to regulation by the UK Financial Conduct Authority and limited regulation by the UK Prudential Regulation Authority. Details about the extent of The Bank of Nova Scotia's regulation by the UK Prudential Regulation Authority are available from us on request. Scotiabank Europe plc is authorized by the UK Prudential Regulation Authority and regulated by the UK Financial Conduct Authority and the UK Prudential Regulation Authority.
Scotiabank Inverlat, S.A., Scotia Inverlat Casa de Bolsa, S.A. de C.V, Grupo Financiero Scotiabank Inverlat, and Scotia Inverlat Derivados, S.A. de C.V., are each authorized and regulated by the Mexican financial authorities.
Not all products and services are offered in all jurisdictions. Services described are available in jurisdictions where permitted by law.