Latam Economic Update
Argentina: June inflation expected to hold at 1.5% m/m
Mexico: May Industrial production shrank more than consensus expected
Peru: May trade and fiscal accounts were as bleak as expected given the lockdown, but not worse
ARGENTINA: JUNE INFLATION EXPECTED TO HOLD AT 1.5% M/M
June inflation numbers come out on Wednesday, July 15, and we expect the headline rate to hold at 1.5% m/m owing to capital controls that are propping up the official value of the ARS, domestic price controls on utilities, official monitoring of thousands of prices to discourage increases, and the recessionary effects of the lockdown. A monthly print at this rate implies that annual inflation will fall to between 41% and 42% y/y in June owing to base effects from last year, which would be the lowest annual rate since Q3-2018.
We expect the four factors holding the official price index down to persist through the end of the year. This would bring annual inflation down to a temporary low at 25.7% y/y by December 2020, its softest rate since April 2018, before heading back up in 2021.
—Brett House
MEXICO: MAY INDUSTRIAL PRODUCTION SHRANK MORE THAN CONSENSUS EXPECTED
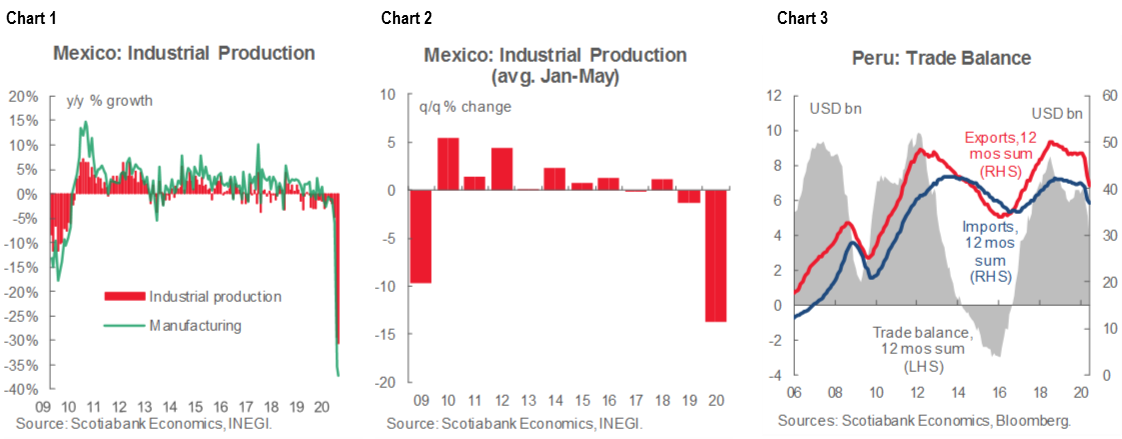
Figures published on July 10 for May industrial production showed the biggest single-month decline since records have been available (from 1993), going from -29.3% y/y in April to -30.7% y/y, versus -3.1% y/y in May 2019. For a second month in a row, the fall in IP surpassed by a wide margin the drop anticipated by the consensus (-25.6% y/y).
The May results were driven by a more pronounced fall in manufacturing, from -35.4% y/y to -37.1% y/y (versus 0.7% y/y in May 2019), which made for eight consecutive months with manufacturing growth in negative territory (chart 1). A slightly lesser, yet still significant, plunge in construction, which went from -37.9% y/y to -36.3% y/y (versus -9.6% y/y in May 2019), also contributed. Smaller pullbacks were recorded in utilities, from -3.4% y/y to -13.1% y/y (versus 3.6% y/y in May 2019), and mining, from -3.9% y/y to -5.9% y/y (versus -8.9% in May 2019).
In the January–May period, industrial production averaged a monthly decline of -13.7% y/y (versus -1.4% y/y for the same stretch in 2019), its weakest pace for a similar period since records have existed (chart 2).
Within manufacturing, which accounted for 54.9% of total industry as of Q1-2020, all of its sub-components observed annual declines. Eight out of 21 sub-sectors saw record contractions: food, wood, paper, chemical, plastics and rubber, metal products, machinery and equipment, and electrical generation equipment.
Similarly, the annual decrease in construction was driven by an exceptional drop in its three sub-components.
In mining, the sector’s dynamics were explained mainly by a reduction in oil extraction after the entry into force of the cuts in production agreed during April’s OPEC meeting.
In sum, despite the reopening of some sectors in mid-May, industrial production fell further from the sharp annual drop that it saw in April and produced a new, record decline in May. Even though some components of the previously released May trade data already pointed to an unfavourable outlook for industrial activity, the May IP print revealed a much larger contraction than expected, which could motivate further downward revisions to 2020’s prospects for economic growth.
—Daniel Mendoza
PERU: MAY TRADE AND FISCAL ACCOUNTS WERE AS BLEAK AS EXPECTED GIVEN THE LOCKDOWN, BUT NOT WORSE
The trade balance for May, released on Friday, July 10, registered a very mild USD 229 mn deficit. The details were bleak, but May was in the midst of the lockdown period, so all economic variables from that time will look weak and divorced from normal conditions. Exports fell -47% y/y in May, led by mining exports, which were down -52% y/y. This is not surprising, given that mining production was down nearly -50% y/y in the month. More encouragingly, agro-industrial exports growth was nearly flat (-0.8% y/y), in line with our view that the sharper decline in April was due to supply-chain logistics (i.e., difficulties in obtaining packaging supplies) and that agro-industrial output itself was little impacted by the lockdown. Interestingly, the BCRP has begun releasing month-on-month growth figures. Exports in May were up 7.7% m/m from April; June should be even better.
Imports fell -38% y/y, in May. The decline in capital goods imports was particularly marked at -45% y/y as most investment projects were at least partially halted during May. The Quellaveco copper project was a significant exception. Consumer goods imports fell -31% y/y, which was not all that bad for a lockdown month. Consumer goods imports should recover more significantly with the unlocking of the economy. However, capital goods imports growth and oil imports growth (due to low prices) are likely to continue to be negative throughout the remainder of the year. Imports in May were -1.1%
m/m lower than April.
Despite the temporary deficits during the April–May lockdown, the trade balance for the year-to-May continued to be a negligibly positive at USD 230 mn. With mining and agro-industrial exports normalizing, terms of trade increasingly moving in Peru’s favour, and imports growth remaining rather low, the trade balance should turn decidedly more positive once again by July, and remain in the black for the foreseeable future. As it is, we maintain our forecast of a USD 6.6 bn trade surplus for full-year 2021.
The fiscal deficit in H1-2020 came in at PEN 11.2 bn. This represented a sharp turnaround from a PEN 9.8 bn surplus for the same period in 2019. Tax revenue was down -20.4% y/y in H1-2020, as Peru’s main income tax season, March–May, fell in the middle of the lockdown. Income tax revenue fell -13% y/y in H1-2020, in part due to tax relief measures that allowed businesses and individuals to defer their tax payments. Some of this revenue will be seen later on in the year; however, sales tax revenue, down -19% y/y, will mostly not be recovered.
Meanwhile, government spending fell by only -1.3% y/y, in H1-2020. Government current spending rose 10% y/y, whereas public investment plunged -42% y/y. This is not surprising, but it is a disappointment that fiscal spending is not being mobilized adequately to counter the crisis. On the positive side, low government spending is keeping the overall fiscal deficit smaller than would otherwise be the case. In fact, the fiscal balance is trending more in line with a 5% of GDP fiscal deficit than with our forecast of 9%. There is, however, still time for the government to pick up its spending pace. We expect this to happen, although we continue to have doubts about the State’s capacity to spend as fully as we would all like. Given this, although it’s too early to change our 9% deficit, we are starting to see a greater downside risk to it.
—Guillermo Arbe
DISCLAIMER
This report has been prepared by Scotiabank Economics as a resource for the clients of Scotiabank. Opinions, estimates and projections contained herein are our own as of the date hereof and are subject to change without notice. The information and opinions contained herein have been compiled or arrived at from sources believed reliable but no representation or warranty, express or implied, is made as to their accuracy or completeness. Neither Scotiabank nor any of its officers, directors, partners, employees or affiliates accepts any liability whatsoever for any direct or consequential loss arising from any use of this report or its contents.
These reports are provided to you for informational purposes only. This report is not, and is not constructed as, an offer to sell or solicitation of any offer to buy any financial instrument, nor shall this report be construed as an opinion as to whether you should enter into any swap or trading strategy involving a swap or any other transaction. The information contained in this report is not intended to be, and does not constitute, a recommendation of a swap or trading strategy involving a swap within the meaning of U.S. Commodity Futures Trading Commission Regulation 23.434 and Appendix A thereto. This material is not intended to be individually tailored to your needs or characteristics and should not be viewed as a “call to action” or suggestion that you enter into a swap or trading strategy involving a swap or any other transaction. Scotiabank may engage in transactions in a manner inconsistent with the views discussed this report and may have positions, or be in the process of acquiring or disposing of positions, referred to in this report.
Scotiabank, its affiliates and any of their respective officers, directors and employees may from time to time take positions in currencies, act as managers, co-managers or underwriters of a public offering or act as principals or agents, deal in, own or act as market makers or advisors, brokers or commercial and/or investment bankers in relation to securities or related derivatives. As a result of these actions, Scotiabank may receive remuneration. All Scotiabank products and services are subject to the terms of applicable agreements and local regulations. Officers, directors and employees of Scotiabank and its affiliates may serve as directors of corporations.
Any securities discussed in this report may not be suitable for all investors. Scotiabank recommends that investors independently evaluate any issuer and security discussed in this report, and consult with any advisors they deem necessary prior to making any investment.
This report and all information, opinions and conclusions contained in it are protected by copyright. This information may not be reproduced without the prior express written consent of Scotiabank.
™ Trademark of The Bank of Nova Scotia. Used under license, where applicable.
Scotiabank, together with “Global Banking and Markets”, is a marketing name for the global corporate and investment banking and capital markets businesses of The Bank of Nova Scotia and certain of its affiliates in the countries where they operate, including, Scotiabanc Inc.; Citadel Hill Advisors L.L.C.; The Bank of Nova Scotia Trust Company of New York; Scotiabank Europe plc; Scotiabank (Ireland) Limited; Scotiabank Inverlat S.A., Institución de Banca Múltiple, Scotia Inverlat Casa de Bolsa S.A. de C.V., Scotia Inverlat Derivados S.A. de C.V. – all members of the Scotiabank group and authorized users of the Scotiabank mark. The Bank of Nova Scotia is incorporated in Canada with limited liability and is authorised and regulated by the Office of the Superintendent of Financial Institutions Canada. The Bank of Nova Scotia is authorised by the UK Prudential Regulation Authority and is subject to regulation by the UK Financial Conduct Authority and limited regulation by the UK Prudential Regulation Authority. Details about the extent of The Bank of Nova Scotia's regulation by the UK Prudential Regulation Authority are available from us on request. Scotiabank Europe plc is authorised by the UK Prudential Regulation Authority and regulated by the UK Financial Conduct Authority and the UK Prudential Regulation Authority.
Scotiabank Inverlat, S.A., Scotia Inverlat Casa de Bolsa, S.A. de C.V., and Scotia Derivados, S.A. de C.V., are each authorized and regulated by the Mexican financial authorities.
Not all products and services are offered in all jurisdictions. Services described are available in jurisdictions where permitted by law.