Latam Economic Update
Argentina: Foreign debt exchange closed, sovereign re-rated
Chile: August CPI rose 0.1% m/m and 2.4% y/y; inflation expected to be higher in September and October
Colombia: Offsetting effects in August took headline inflation down to 1.88% y/y, the lowest since November 2013
Mexico: Investment and consumption hit inflection points in June; auto sector showed little progress in August; consumer confidence remained low last month
Peru: Tax revenue in August was in line with a mild rebound
ARGENTINA: FOREIGN DEBT EXCHANGE CLOSED, SOVEREIGN RE-RATED
Last week, Argentina closed its swap of USD 65 bn in foreign-law bonds in default and received a fresh CCC+ rating from S&P Global that took the country out of “selective default” status. New bonds from the swap were issued on Friday, September 4, and covered over 99% of the debt eligible for the exchange. As we’ve noted in the past, the exchange provided creditors with about 55 cents on each dollar of outstanding debt in default, which will translate into around USD 38 bn in debt relief over the next decade.
While the deal was a necessary step to re-open talks with the IMF on a new borrowing program, Economy Minister Guzman noted in interviews on Friday that the country would not be returning to international capital markets for some time. He vowed he would work to bring the country’s double-digit yields down before doing a new international issue.
—Brett House
CHILE: AUGUST CPI ROSE 0.1% M/M AND 2.4% Y/Y; INFLATION EXPECTED TO BE HIGHER IN SEPTEMBER AND OCTOBER
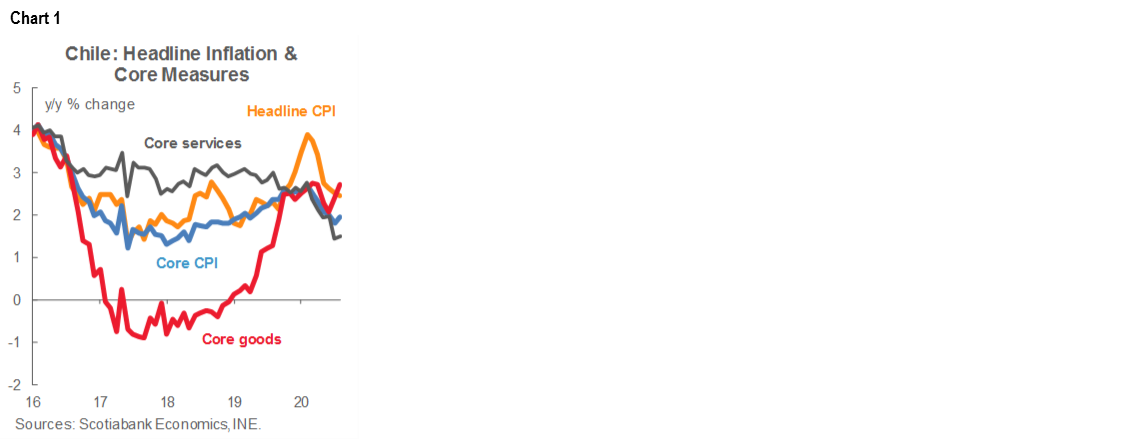
August inflation, out on Tuesday, September 8, reflected withdrawals from individual retirement accounts at the pension funds (chart 1). The national CPI increased 0.1% m/m in August (2.4% y/y), in line with our projections, with price increases in 9 of the 12 divisions. As expected, both food and alcoholic beverages prices rose again in the month and reached 6.3% y/y and 4.9% y/y growth, respectively, over the last 12 months. Clothing and footwear prices rose 2.3% m/m, ending recent price decline and marking one the fastest price increases for this division during the last eight years and one of the largest contributions to the month’s inflation reading. At least part of this was driven by demand for luxury goods as Chileans spent funds withdrawn from their AFP retirement accounts. The strong increase in retail sales led to stock shortages and is supporting our view that annual inflation would end 2020 at 2.2% y/y, somewhat below what the central bank projected in its last base scenario.
The item with the highest incidence in the month was rent, which increased 0.6% m/m and contributed 0.04 ppts to August headline inflation. The rent item likely has several sampling problems in the INE data given the enormous recent volatility in its readings. However, these are aspects where we see little capacity for technical improvements from the INE, and we will have to wait for price collection to normalize to see the real inflationary pressures at the housing level.
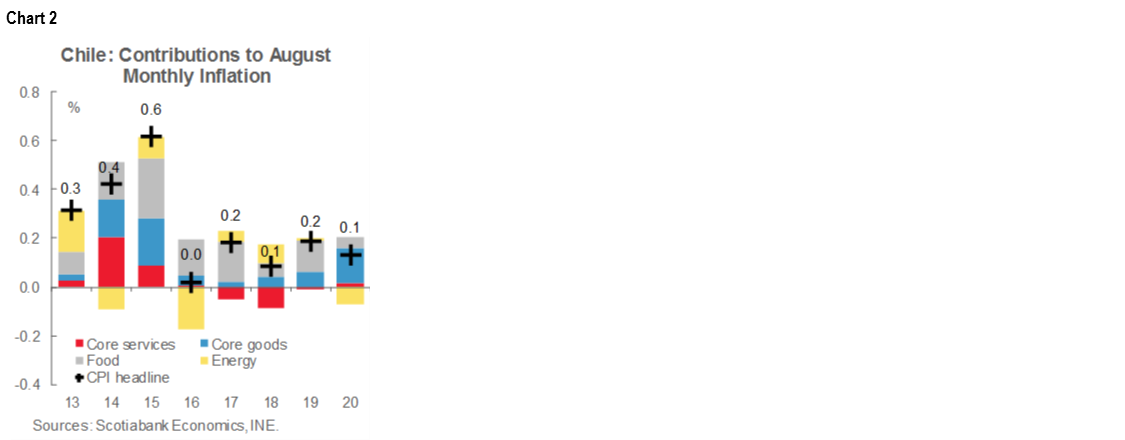
The increase in the August CPI is explained both by the increase in the core CPI for goods and by the upward trend in food prices, offset only in part by the declines in energy products (chart 2). Core CPI increased 0.2% m/m (1.9% y/y), with a rise of 0.5% m/m in goods (2.7% y/y) and a null monthly variation in services (1.5% y/y), which reflects the still-high degree of imputation in the services price data.
In September, the same imputation criteria applied in previous months are maintained, which would lead to an even a lower price imputation share for the period. From here onward, we should begin to see greater inflation volatility as the INE begins to collect prices again on items that have seen zero variation under imputation.
For September CPI, we project inflation between 0.2% m/m and 0.3% m/m. On the one hand, demand pressures from the withdrawal of pension funds has continued this month, with increases in transactions that have taken them to levels not very different from those observed during the Christmas period. On the other hand, the National Holidays (Sept. 18 and 19) will have a smaller impact than usual on inflation as a whole, but a still significant effect on food and beverages prices. In addition, as we have stated previously, fuel prices will begin to add to inflation this month and with greater intensity in October.
—Carlos Muñoz
COLOMBIA: OFFSETTING EFFECTS IN AUGUST TOOK HEADLINE INFLATION DOWN TO 1.88% Y/Y, THE LOWEST SINCE NOVEMBER 2013
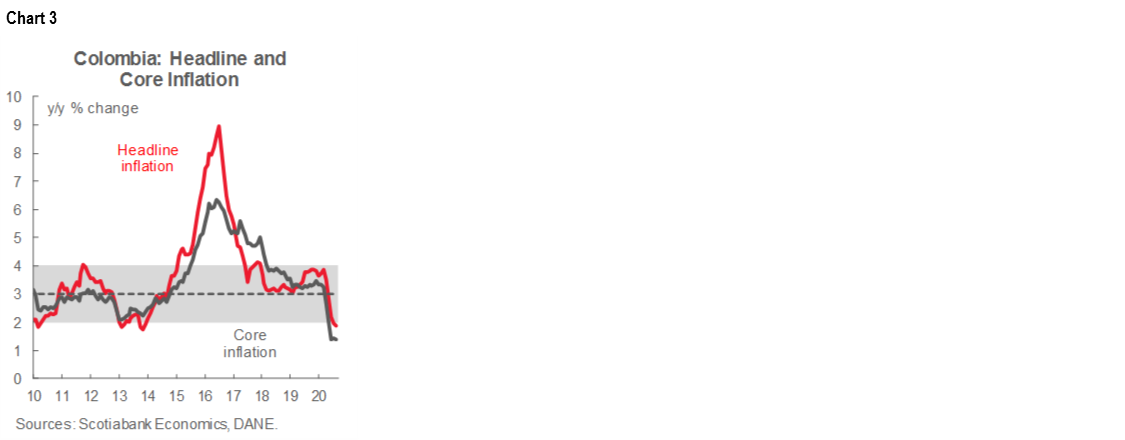
Monthly CPI inflation was -0.01% m/m in August, according to DANE’s data published on Saturday, September 5. The result came in below market expectations (0.09% m/m, according to the BanRep’s survey) and our projection of 0.37% m/m. August inflation resulted from offsetting effects between the upside impact on prices of the end of some government aid and a reduction in tuition fees in universities and technical education as a result of an extraordinary dropout rate. The annual inflation rate decreased by 9 bps from July to 1.88% y/y, the lowest since November 2013 (chart 3). Core inflation stood at 1.37% y/y (previous: 1.42% y/y). Although the core remained well below the central bank’s target range, it fell less than the headline figure.
The communications-related sector provided the largest positive contribution to headline inflation in August (3.60% m/m, chart 4; 14 bps, chart 5). The increase stemmed mainly from the expiry of a VAT reduction on mobile plans and similar behaviour is expected in September inflation. Price increases also came from transport costs, which received a boost from vehicle prices (0.54% m/m) and airline tickets (3.83% m/m). On the other side, the lodging and utilities group (0.07% m/m) increased less than expected as not all cities have yet withdrawn subsidies on power and water bills. Rental prices increased by 0.03% m/m, which brought them back to positive territory, although this was still below the historical average.
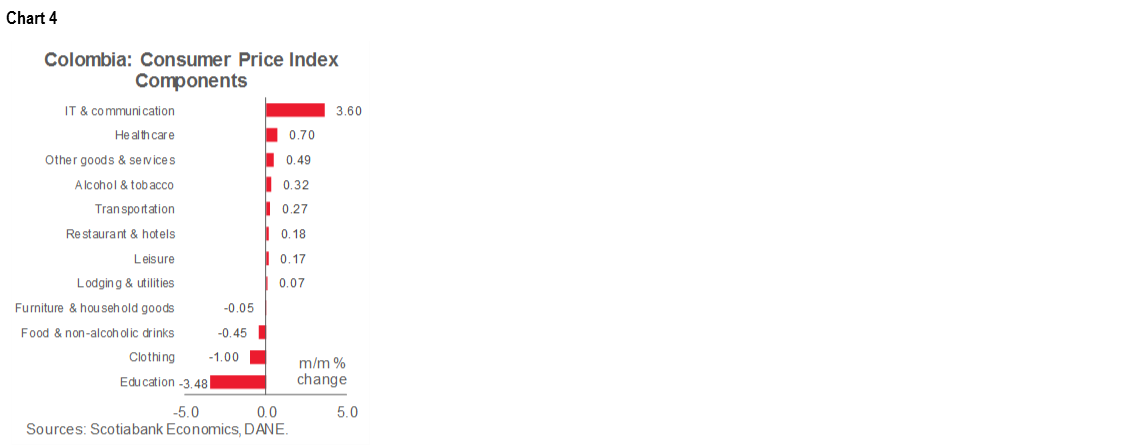
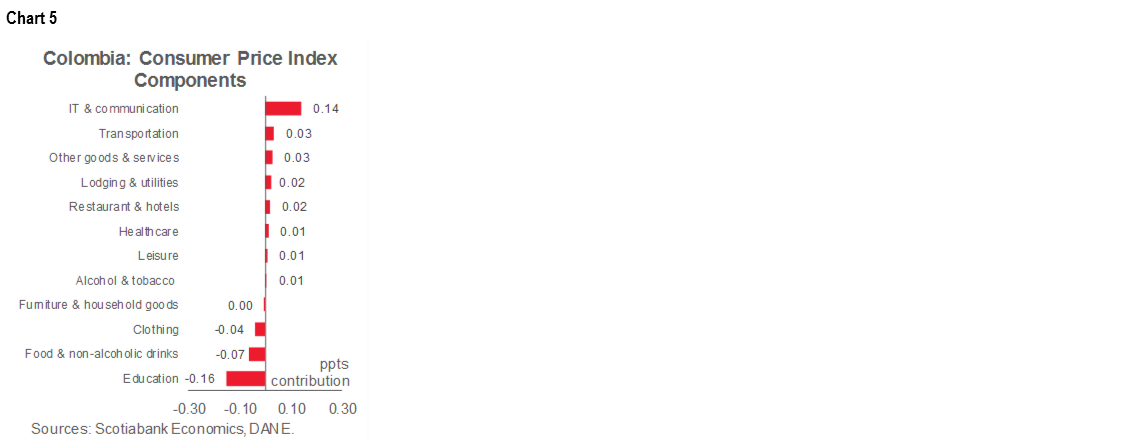
Foodstuffs inflation contributed negatively to the monthly figures (-7 bps), which partially offset price increases in other groups. Staple food prices, such as rice (-5.19% m/m), potatoes (-8.03% m/m), and eggs (-1.96% m/m), contributed the most to the negative inflation result in this group. We think food inflation could remain low for the rest of the year.
The main surprise came from education prices, which fell by -3.48% m/m, contributing negatively by -16 bps. The shock to incomes from pandemic control measures led to significant dropout rates, which motivated a considerable reduction in tuition fees in universities and technical education institutes (-9.49% m/m). Additionally, clothing inflation contracted (-1.00% m/m, contribution -4 bps), resulting from weakening demand.
Goods inflation increased by 8 bps to 0.99% y/y and services inflation stood at 1.79% y/y (previous: 1.94% y/y), while regulated prices increased by 11 bps to 0.59% y/y. Core inflation measures fell again well below the central bank floor of the target range (2%). Ex-food inflation came in at 1.37% y/y (-5 bps from the previous month), while ex-food and regulated inflation came down by 10 bps to 1.57% y/y.
Altogether, August’s CPI inflation showed a huge negative demand effect on education and clothing prices, which offset the withdrawals of government subsidies and increases in other prices. In September, we anticipate negative inflation in the education group owing to changes in school tuition fees. However, the “new normal” started in Colombia in September, so some prices will likely begin to contribute positively to inflation again due to added biosecurity costs. Yearly inflation is expected to begin rising in 2021. We still expect next year’s annual inflation rate to converge to BanRep’s 3% target.
As August’s CPI results pointed to weaker demand, the outlook is now skewed toward another -25 bps cut to a 1.75% at the September 25 BanRep meeting. We think that monetary policy will continue to evolve cautiously since some reversal effect has not yet completely materialized in CPI inflation.
—Sergio Olarte & Jackeline Piraján
MEXICO: INVESTMENT AND CONSUMPTION HIT INFLECTION POINTS IN JUNE; AUTO SECTOR SHOWED LITTLE PROGRESS IN AUGUST; CONSUMER CONFIDENCE REMAINED LOW LAST MONTH
Gross fixed investment (GFI) for June, published on Monday, September 7, continued to register year-on-year declines, but the pace slowed from May (chart 6). On a monthly basis, however, investment showed solid growth, after most non-essential activities resumed. Nevertheless, a high level of uncertainty still prevails, which affects the business environment, reflected in very weak business confidence and the worst economic outlook for Mexico in recent history as a result of the health crisis caused by COVID-19.

GFI in real nsa terms moderated its decline in June, from -39.9% y/y to -24.1% y/y (versus -24.4% y/y consensus and -9.2% y/y a year earlier), its seventeenth consecutive decline—a negative trend that exceeds the 16 straight declines registered in the period 2000–02 and the 14 registered in 2008–09 and 1994–96, respectively. It averaged a decline of -21.4% in January–June, also the deepest for the first half in 25 years.
- By components, equipment and machinery investment’s setback softened from -46.7% y/y in May, to -21.4% y/y in June. Domestic machinery investment dropped from -56.0% y/y to -36.1% y/y, while investment in imported machinery and equipment contracted further, going from -40.1% y/y in May to -9.3% y/y in June.
- Construction investment slowed its decline from -34.2% y/y to -26.0% y/y, with its residential sub-component improving from -37.5% y/y to -23.6% y/y and the non-residential component up from -30.7% y/y to -28.3% y/y.
- On a monthly basis, GFI with sa figures rose for the first time after four continuous slides, going from a contraction of -4.5% m/m to a record pace of 20.1% m/m, the fastest since at least 1984; in construction it increased 13.7% m/m and in machinery and equipment it grew 25.8% m/m.
II. Consumption firms up, for now
Private consumption pared its year-on-year plunge in real nsa figures for June (chart 7). The data showed a relatively slow pace of recovery since the gradual re-opening of the country’s economic activities was already underway by the end of the first half. The fall in the physical volume index of private consumption in the domestic market, measured with nsa figures, narrowed from -24.8% y/y in May to -18.3% y/y in June (versus 0.0% y/y a year earlier), its largest drop for any June since at least 1994.
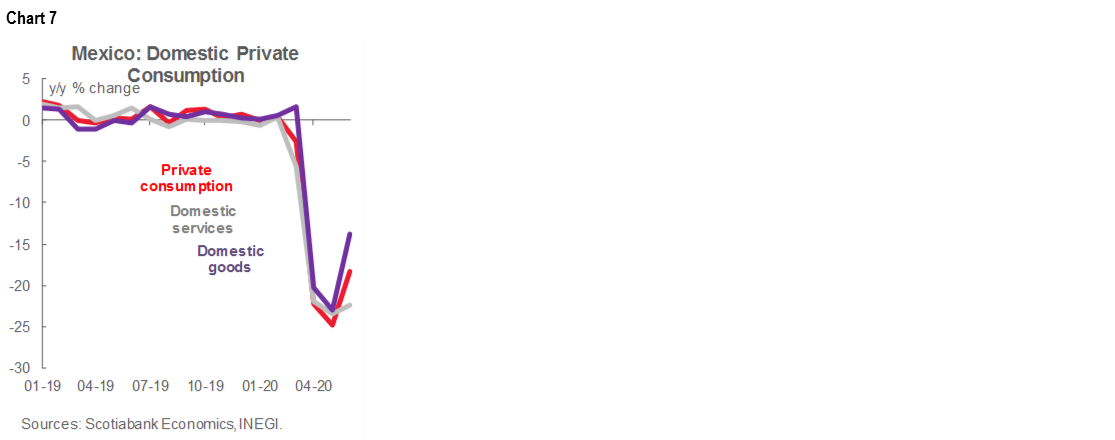
- Services consumption growth came up slightly from -23.4% y/y in May to -22.4% y/y (versus 1.5% y/y a year earlier).
- Domestic goods consumption growth rose from -23.1% y/y in May to -13.8% y/y (versus -0.3% y/y a year earlier).
- Imported goods consumption growth firmed up from -38.1% y/y in May to -19.0% y/y (versus -5.1% y/y in June 2019).
In the seasonally-adjusted monthly data, private consumption grew at its highest pace on record, going from -1.7% m/m to 5.5% m/m in June, driven, predictably, by the re-opening processes that began throughout the country.
In the first half of 2020, private consumption growth averaged a rate of -11.3% y/y (versus 0.7% y/y in a similar period in 2019), its weakest rate for the same period since records began in 1994.
We maintain our expectation of weak domestic private consumption growth for the rest of the year, driven by a highly uncertain economic environment that could, in turn, foster a more cautious attitude among consumers.
III. Auto sector advances slowed in August
Auto sector advances slowed in August data released on Friday, September 4. Auto production was down -13.2% y/y during August; although the cumulative January-August modestly curbed its reduction from -35.5% y/y to -32.6% y/y (chart 8). Domestic vehicle sales moderately mitigated their year-on-year contraction to -28.7% y/y, against export growth, which deepened its deterioration to -8.6% y/y.
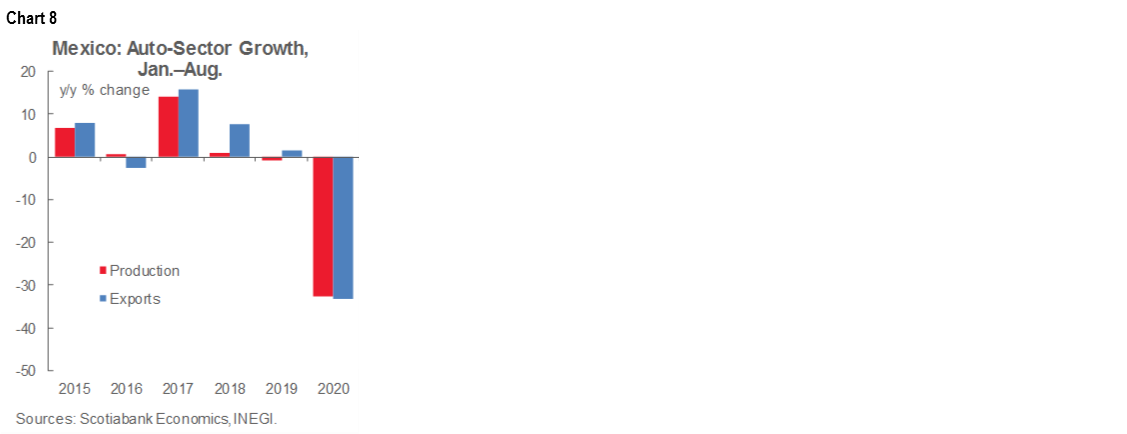
In month-on-month terms, domestic vehicle sales and exports moderated their progress to 5.8% m/m and 0.6% m/m, respectively. The results imply a slow rebound in domestic vehicle sales, which has been moderated by the weakness of the domestic outlook even though many activities have resumed. Additionally, only gradual recovery in the production and export of vehicles is linked to progress in sales in the US and Canada. Looking forward, we maintain our expectation of a slow recovery in the sector with downside risks, subject to the persistent degree of uncertainty.
IV. August consumer confidence strengthens
On Friday, September 4, INEGI published its National Survey on Consumer Confidence for August, which marked some progress while still showing persistent signs of high economic uncertainty. The consumer confidence index (CCI) remained at 35.1 points in nsa terms, still lower than a year earlier by 8.8 points and marking a ninth consecutive month where the index was lower than in the same month a year before. Still, there were some positive signs in the reading: the index rose for a third month in a row, although by a modest 0.6 points from July to August, taking the CCI to its highest level since April, Looking at the CCI’s components, those that relate to the current and expected situation of households deteriorated, while, in contrast, those related to perceptions of households’ economic situation improved from July to August. At the same time, perceptions of the country’s current and future economic outlook, as well as the possibility of acquiring durable goods, worsened.
—Miguel Saldaña
PERU: TAX REVENUE IN AUGUST IN LINE WITH A MILD REBOUND
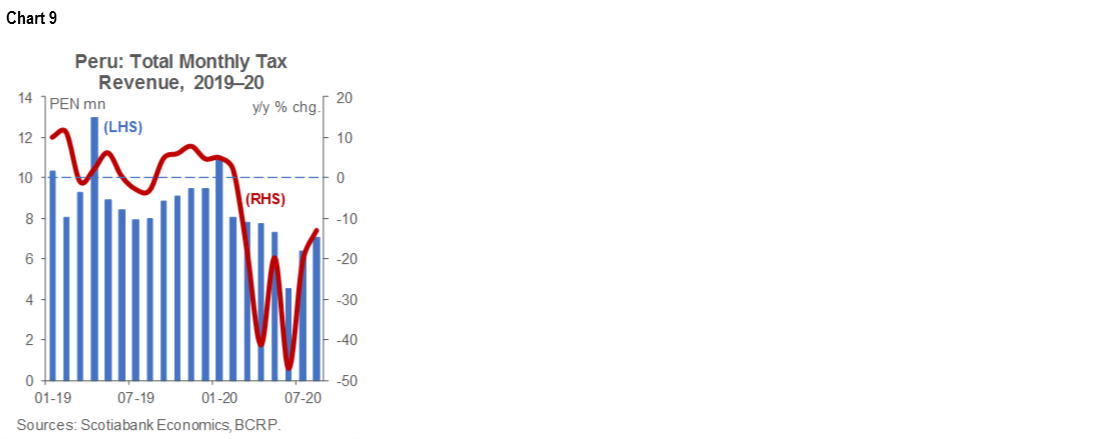
Tax revenue in August was down 13% y/y (chart 9), according to figures released over the weekend by Sunat, the tax agency. This was not good—but also not that bad. It was the best month (i.e., the softest decline) since February, and 10% better than July. However, 10% better than July, with an absolute number of PEN 7.1 bn, was not really good enough. On the other hand, the results would likely have been better, and more in line with a rebounding in economy, if not for tax relief measures that were still in force in August. The government provided a number of measures in March, at the beginning of the lockdown, that allowed companies and individuals to postpone tax payments. August is a difficult month to interpret, as some of the tax relief measures were lifted, but others will last until September. Thus, September will actually be the key to see how the tax revenue trend is performing. In the details, income tax revenue fell -14.5%, y/y, while sales tax (domestic) was down -11% y/y.
—Guillermo Arbe
DISCLAIMER
This report has been prepared by Scotiabank Economics as a resource for the clients of Scotiabank. Opinions, estimates and projections contained herein are our own as of the date hereof and are subject to change without notice. The information and opinions contained herein have been compiled or arrived at from sources believed reliable but no representation or warranty, express or implied, is made as to their accuracy or completeness. Neither Scotiabank nor any of its officers, directors, partners, employees or affiliates accepts any liability whatsoever for any direct or consequential loss arising from any use of this report or its contents.
These reports are provided to you for informational purposes only. This report is not, and is not constructed as, an offer to sell or solicitation of any offer to buy any financial instrument, nor shall this report be construed as an opinion as to whether you should enter into any swap or trading strategy involving a swap or any other transaction. The information contained in this report is not intended to be, and does not constitute, a recommendation of a swap or trading strategy involving a swap within the meaning of U.S. Commodity Futures Trading Commission Regulation 23.434 and Appendix A thereto. This material is not intended to be individually tailored to your needs or characteristics and should not be viewed as a “call to action” or suggestion that you enter into a swap or trading strategy involving a swap or any other transaction. Scotiabank may engage in transactions in a manner inconsistent with the views discussed this report and may have positions, or be in the process of acquiring or disposing of positions, referred to in this report.
Scotiabank, its affiliates and any of their respective officers, directors and employees may from time to time take positions in currencies, act as managers, co-managers or underwriters of a public offering or act as principals or agents, deal in, own or act as market makers or advisors, brokers or commercial and/or investment bankers in relation to securities or related derivatives. As a result of these actions, Scotiabank may receive remuneration. All Scotiabank products and services are subject to the terms of applicable agreements and local regulations. Officers, directors and employees of Scotiabank and its affiliates may serve as directors of corporations.
Any securities discussed in this report may not be suitable for all investors. Scotiabank recommends that investors independently evaluate any issuer and security discussed in this report, and consult with any advisors they deem necessary prior to making any investment.
This report and all information, opinions and conclusions contained in it are protected by copyright. This information may not be reproduced without the prior express written consent of Scotiabank.
™ Trademark of The Bank of Nova Scotia. Used under license, where applicable.
Scotiabank, together with “Global Banking and Markets”, is a marketing name for the global corporate and investment banking and capital markets businesses of The Bank of Nova Scotia and certain of its affiliates in the countries where they operate, including, Scotiabanc Inc.; Citadel Hill Advisors L.L.C.; The Bank of Nova Scotia Trust Company of New York; Scotiabank Europe plc; Scotiabank (Ireland) Limited; Scotiabank Inverlat S.A., Institución de Banca Múltiple, Scotia Inverlat Casa de Bolsa S.A. de C.V., Scotia Inverlat Derivados S.A. de C.V. – all members of the Scotiabank group and authorized users of the Scotiabank mark. The Bank of Nova Scotia is incorporated in Canada with limited liability and is authorised and regulated by the Office of the Superintendent of Financial Institutions Canada. The Bank of Nova Scotia is authorised by the UK Prudential Regulation Authority and is subject to regulation by the UK Financial Conduct Authority and limited regulation by the UK Prudential Regulation Authority. Details about the extent of The Bank of Nova Scotia's regulation by the UK Prudential Regulation Authority are available from us on request. Scotiabank Europe plc is authorised by the UK Prudential Regulation Authority and regulated by the UK Financial Conduct Authority and the UK Prudential Regulation Authority.
Scotiabank Inverlat, S.A., Scotia Inverlat Casa de Bolsa, S.A. de C.V., and Scotia Derivados, S.A. de C.V., are each authorized and regulated by the Mexican financial authorities.
Not all products and services are offered in all jurisdictions. Services described are available in jurisdictions where permitted by law.