Latam Economic Update
Argentina: More signs the economy has passed its pandemic bottom
Brazil: Unanimous Copom vote cuts the Selic rate -25 bps to 2.00%, doesn’t shut the door on further easing
Chile: Central bank will be able to buy sovereign bonds in a few more days
Colombia: Zero monthly inflation in July takes headline rate down to 1.97% y/y, the slowest rise since September 2013
Mexico: June’s unemployment rate rose to an eight-year high
Peru: Mining output and investment improved nicely in June
ARGENTINA: MORE SIGNS THE ECONOMY HAS PASSED ITS PANDEMIC BOTTOM
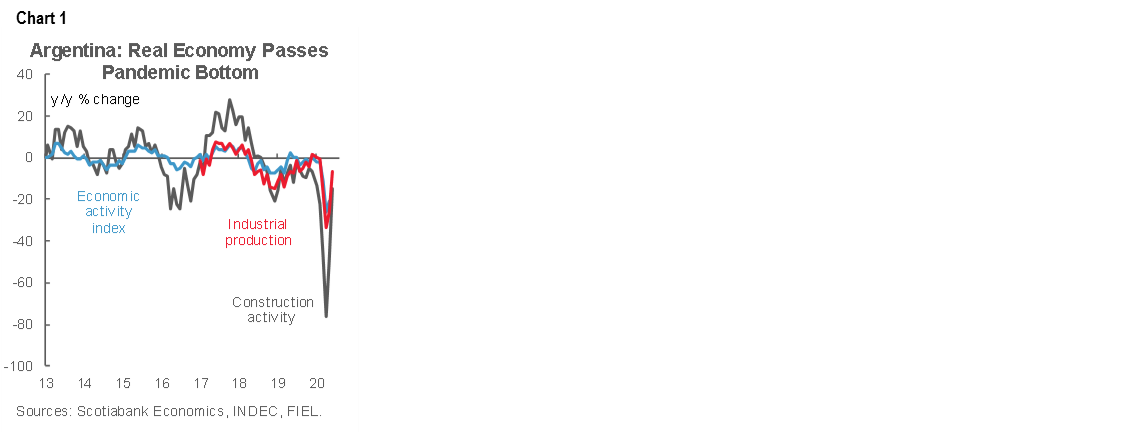
Major sectors of Argentina’s real economy continued to pare their losses from the worst of the shutdown in April and May. Industrial production was down “only” -6.6% y/y in June, a big improvement from -26.4% y/y in May (chart 1). Similarly, construction activity was off -14.8% y/y in June compared with -48.6% y/y in May. Together, these two sectors account for about a quarter of GDP. It’s worth noting, however, that even with the evident end of hemorrhaging in both sectors, even a full return to last year’s levels of activity would only bring industrial and construction back to numbers consistent with the second of Argentina’s now three straight years of recession. A real recovery is still substantially far off and last year’s low bar shouldn’t obscure this fact.
Vehicle numbers for July imply that industrial production should continue to see gains in its July print (chart 2). Vehicle production returned in July to the lower range of pre-lockdown levels, down only -1.5% y/y from July 2019. Domestic sales, however, plateaued, down -42.7% y/y from July 2019, as lockdown measures continued to dampen retail traffic. Similarly, exports were still only about half of their July 2019 numbers (-51.7% y/y) even after a nearly 40% m/m rise.

July saw government tax revenue rise for a fifth straight month, which took monthly collections to ARS 559 bn, a new high in nominal terms (chart 3). The Hacienda data, out on Tuesday, August 4, represented a 24% y/y gain over July 2019 for a third straight month of accelerating increases as economic activity re-opens.
—Brett House

BRAZIL: UNANIMOUS COPOM VOTE CUTS THE SELIC RATE -25 BPS TO 2.00%, DOESN’T SHUT THE DOOR ON FURTHER EASING
As both we and markets expected, the BCB cut the Selic rate -25 bps from 2.25% to 2.00% in a unanimous decision on Wednesday, August 5 (chart 4). The Copom continues to see two-sided risks to inflation that are playing tug-of-war with each other: on the downside, the output gap provides a dampener on prices, while the country’s weakening fiscal stance and increasing risk premium are providing upward pressure on prices. The policy reform process—particularly the fiscal reform—is mentioned several times in the Copom’s statement. At present, it seems that one of the major factors, if not the key one, driving the BCB’s more cautious stance on rates (recall that it cut -75 bps at its prior meeting in June) relates to risk premia. However, in our view, the most important part of the statement with respect to expectations and yield curve moves was that the Copom did not seem to shut the door on further easing: instead, it noted that the room for additional easing is likely small and further moves would likely be marginal.

July IPCA inflation is scheduled to be released on Friday, August 7, and although it’s expected to continue rising, it remains over 150 bps below the mid-point of the BCB’s inflation target. The DI rates curve is pricing in a 25% probability of a final -25 bps Selic rate cut to 1.75%, and we expect the Copom to deliver this terminal move for this easing cycle at its September meeting.
—Eduardo Suárez
CHILE: CENTRAL BANK WILL BE ABLE TO BUY SOVEREIGN BONDS IN A FEW MORE DAYS
The Constitutional Committee of the Chamber of Deputies, Congress’ lower house, unanimously approved on Tuesday, August 4, the proposed reform that would allow the central bank to buy and sell, on an exceptional basis, debt instruments issued by Chile’s Treasury in secondary markets. This initiative contemplates a series of restrictions in order to maintain the intended "exceptional" nature of these asset purchases. Among other things, an extraordinary super majority is established that would require four of the five members of the BCCh’s Board to approve transactions with a specific instrument. As well, the presence of the Minister of Finance at the vote would be mandatory.
We expect this constitutional amendment to be approved and implemented next week. The provision of these new powers to the central bank would be timely. Following the implementation of the “10% law” that allows early withdrawals from individual retirement accounts, the AFPs are making divestments to free up liquidity that could reach USD 20 bn during the coming days. These moves may include up to USD 5 bn in sovereign bonds; the proposed new powers for the BCCh would allow it to mop some of this secondary-market supply and carry out quantitative easing to avoid a rise in yields. The central bank already has a line open to buy up to USD 8 bn in bank bonds (and sovereign bonds once the constitutional amendment is approved).
—Jorge Selaive
COLOMBIA: ZERO MONTHLY INFLATION IN JULY TAKES HEADLINE RATE DOWN TO 1.97% Y/Y, THE SLOWEST RISE SINCE SEPTEMBER 2013
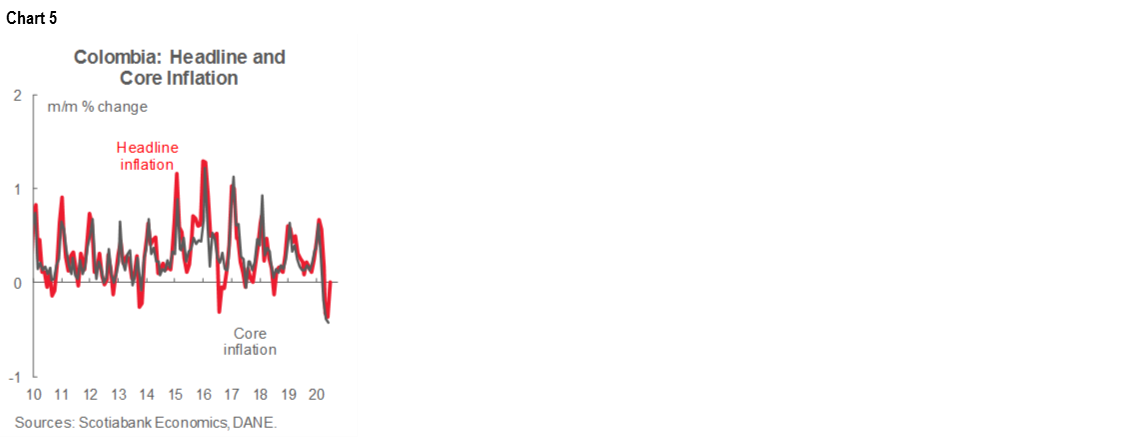
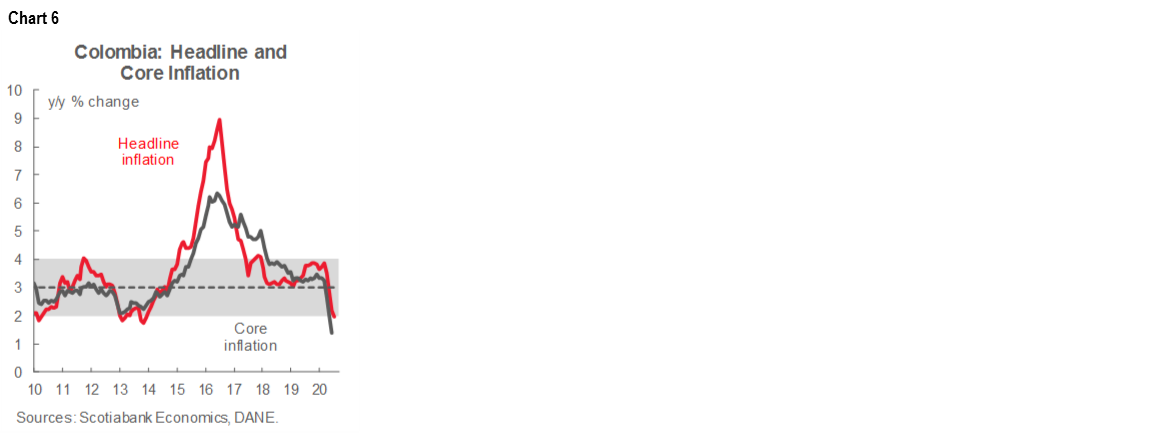
Monthly CPI inflation was null (0% m/m) in July, according to DANE’s data published on late on Wednesday, August 5 (chart 5). The result came in above market expectations (-0.13% m/m, according to the BanRep survey) and our projection of -0.17% m/m. Flat July inflation was a result of offsetting effects between reductions in foodstuff prices and price increases in other groups. It is worth noting that July’s inflation numbers also reflect the withdrawal of local government support for utility charges, as we anticipated in previous reports; this pushed inflation up a bit in the month. The annual inflation rate decreased by 22 bps to 1.97% y/y, the lowest level since 2013 (chart 6). Core inflation was broadly unchanged and stood at 1.42% y/y in July. Although core remained well below the central bank’s target range it slowed its downturn trend.
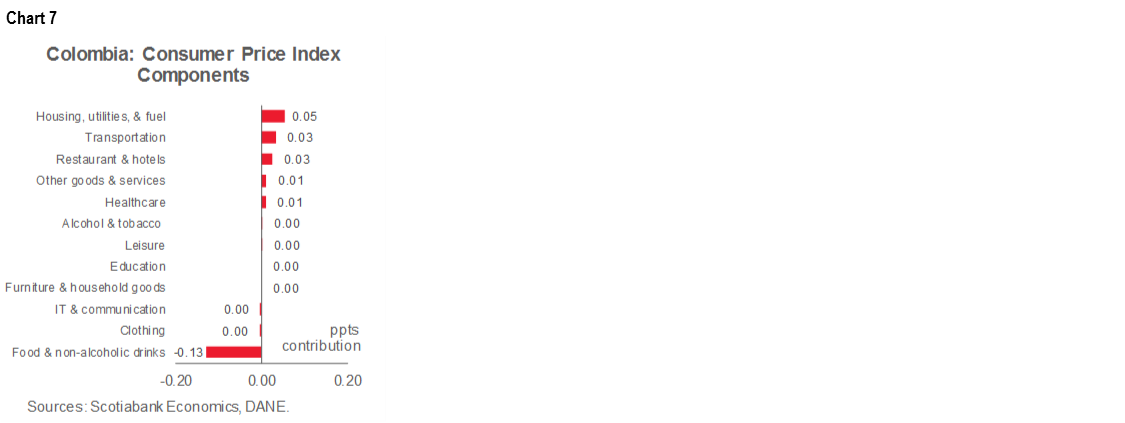
The lodging and utilities sector provided the largest positive contribution to headline inflation in June at 5 bps (chart 7). The increase was particularly driven by the rise in utility fees in two relatively small cities, Pereira y Pasto, after regional governments there withdrew significant subsidies on power and water bills. Rental prices contracted by -0.03% m/m, a rare event that points to weakening demand.
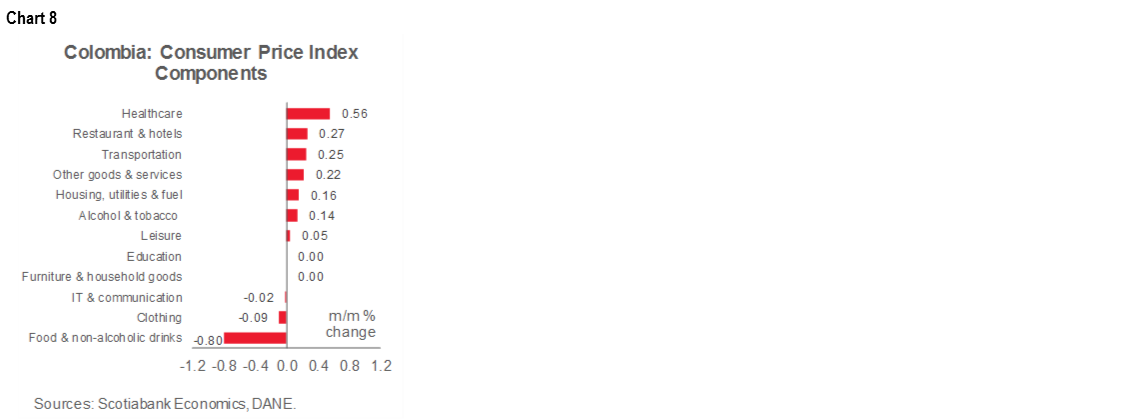
Price increases also came from healthcare (up 0.56% m/m), the transport group (up 0.25% m/m), and restaurants (up 0.27% m/m, chart 8). Transport costs received a boost from vehicle prices (0.80% m/m) which could be a result of FX pass-through effects and stronger than expected demand. Restaurants' biosecurity protocols led to price increases in that sector.
Foodstuff inflation contributed negatively to the monthly figures (-13 bps, chart 7 again), which offset price increases in other groups. Staple food prices, such as rice (-3.28% m/m), fruits (-3.81% m/m), eggs (-3.35% m/m) and potatoes (-6.66% m/m), contributed the most to the negative inflation result in this group. We think food inflation could remain low for the rest of the year.
Altogether, July’s CPI inflation showed the effects of the end of aid for utilities in some small cities. In August, we expect a more robust rebound in monthly inflation, but the yearly figure is expected to start rising only in 2021. We still expect next year’s annual inflation rate to converge to BanRep’s 3% target.
The July CPI results are aligned with our expectation of a further -25 bps cut to a terminal 2.00% at the August 31 BanRep meeting, under a data-dependent approach from the central bank. We think that monetary policy will continue to evolve cautiously since the decline in CPI inflation is partially artificial and is starting to reverse itself.
—Sergio Olarte & Jackeline Piraján
MEXICO: JUNE’S UNEMPLOYMENT RATE ROSE TO AN EIGHT-YEAR HIGH
The Telephone Survey of Occupations and Employment (ETOE) in June was published on Wednesday, August 5, by INEGI—its third telephone-based survey as the pandemic has hampered full face-to-face data collection. Despite the results not being strictly comparable to those of the usual National Occupations and Employment Survey (ENOE), given its different methodology, the ETOE provides a useful approximation of the labour market’s usual reference measures. Furthermore, INEGI noted that the June ETOE “incorporated a sample of interviews carried out face-to-face.” The most relevant data include:
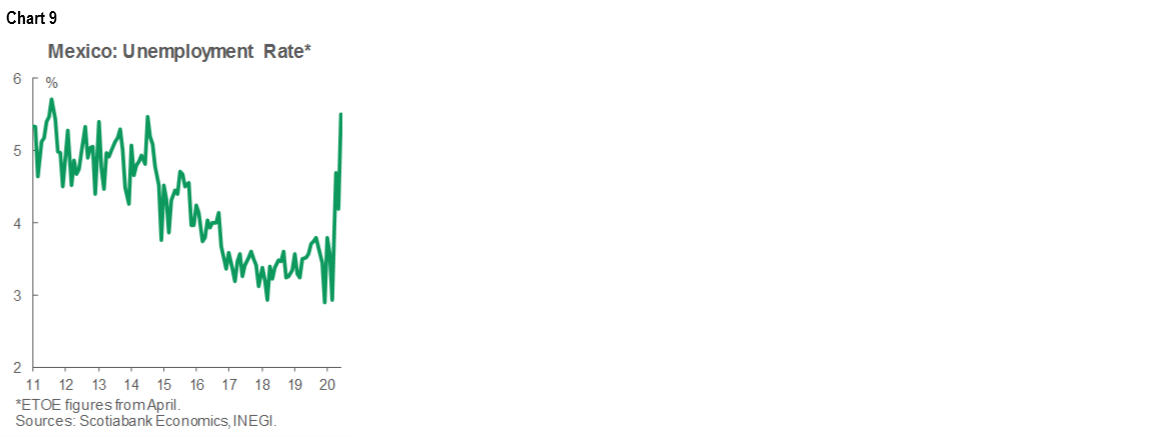
- The economically active population (EAP) expanded by 5.7 mn people to 51.1 mn between May and June. The labour-market participation rate rose from 47.4% to 53.1% of the working-age population, driven mainly by the increase of 4.8 mn people in the employed population (POC), while there was also a 901k person increase in the unemployed population. This resulted in an increase in the unemployment rate (nsa) from 4.2% to 5.5% of the EAP, the highest since September 2011 (chart 9);
- The underemployed population (i.e., employed people with the need and availability to offer more work time) decreased by 3.3 mn people, to stand at 9.7 mn, which meant a reduction in the underemployment rate from 20.9% to 20.1%;
- Meanwhile, the labour informality rate rose from 51.8% to 53.0%, reflecting 25.6 mn people working in the informal sector; and
- Likewise, within the POC, there was a reduction in temporary absentees amongst people who have a relationship with an employer (down by 2.4 mn people), an increase in people working full-time hours (up by 4.4 mn people), and a rise in employed persons with incomes between one and two minimum wage equivalents (up by 3.5 mn people).
The ETOE showed a clear recovery in employment in June compared to May, driven by the fragile normalization of economic activity. Higher rates of unemployment and informality reflect more people looking for job opportunities even as formal employment prospects are still constrained by the crisis. For the year as a whole, we still anticipate a strong hit to total employment and a loss of 1.6 mn formal jobs during 2020.
—Daniel Mendoza
PERU: MINING OUTPUT AND INVESTMENT IMPROVED NICELY IN JUNE
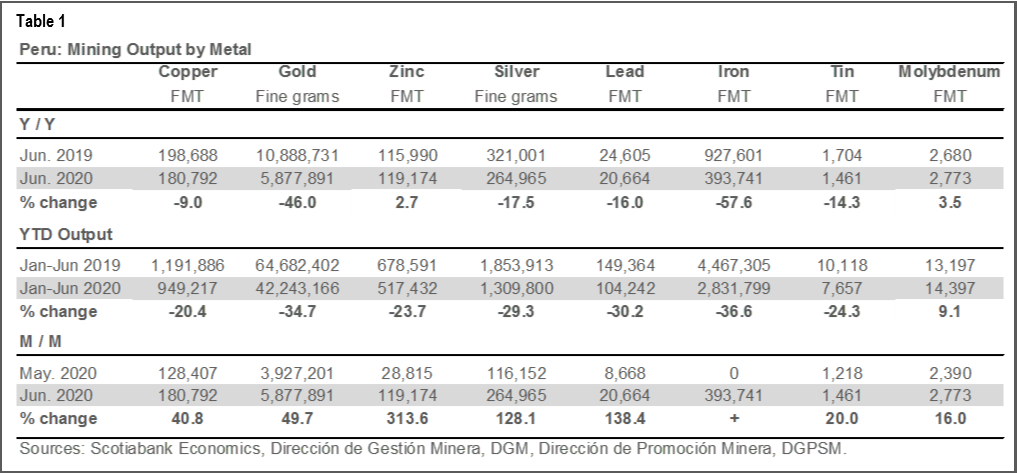
June witnessed a healthy rebound in mining output according to a release by the Ministry of Energy and Mines on Wednesday, August 5. While output was still lower in y/y terms for most metals, production was sharply higher in m/m terms (table 1). A key case in point was copper output, down -9% y/y in June, but up 40.8% m/m versus May. Zinc and molybdenum put on a rather impressive performance in June: both rose on y/y terms, as well as on m/m terms, with zinc more than quadrupling output in June over May. Compared to May, output for all metals was up in June by at least double-digit percentages and in many cases output rose by triple-digit sequential growth rates. Breaking the numbers down by companies, the story was much more varied. Southern Peru was the only major copper producer to see output rise in annual terms (12.7%y/y) in June; for zinc, Antamina (up 53.6% y/y) and Los Quenuales (up 254.0% y/y) were the main forces behind the surge in production.
There has been news of COVID-19 outbreaks at some mines, which could slow the normalization process to some extent, but apparently any impact has so far been modest. With metal prices performing so well, companies have added motivation to ramp up production quickly.
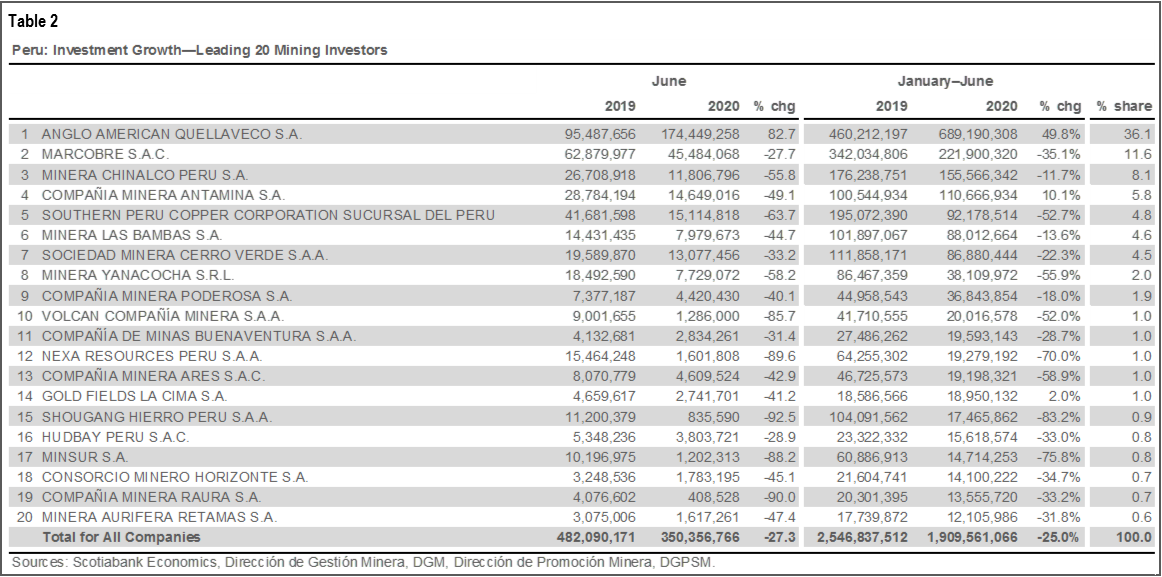
In contrast with the rise in output, June was a lukewarm month for mining investment (table 2). From a glass half-empty point of view, investment was down -27% y/y and 25% y/y in H1-2020 compared to H1-2019. From a glass half-full perspective, June saw the second-best monthly investment numbers so far this year, with mining investment up 43.7% m/m versus May. Although the -25% y/y decline in investment in H1 is in line with our forecast of a -28% y/y decline in full-year 2020, it will be crucial for investment to return to near normal levels in July and then for growth to turn (mildly) positive, in y/y terms, in the final months of the year for our forecast to be realized. These prospects remain at risk when one considers the possible breakdown by company. In truth, only one mine, Quellaveco, is clearly accelerating its investment in any significant way. At other companies, the return to normal has been delayed and investment was still weak in June. If and when these other companies return to more usual operations, overall mining investment growth should actually become moderately strong with the additional weight of Quellaveco. At the same time, though, it is not clear that all companies will be able return to their usual investment plans in the near term, and some may not be able to do so at all.
—Guillermo Arbe
DISCLAIMER
This report has been prepared by Scotiabank Economics as a resource for the clients of Scotiabank. Opinions, estimates and projections contained herein are our own as of the date hereof and are subject to change without notice. The information and opinions contained herein have been compiled or arrived at from sources believed reliable but no representation or warranty, express or implied, is made as to their accuracy or completeness. Neither Scotiabank nor any of its officers, directors, partners, employees or affiliates accepts any liability whatsoever for any direct or consequential loss arising from any use of this report or its contents.
These reports are provided to you for informational purposes only. This report is not, and is not constructed as, an offer to sell or solicitation of any offer to buy any financial instrument, nor shall this report be construed as an opinion as to whether you should enter into any swap or trading strategy involving a swap or any other transaction. The information contained in this report is not intended to be, and does not constitute, a recommendation of a swap or trading strategy involving a swap within the meaning of U.S. Commodity Futures Trading Commission Regulation 23.434 and Appendix A thereto. This material is not intended to be individually tailored to your needs or characteristics and should not be viewed as a “call to action” or suggestion that you enter into a swap or trading strategy involving a swap or any other transaction. Scotiabank may engage in transactions in a manner inconsistent with the views discussed this report and may have positions, or be in the process of acquiring or disposing of positions, referred to in this report.
Scotiabank, its affiliates and any of their respective officers, directors and employees may from time to time take positions in currencies, act as managers, co-managers or underwriters of a public offering or act as principals or agents, deal in, own or act as market makers or advisors, brokers or commercial and/or investment bankers in relation to securities or related derivatives. As a result of these actions, Scotiabank may receive remuneration. All Scotiabank products and services are subject to the terms of applicable agreements and local regulations. Officers, directors and employees of Scotiabank and its affiliates may serve as directors of corporations.
Any securities discussed in this report may not be suitable for all investors. Scotiabank recommends that investors independently evaluate any issuer and security discussed in this report, and consult with any advisors they deem necessary prior to making any investment.
This report and all information, opinions and conclusions contained in it are protected by copyright. This information may not be reproduced without the prior express written consent of Scotiabank.
™ Trademark of The Bank of Nova Scotia. Used under license, where applicable.
Scotiabank, together with “Global Banking and Markets”, is a marketing name for the global corporate and investment banking and capital markets businesses of The Bank of Nova Scotia and certain of its affiliates in the countries where they operate, including, Scotiabanc Inc.; Citadel Hill Advisors L.L.C.; The Bank of Nova Scotia Trust Company of New York; Scotiabank Europe plc; Scotiabank (Ireland) Limited; Scotiabank Inverlat S.A., Institución de Banca Múltiple, Scotia Inverlat Casa de Bolsa S.A. de C.V., Scotia Inverlat Derivados S.A. de C.V. – all members of the Scotiabank group and authorized users of the Scotiabank mark. The Bank of Nova Scotia is incorporated in Canada with limited liability and is authorised and regulated by the Office of the Superintendent of Financial Institutions Canada. The Bank of Nova Scotia is authorised by the UK Prudential Regulation Authority and is subject to regulation by the UK Financial Conduct Authority and limited regulation by the UK Prudential Regulation Authority. Details about the extent of The Bank of Nova Scotia's regulation by the UK Prudential Regulation Authority are available from us on request. Scotiabank Europe plc is authorised by the UK Prudential Regulation Authority and regulated by the UK Financial Conduct Authority and the UK Prudential Regulation Authority.
Scotiabank Inverlat, S.A., Scotia Inverlat Casa de Bolsa, S.A. de C.V., and Scotia Derivados, S.A. de C.V., are each authorized and regulated by the Mexican financial authorities.
Not all products and services are offered in all jurisdictions. Services described are available in jurisdictions where permitted by law.