ON DECK FOR MONDAY, MARCH 16th
KEY POINTS:
- Sovereign yields edge lower on calmer oil prices
- Canadian CPI to add to the list of readings to be faded by the BoC…
- …as forward-looking risks to the inflation outlook dominate…
- …while February’s job loss had several distortions as reasons to fade…
- …and GDP figures have masked a domestic economy rebound
- China’s economy posts some encouraging signs…
- …but the property market remains weak as prices continue to slide
- Light US data—industrial output, Empire, homebuilder confidence
- Will the RBA hike tonight?
- Global (Two) Week Ahead—No Two Are the Same (reminder here)
Markets are kicking off a fresh trading week with mixed evidence on risk appetite. The dollar is broadly softer against major currencies which is usually a risk-on signal. Ditto for US equity futures. Yet most European equity cash markets are lower except for a tiny gain in London, while sovereign yields are down by 2–5bps across major global benchmarks by country and maturity with the Antipodeans being an exception into the RBA’s potential hike tonight.
What explains the differences across asset classes? Perhaps relative calm in energy markets. WTI is off by over a buck at the time of publication, with Brent down a couple of dimes. Markets are caught in a stalemate situation between fresh developments across the middle east but in my opinion, there is no clear traction toward achieving the initial aim of neutralizing Iran’s nuclear ambitions while bombing its navy and air force is countered by limitations insofar as countering the drone threat to regional energy infrastructure and the Strait of Hormuz. Iran is seeking to pull off a 1990–91 repeat including its effects on US GDP, payrolls, and US politics.
CANADIAN CPI—BACKWARD READING TO BE FADED
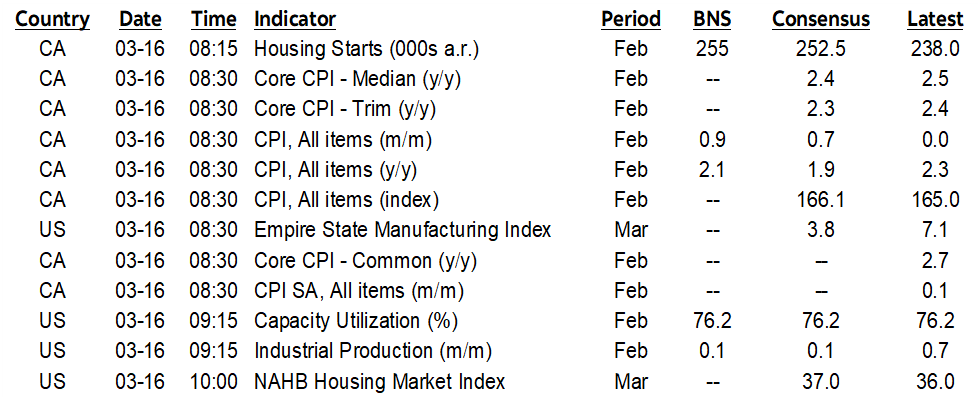
Canada refreshes CPI for the month of February this morning (8:30amET) as the last major reading before Wednesday’s Bank of Canada decision. The relevance of the release is likely to be pretty minimal given fresher inflation risks emanating from the war with Iran.
CPI is expected to be up 0.9% m/m seasonally unadjusted as per the polling convention (consensus 0.7%) with the year-over-year rate ebbing a touch to 2.1% (2.3% prior, 1.9% consensus). The year-over-year rate will be distorted lower by the mid-February 2025 expiration of the temporary GST tax cut.
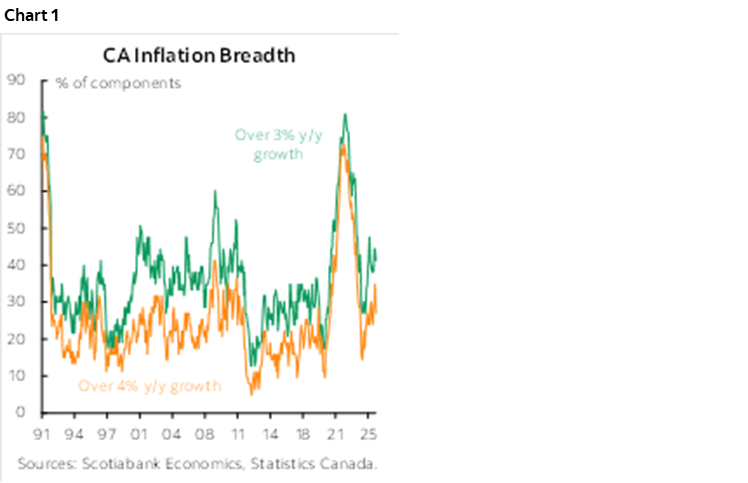
Two things are what really matter. One is what happens to the three main core inflation readings given a weakening trend over the past three months (chart 1). The BoC won’t overreact to this recent trend a) because we’ve seen multiple head fakes before reacceleration over the pandemic era, b) because some of that reflects the lagging effects of softening economic momentum that prompted easing in the first place with such easing still working through the 12–24 month lagging effects on the economy and inflation, and c) because of forward-looking risks.
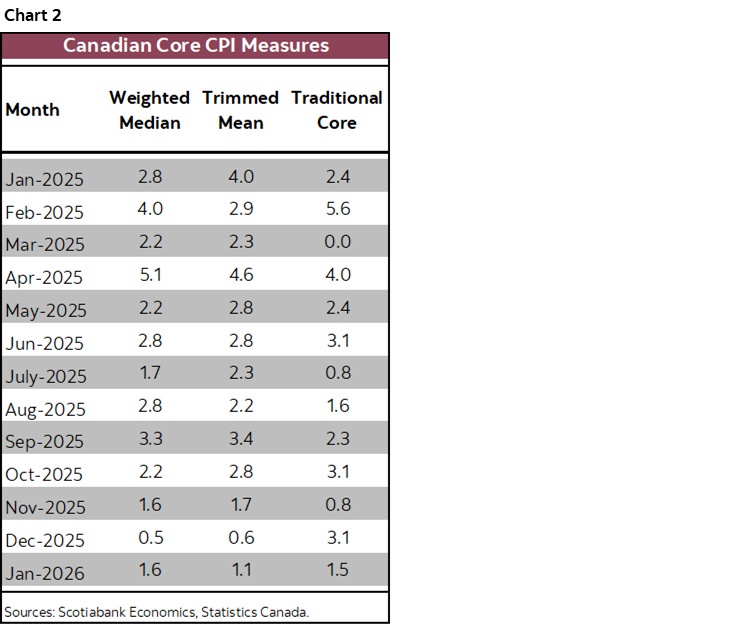
Secondly, watch breadth of inflationary pressures given the rising pattern for several months (chart 2).
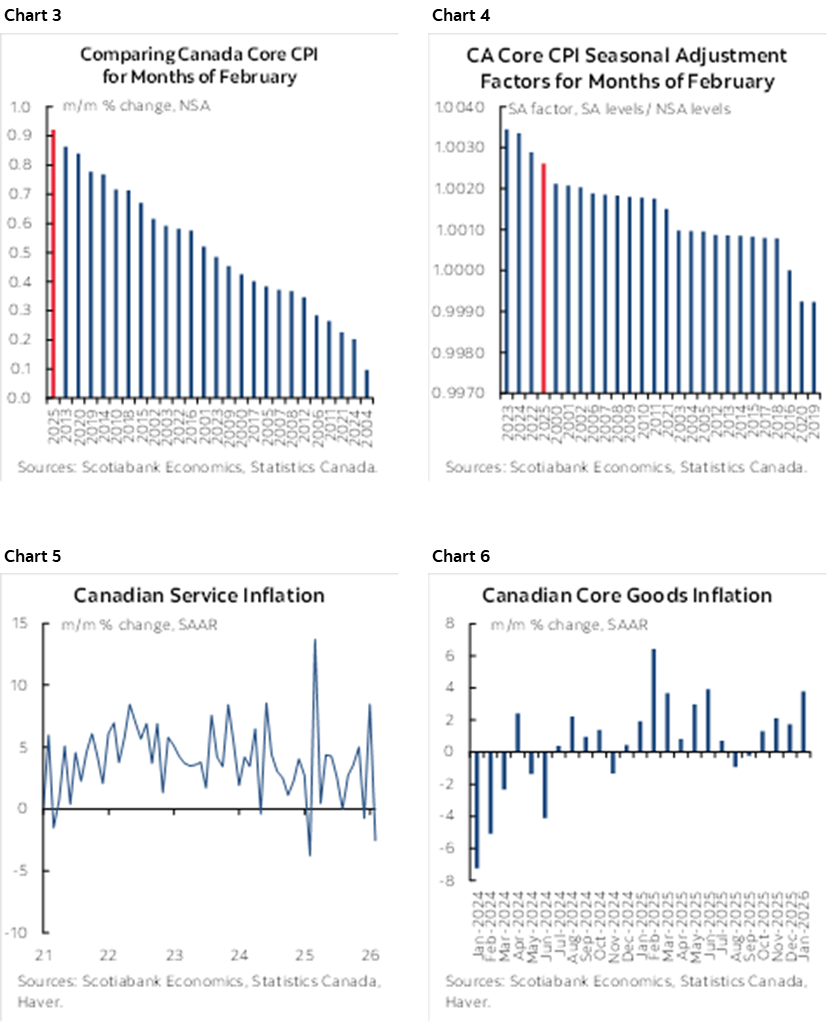
One driver is that February is normally a strong seasonal up-month for prices in Canada (chart 3). February’s seasonal adjustment factor has been moving higher in recent years which could also add to the seasonally adjusted reading (chart 4). Another driver is a mild expected contribution from higher gas prices that will become more significant in the next release. There could be a minor weighted lift from food prices as well. What could also be drivers are rebounds in shelter inflation and services ex-shelter given the prior month’s decline (chart 5) but somewhat offset by the lower weight on softer core goods inflation after the strongest reading since last Spring (chart 6).
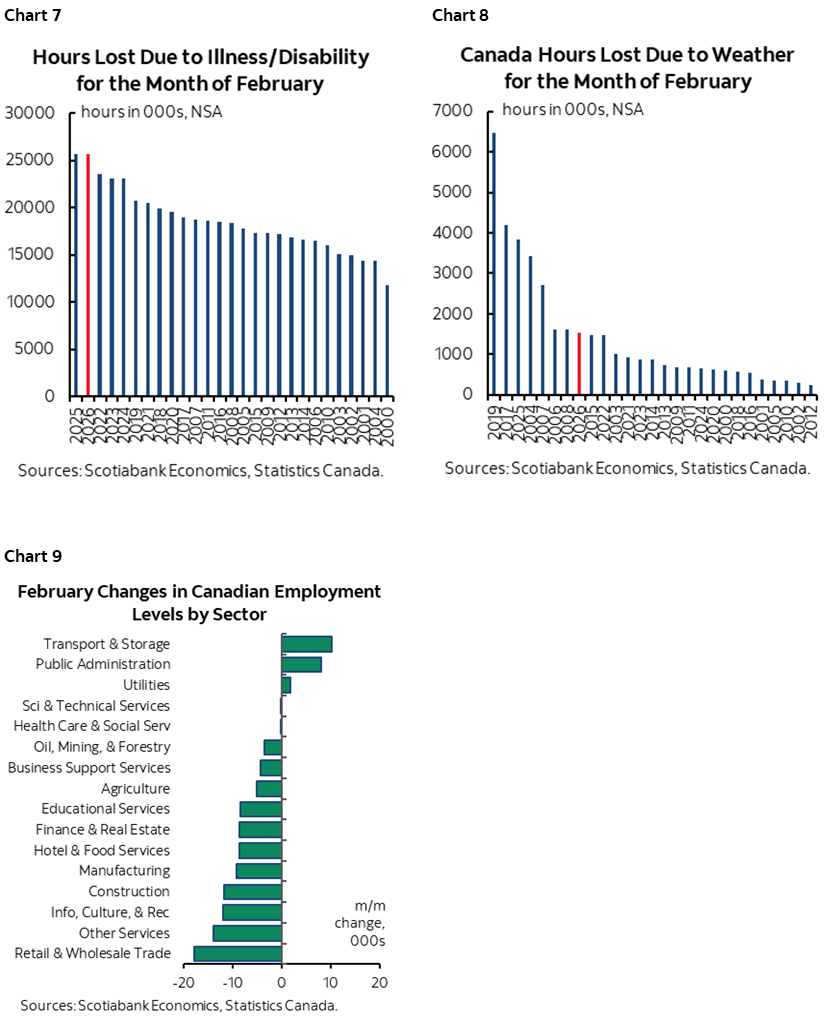
As for Friday’s 84k decline in employment during February, I wasn’t too surprised given I was in the tiny minority expecting a drop. It was bad on all details like full-time jobs and private payrolls, but with caveats. For one, sickness and weather hammered measures like hours worked (charts 7, 8) and hence may have impeded both the job search and hiring processes. This was a particularly bad winter and a bad flu season across Canada and the US. Those could be reasons for why sectors like retail/wholesale, construction, info/culture/rec leisure sectors, hotel and food services, and other services categories were among the worst performers (chart 9). The seasonal adjustment factor remains biased to the low end of SA factors for like months of February in history which shaved jobs. There was light regional breadth to the decline as it was mostly driven by Quebec.
And as for other data like GDP, recall arguments given here as to why the BoC won’t get fussed by Q4 and early Q1 GDP. Inventories were the main culprit holding back Q4 GDP as final domestic demand was strong including a modest rebound in consumer spending.
In any event, forward-looking risks will dominate the BoC’s stance on Wednesday including uncertainty over the outlook for the US economy, the positive oil shock, and trade policy risks. The latter two are intertwined; I’ve long leaned toward a more optimistic stance on trade negotiations with a solid chance of a workable deal, and I don’t think the Trump administration would wish to have both a harsh outcome for CUSMA and an oil shock on US consumers into midterms when Trump and the GOP are already polling poorly.
RBA—STRONG CHANCE OF BACK-TO-BACK HIKES
Australia’s central bank delivers another rate decisions tonight (11:30pmET). Markets are two-thirds prices for a quarter point hike. Twenty-four out of thirty-three forecasters expect a hike with the rest on hold.
Governor Bullock shook things up when she previously stated “I’m not making a prediction about March, but it will be a live meeting” meaning there would be consideration given to delivering a back-to-back hike. She went on to note “We have inflation at 3.8% headline, and we have unemployment at 4.1. The board will be actively looking at whether or not it needs to move more quickly. So I would discourage people from thinking that we necessarily only meet every quarter.”
Since she said that, Australia’s economy posted solid 0.8% q/q SA nonannualized growth in 2025Q4 with an upward revision to Q3 (0.5% instead of 0.4%) alongside other mixed readings like a mild rebound in household spending and a reversal of December’s export surge in January’s data. Regardless, the job markets has been strong and inflation continues to run well above the RBA’s 2–3% headline target range.
DATA RELEASES—CHINA, US
China’s retail and industrial sectors continue to perform well as February readings posted solid growth. Retail sales were up by 0.8% m/m SA for the second straight strong month (chart 10). Industrial output was also up by 0.8% m/m SA for the strongest growth since April 2024 that extends a long string of gains since that time (chart 11). Investment in fixed assets was up 1.8% ytd/ytd (consensus -5.1%).
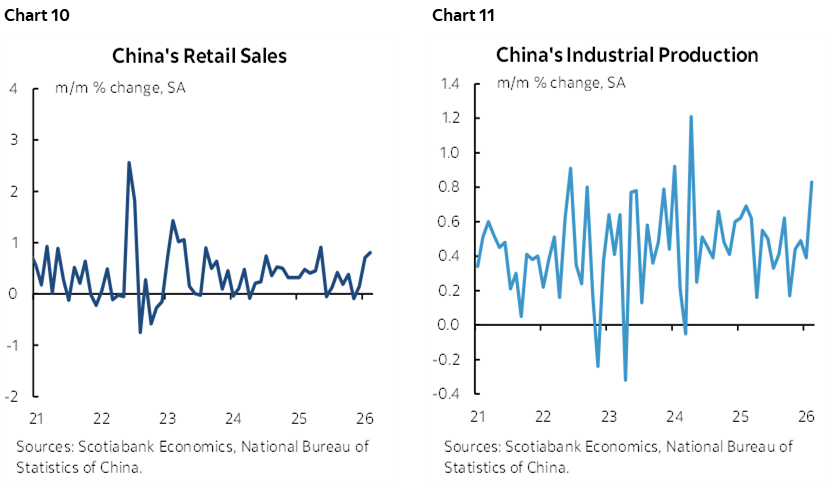
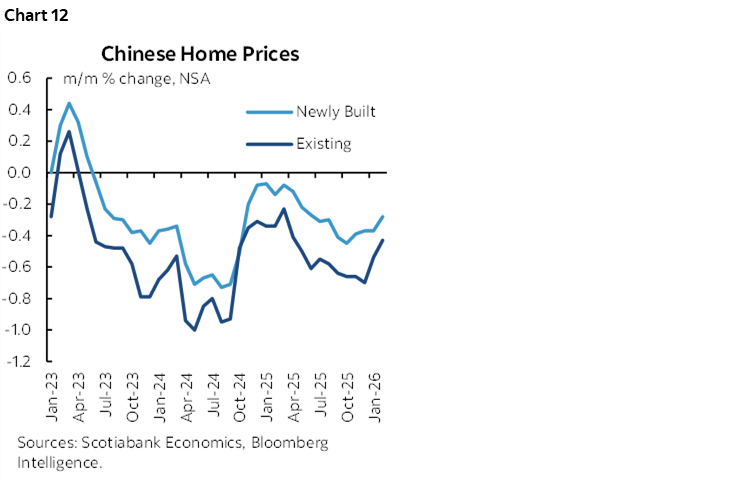
The one big blight remains the property market. Property investment fell by less than expected (-11.1%, -19% consensus). Home prices continue to decline with new home prices down -0.3% m/m for the 33rd consecutive monthly decline, while resale prices fell -0.4% m/m which extends the declines since 2021 with only a brief interruption in 3 (chart 12).
The US will update some figures on the industrial sector and housing market today. Industrial output may post moderate growth in February’s reading but strip out utilities given harsh weather and focus on manufacturing (9:15amET). The NY Fed’s Empire manufacturing gauge for March kicks off the monthly round of regional surveys on the path to the next ISM-manufacturing print (8:30amET). NAHB homebuilder confidence during March will include metrics like model home foot traffic that used to be more effective in estimating new home sales before investors took over (10amET).
DISCLAIMER
This report has been prepared by Scotiabank Economics as a resource for the clients of Scotiabank. Opinions, estimates and projections contained herein are our own as of the date hereof and are subject to change without notice. The information and opinions contained herein have been compiled or arrived at from sources believed reliable but no representation or warranty, express or implied, is made as to their accuracy or completeness. Neither Scotiabank nor any of its officers, directors, partners, employees or affiliates accepts any liability whatsoever for any direct or consequential loss arising from any use of this report or its contents.
These reports are provided to you for informational purposes only. This report is not, and is not constructed as, an offer to sell or solicitation of any offer to buy any financial instrument, nor shall this report be construed as an opinion as to whether you should enter into any swap or trading strategy involving a swap or any other transaction. The information contained in this report is not intended to be, and does not constitute, a recommendation of a swap or trading strategy involving a swap within the meaning of U.S. Commodity Futures Trading Commission Regulation 23.434 and Appendix A thereto. This material is not intended to be individually tailored to your needs or characteristics and should not be viewed as a “call to action” or suggestion that you enter into a swap or trading strategy involving a swap or any other transaction. Scotiabank may engage in transactions in a manner inconsistent with the views discussed this report and may have positions, or be in the process of acquiring or disposing of positions, referred to in this report.
Scotiabank, its affiliates and any of their respective officers, directors and employees may from time to time take positions in currencies, act as managers, co-managers or underwriters of a public offering or act as principals or agents, deal in, own or act as market makers or advisors, brokers or commercial and/or investment bankers in relation to securities or related derivatives. As a result of these actions, Scotiabank may receive remuneration. All Scotiabank products and services are subject to the terms of applicable agreements and local regulations. Officers, directors and employees of Scotiabank and its affiliates may serve as directors of corporations.
Any securities discussed in this report may not be suitable for all investors. Scotiabank recommends that investors independently evaluate any issuer and security discussed in this report, and consult with any advisors they deem necessary prior to making any investment.
This report and all information, opinions and conclusions contained in it are protected by copyright. This information may not be reproduced without the prior express written consent of Scotiabank.
™ Trademark of The Bank of Nova Scotia. Used under license, where applicable.
Scotiabank, together with “Global Banking and Markets”, is a marketing name for the global corporate and investment banking and capital markets businesses of The Bank of Nova Scotia and certain of its affiliates in the countries where they operate, including; Scotiabank Europe plc; Scotiabank (Ireland) Designated Activity Company; Scotiabank Inverlat S.A., Institución de Banca Múltiple, Grupo Financiero Scotiabank Inverlat, Scotia Inverlat Casa de Bolsa, S.A. de C.V., Grupo Financiero Scotiabank Inverlat, Scotia Inverlat Derivados S.A. de C.V. – all members of the Scotiabank group and authorized users of the Scotiabank mark. The Bank of Nova Scotia is incorporated in Canada with limited liability and is authorised and regulated by the Office of the Superintendent of Financial Institutions Canada. The Bank of Nova Scotia is authorized by the UK Prudential Regulation Authority and is subject to regulation by the UK Financial Conduct Authority and limited regulation by the UK Prudential Regulation Authority. Details about the extent of The Bank of Nova Scotia's regulation by the UK Prudential Regulation Authority are available from us on request. Scotiabank Europe plc is authorized by the UK Prudential Regulation Authority and regulated by the UK Financial Conduct Authority and the UK Prudential Regulation Authority.
Scotiabank Inverlat, S.A., Scotia Inverlat Casa de Bolsa, S.A. de C.V, Grupo Financiero Scotiabank Inverlat, and Scotia Inverlat Derivados, S.A. de C.V., are each authorized and regulated by the Mexican financial authorities.
Not all products and services are offered in all jurisdictions. Services described are available in jurisdictions where permitted by law.