

ON DECK FOR FRIDAY, AUGUST 7th
KEY POINTS:
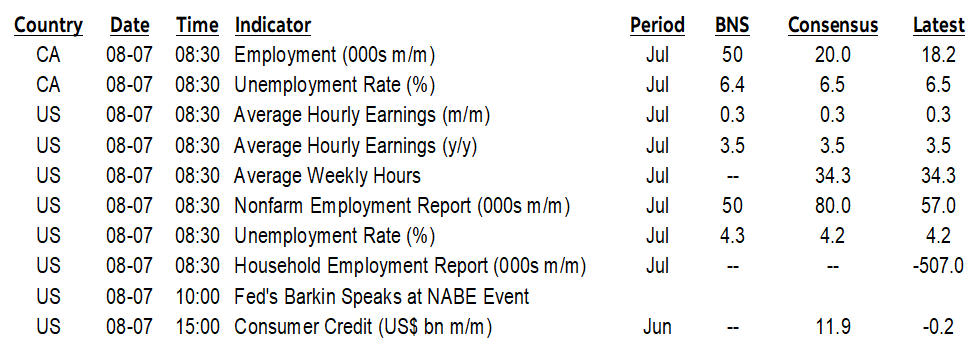
- Markets await jobs reports
- Canadian jobs: upside, lower UR, cooler wages
- US nonfarm: mild, higher UR, steady wages
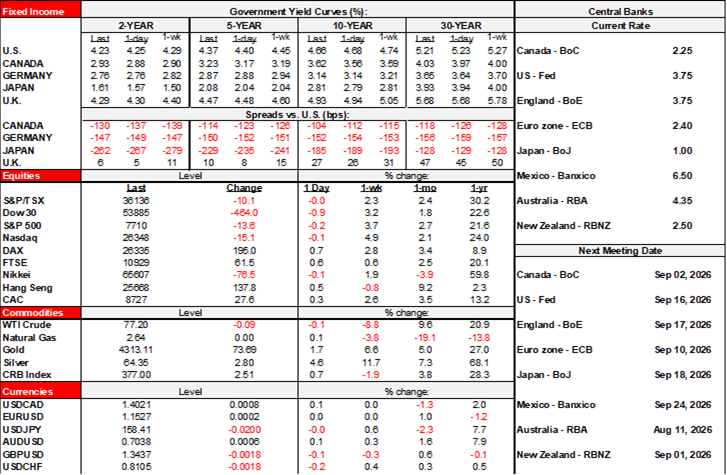
Iran and jobs may compete for attention in driving how markets end the week. Oil prices are slipping a touch this morning after yesterday’s gain that was driven by Iranian attacks on ships in the Strait of Hormuz and reports that Iran and Oman struck a deal that won’t allow US and Israeli ships to transit the Strait in future; meh, fly a different flag, or switch ships in transit. Treasury yields are a touch lower this morning ahead of nonfarm on some combination of lower oil and nonfarm expectations and with US equity futures moving gently higher alongside little change in the dollar including flatness to CAD. That could all change in one direction or the other after 8:30amET.
So bring it on. I offered my previews for US and Canadian jobs in Wednesday’s morning note here in lieu of a weekly.
Scotia’s house calls are for gains of 50k jobs in both the US and Canada with the usual uncertainty around volatile reports full of methodological quirks.
I won’t repeat the rationale behind the drivers of the calls in this note as we’re at the point of just seeing the numbers and doing the clean up.
CANADIAN JOBS — COULD MOMENTUM CONTINUE?
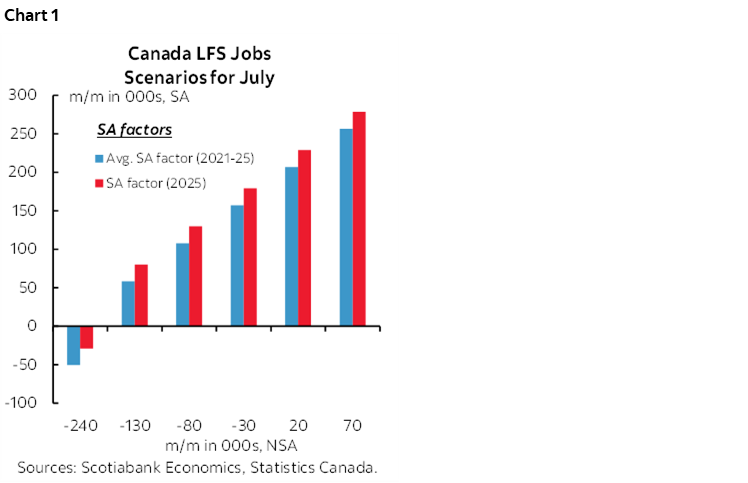
Briefly, the range of estimates in consensus for Canada’s jobs report is from 0k to 50k. There is no clear clustering of estimates within that range and there are no negatives. The median estimate is 20k and the mean is close to that at 17.6k with a standard deviation of 12.4k. The 95% confidence interval surrounding monthly changes in jobs is a whopping +/-57k which is wider than the whole range of estimates. Chart 1 shows that barring statistical quirks, there is more upside than downside to the report by applying expectations for seasonal adjustment factors driven by recent experience for months of July against a range of seasonally unadjusted changes in jobs drawn from a wide range of outcomes in past months of July.
As for the unemployment rate, most expect it to be unchanged at 6.5%. My estimate is 6.4% because labour supply has ground to a halt with a shrinking population as immigration policy tightens and the Labour Force Survey’s application of a twelve-month rolling average to the temp category of arrivals catches up to actual population trends.
Wage growth is likely to cool after a whopping 9% m/m SAAR gain in June.
Hours worked will inform GDP growth in July on the heels of a mild 0.9% q/q SAAR gain in Q2 which means that most of our tracking for a strong GDP rebound was likely due to a productivity surge.
US PAYROLLS — MILD WITH DOWNSIDE
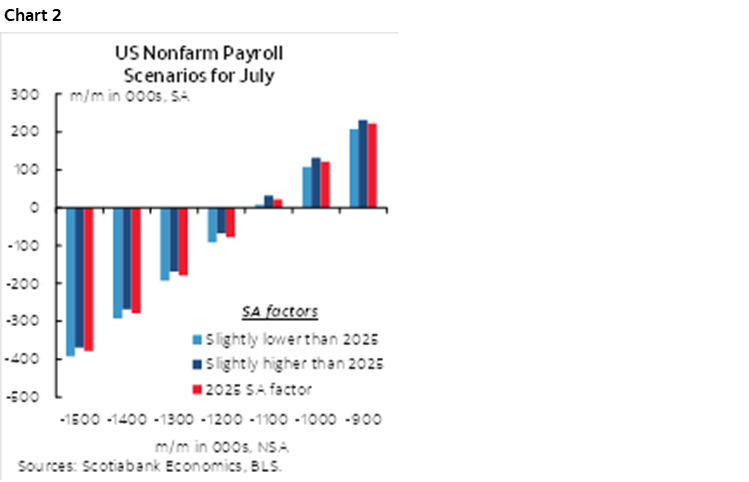
Also briefly, the range of estimates for nonfarm payrolls cuts from a gain of 40k to a gain of 157k. Most estimates are clustered within about 60k to 115k. The whisper number on Bloomberg is 76k. I see greater risk of coming in weaker than my 50k rather than stronger. Chart 2 shows this by applying scenarios around recent seasonal adjustment factors for like months of July against a wide range of outcomes for seasonally unadjusted changes in jobs drawn from the wide range of experiences in past months of July. The median estimate is a gain of 80k with a mean of 88k, implying mild skewness. The standard deviation is 22.7k and the 90% confidence interval from the BLS is +/-122k.
As for the unemployment rate, consensus is roughly divided between 4.2% (unchanged) and 4.3% which is Scotia’s house call. Also keep an eye on wages that are expected to grow by 0.3% m/m SA.
Also be mindful toward revision risk to the prior month’s 57k rise and the gain of 129k in May; June’s initial nonfarm sample was unusually small and the pattern of late has been more toward negative revisions than positive ones. Sharp revision risk to June could be a big influence on the July estimate by affecting the jumping off point.
Hours worked will start tracking of Q3 growth after a mild 1.3% q/q SAAR increase in Q2. Hours have not grown by faster than this amount in over three years.
DISCLAIMER
This report has been prepared by Scotiabank Economics as a resource for the clients of Scotiabank. Opinions, estimates and projections contained herein are our own as of the date hereof and are subject to change without notice. The information and opinions contained herein have been compiled or arrived at from sources believed reliable but no representation or warranty, express or implied, is made as to their accuracy or completeness. Neither Scotiabank nor any of its officers, directors, partners, employees or affiliates accepts any liability whatsoever for any direct or consequential loss arising from any use of this report or its contents.
These reports are provided to you for informational purposes only. This report is not, and is not constructed as, an offer to sell or solicitation of any offer to buy any financial instrument, nor shall this report be construed as an opinion as to whether you should enter into any swap or trading strategy involving a swap or any other transaction. The information contained in this report is not intended to be, and does not constitute, a recommendation of a swap or trading strategy involving a swap within the meaning of U.S. Commodity Futures Trading Commission Regulation 23.434 and Appendix A thereto. This material is not intended to be individually tailored to your needs or characteristics and should not be viewed as a “call to action” or suggestion that you enter into a swap or trading strategy involving a swap or any other transaction. Scotiabank may engage in transactions in a manner inconsistent with the views discussed this report and may have positions, or be in the process of acquiring or disposing of positions, referred to in this report.
Scotiabank, its affiliates and any of their respective officers, directors and employees may from time to time take positions in currencies, act as managers, co-managers or underwriters of a public offering or act as principals or agents, deal in, own or act as market makers or advisors, brokers or commercial and/or investment bankers in relation to securities or related derivatives. As a result of these actions, Scotiabank may receive remuneration. All Scotiabank products and services are subject to the terms of applicable agreements and local regulations. Officers, directors and employees of Scotiabank and its affiliates may serve as directors of corporations.
Any securities discussed in this report may not be suitable for all investors. Scotiabank recommends that investors independently evaluate any issuer and security discussed in this report, and consult with any advisors they deem necessary prior to making any investment.
This report and all information, opinions and conclusions contained in it are protected by copyright. This information may not be reproduced without the prior express written consent of Scotiabank.
™ Trademark of The Bank of Nova Scotia. Used under license, where applicable.
Scotiabank, together with “Global Banking and Markets”, is a marketing name for the global corporate and investment banking and capital markets businesses of The Bank of Nova Scotia and certain of its affiliates in the countries where they operate, including; Scotiabank Europe plc; Scotiabank (Ireland) Designated Activity Company; Scotiabank Inverlat S.A., Institución de Banca Múltiple, Grupo Financiero Scotiabank Inverlat, Scotia Inverlat Casa de Bolsa, S.A. de C.V., Grupo Financiero Scotiabank Inverlat, Scotia Inverlat Derivados S.A. de C.V. – all members of the Scotiabank group and authorized users of the Scotiabank mark. The Bank of Nova Scotia is incorporated in Canada with limited liability and is authorised and regulated by the Office of the Superintendent of Financial Institutions Canada. The Bank of Nova Scotia is authorized by the UK Prudential Regulation Authority and is subject to regulation by the UK Financial Conduct Authority and limited regulation by the UK Prudential Regulation Authority. Details about the extent of The Bank of Nova Scotia's regulation by the UK Prudential Regulation Authority are available from us on request. Scotiabank Europe plc is authorized by the UK Prudential Regulation Authority and regulated by the UK Financial Conduct Authority and the UK Prudential Regulation Authority.
Scotiabank Inverlat, S.A., Scotia Inverlat Casa de Bolsa, S.A. de C.V, Grupo Financiero Scotiabank Inverlat, and Scotia Inverlat Derivados, S.A. de C.V., are each authorized and regulated by the Mexican financial authorities.
Not all products and services are offered in all jurisdictions. Services described are available in jurisdictions where permitted by law.