

ON DECK FOR WEDNESDAY, AUGUST 5th

KEY POINTS:
- Are markets are being reeled in by the same false dawn
- Canadian and US jobs previews — 50–50!
- ADP private payrolls disappointed and remain unreliable
- US ISM-services, Fed-speak on tap
- NZ’s higher unemployment rate drives bond rally, weaker NZ$
- China’s private PMIs cratered
- RBI holds
- BCB expected to cut
- Real wage growth will bolster BoJ hiking bias
- Turmoil at BI got a helping hand from a small GDP beat
- Canadian auto sales rise to a five-month high
Is it peace, just another false dawn, or merely more market manipulation by the White House? You pick or go with a combo. Yesterday’s plunge in oil prices bought the well orchestrated headlines and media messaging from administration officials about a plan to reopen the Strait of Hormuz and did so hook, line and sinker. As if markets never heard such false promises before. They can’t even be imaginative in offering up the same 60-day reopening that we’ve heard before and that has collapsed multiple times. Markets are a touch more cautious this morning with a small gain in oil prices. I’m still of the view that Iran has no interest in peace in a managed irresolution sense, while the US still has sketchy goals and no real strategy or clear way out of a bungled military adventure with Trump’s erratic ways feeling the way toward midterms amid collapsing support in the polls. Nevertheless, the prospect of an agreement is driving some of the cautious optimism in markets.
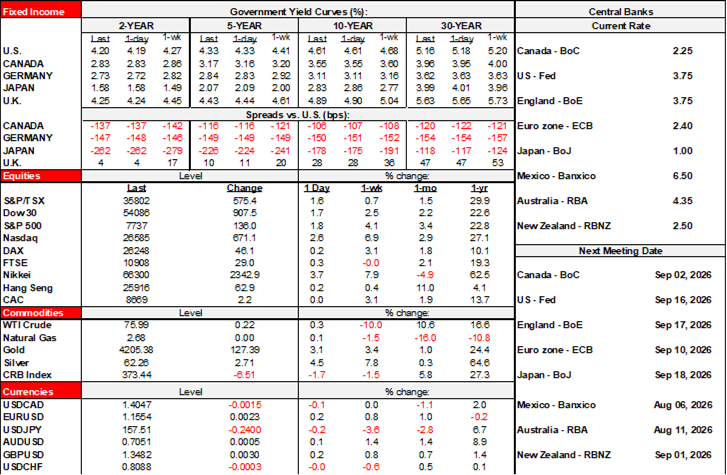
Global sovereign bond markets are mostly treading water. Stocks are somewhat mixed with S&P futures up by ½% alongside a smaller gain in Nasdaq futures while European cash markets are averaging small gains. Asia-Pacific exchanges moved higher overnight in lagging fashion to yesterday’s gains by US stocks. Currencies are mostly gaining to the USD with the lone exception among the majors being the NZ$ (see below).
What follows are previews for a pair of 50k gains in N.A. jobs before getting into other developments.
NONFARM PREVIEW
My estimate for Friday’s nonfarm payrolls report is a mild gain of 50k and an uptick in the unemployment rate to 4.3%. Consensus is divided between an unchanged UR and an uptick. The consensus range for payrolls runs from +40k to +157k. I’m surprised there are no negatives in the sample.
Why go relatively low? First, the disclaimer. Nonfarm is a wonky report with its own methodological quirks like birth-death model adjustments, sampling issues, questionable seasonal adjustments etc. Nonfarm’s 90% confidence band around estimated monthly changes is a massive +/- 122,000. Markets pay too much attention to modest misses relative to various estimates within such noise bands and given what is usually high revision risk.
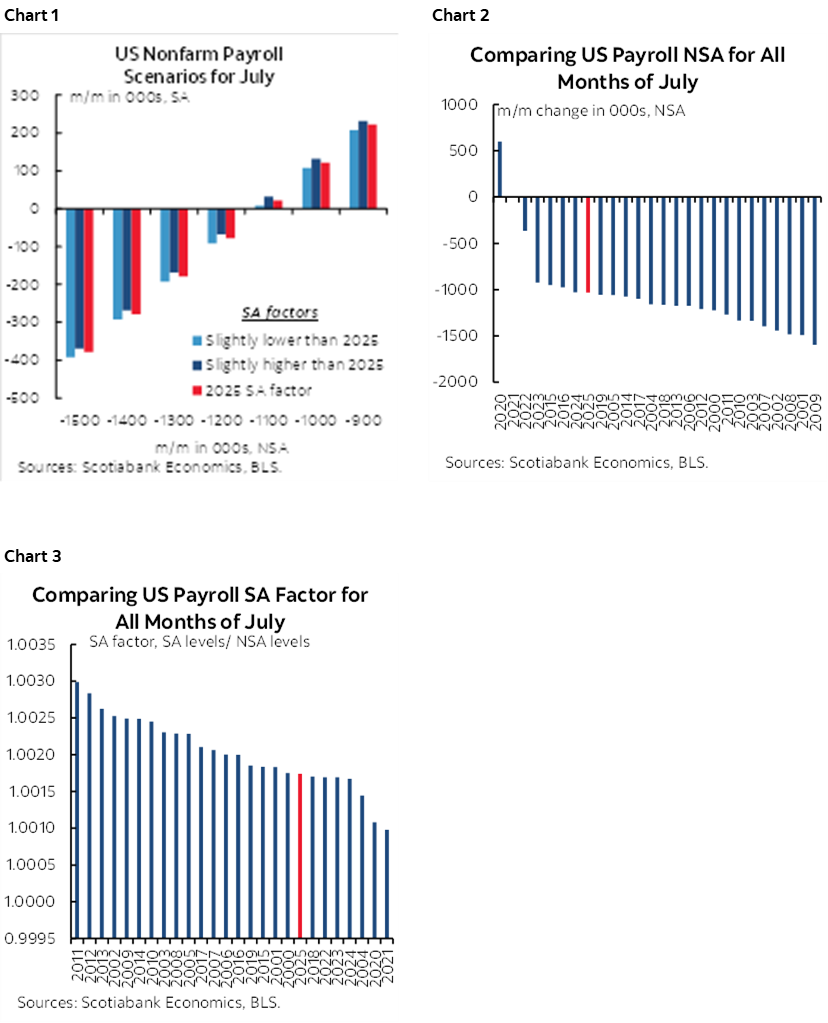
So why 50k? Chart 1 shows reasonable scenarios using different seasonal adjustment factors and different seasonally unadjusted changes in employment. July is normally a down-month for the seasonally unadjusted change in payrolls (chart 2) and the seasonal adjusted factor compensates for this by being higher than 1.0 (chart 3). A matrix of 48 scenario outcomes under different NSA changes and SA factors generates gains 40% of the time and declines 60% of the time. If the SA factor is similar to last year and the NSA change is also similar or worse, then the most common outcome is a drop in SA payrolls with less common scenarios around modest gains.
There is more to the call in terms of other arguments. Here is a breakdown of some of the arguments for a weak versus stronger report.
Weaker:
- Consumers signalled little availability of jobs in July. The consumer confidence jobs plentiful reading fell to 24.6 from 25.5 which is the lowest reading since early 2021.
- JOLTS job vacancies fell in June which is what drove yesterday’s rally in Treasuries. The declines over the past couple of months reverse some of the prior momentum.
- ADP disappointed at +44k in July but is a poor guide to nonfarm payrolls.
- The ESSER cliff effect: education sector jobs will likely fall over coming months including the possibility we begin to see the effects as soon as this month. This is the first year in which nationwide districts will have to deal with expiring Elementary and Secondary School Emergency Relief (ESSER III) that had provided US$122 billion to K-12 schools. Reports of widespread layoffs in the education sector across many states indicate reduced jobs which could show up as soon as now after the end of the school year, or in reduced higher in August and September on the path to a new school year.
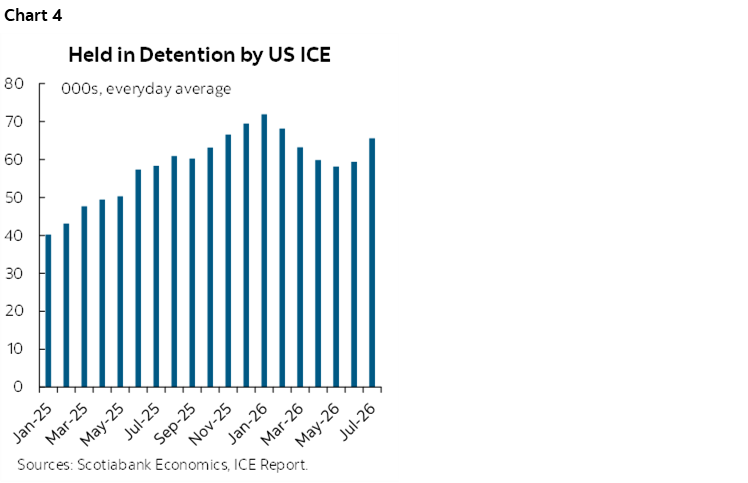
- immigration policy remains a restraint on hiring. ICE detentions picking up and are driving more workers away from the labour force (chart 4). June hit the highest for a single month in 7 years. Absent official statistics, groups that attempt to track the figures point to ICE arresting more people in July than any other single month during Trump 2.0. The direct effect on labour force reductions combined with the indirect effect of driving people into hiding is a restraint on jobs.
- momentum: the prior month showed poor breadth with the only notable upside drivers of nonfarm payrolls being education/health +69k of which health was 47k, and temp help accounting for about one-third of the 36k gain in prof/business services.
- On a sector basis, I’ve gone with steady hiring in the health sector around +50k, a modest rebound in the leisure and hospitality sector that plunged -60k in June, and a more modest gain in professional and business services this month than in June. Little change is expected in most other categories.
Stronger:
- weather was a mild drag in June and big drag in May according to San Fran Fed’s estimates. Rebound in July??
- S&P PMIs returned to marginal hiring in July after two months of declines that did not align with nonfarm but they don’t track payrolls well.
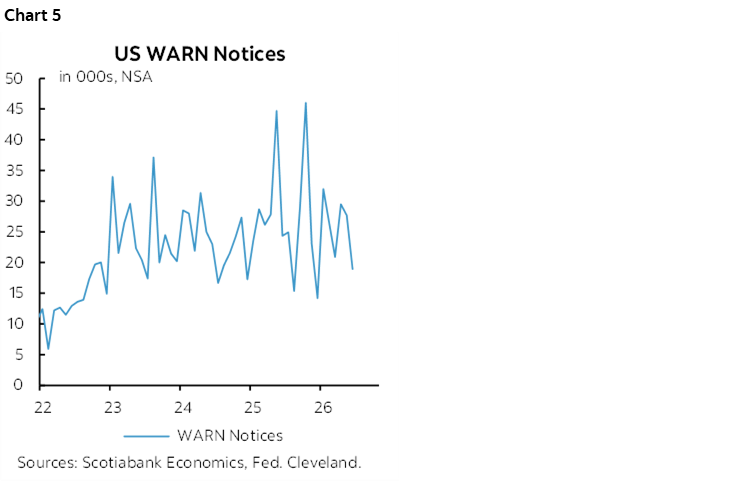
- tech layoffs in July fell over June. Recent tech layoffs have been mostly attributed to AI. Layoff guidance is not particularly impactful according to WARN (chart 5).
- continuing claims fell between reference periods
Uncertain:
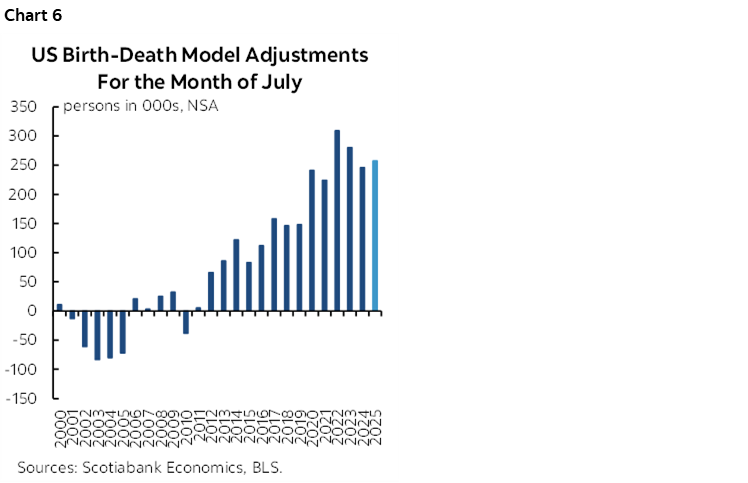
- The birth-death model was likely stable around a +250k m/m NSA addition which barring a surprise probably wouldn’t swing the estimate (chart 6).
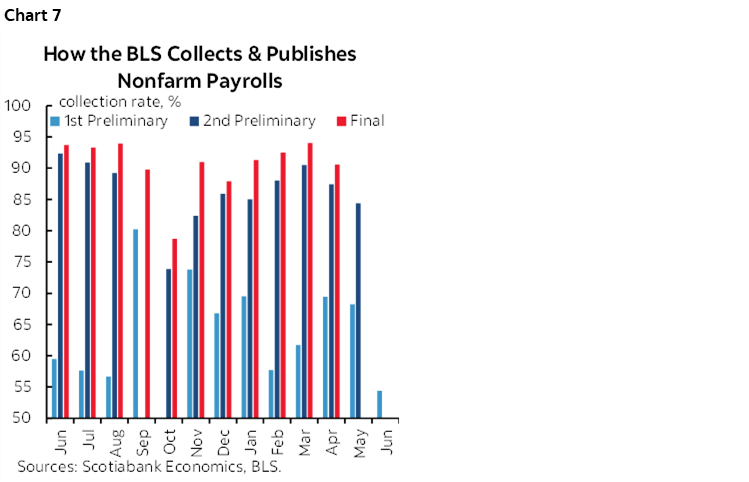
- the recent pattern points to large negative revisions. They could be particularly large this time given June’s low survey sampling rate (chart 7).
- Government hiring is likely to be a small effect.
- We’re also missing a few other readings that we’ll get today and tomorrow including ISM-services-employment, Challenger layoffs, and maybe Revelio’s nonfarm proxy. ISM and Revelio have poor track records as a guide to payrolls.
CANADIAN JOBS PREVIEW
I went high relative to consensus on expectations for Friday’s Labour Force Survey for the month of July. My estimate is a gain of 50k jobs and a downtick of the unemployment rate to 6.4%. Consensus sits at a gain of 20k with other shops’ estimates ranging from a donut to +25k.
Why go high? First the usual disclaimer: it’s a volatile household survey with a modest sample and a high degree of statistical noise. The 95% confidence band around monthly estimates of the change in jobs is +/-57k. Canadian consensus is usually a combination of boring risk avoiders but we are talking about a volatile survey with high scope for surprises.
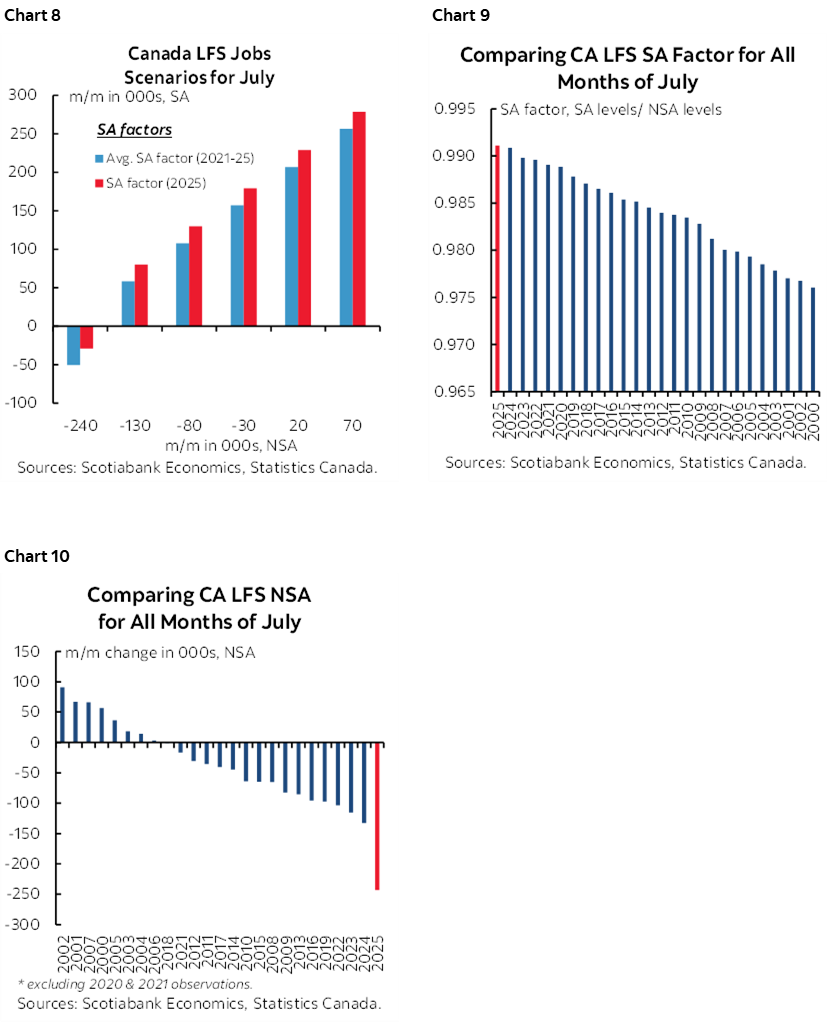
So why go high? It’s a bit of a technical argument. Chart 8 shows the range of possible outcomes for the change in employment during July using reasonable scenarios for the seasonal adjustment factor and the seasonally unadjusted change in employment. July is often a down month for seasonally unadjusted jobs (chart 9) but the seasonal adjustment factor has been floating around the highest on record over recent months of July when comparing like months over time (chart 10). In a matrix of 40 possible outcomes under different scenarios for the seasonally unadjusted change in jobs and the SA factor, jobs fall in only nine of them, rise in the remaining three-quarters of estimates, and often by a lot. In fact, many of the scenarios generate far higher gains in employment than my estimate. Even if this July’s seasonally unadjusted change is a large -200k which would be similar to last year’s, and the SA factor is the same as last July’s, seasonally adjusted jobs would rise by 30k. Any combination of a continued upward drift in the SA factor that is derived with a strong recency bias and a smaller seasonally unadjusted drop could generate an explosive gain.
As for more fundamental drivers, the economy was ripping in Q2 and has considerable momentum into Q3. An Okun’s ‘law’ approach that correlates GDP and employment growth would suggest continued gains in employment. There is also a persistent bias in the sampling methods of the LFS because of the rotating panel of households that are polled which use a six-month rolling sample that only deletes the first month to add the latest one each time. It’s unlikely that we’ll see any material World Cup effect but it could be a small negative given that the last game played in Canada was on July 7th and hence just before the reference week for the report. That might restrain the prior month’s gain in categories reflecting activity at hotels and leisure related spending, but much of that was probably driven by a burst of pent-up activity following weather and sickness constraints over much of the earlier parts of the year.
NZ$ AND KIWI YIELDS DIP ON HIGHER UR
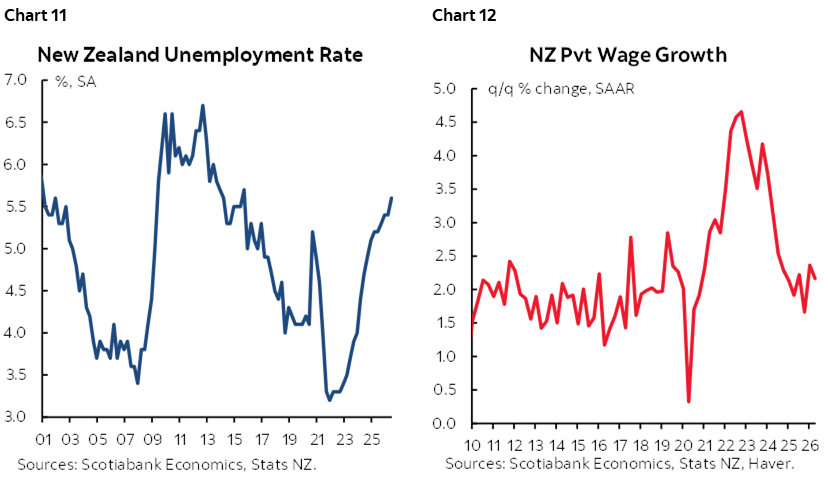
A jump in New Zealand’s unemployment rate during Q2 (chart 11) drove the NZ$ to be the weakest performing currency pair to the USD and pushed short-term kiwi bond yields down by about 9bps. It wasn’t all bad mind you, as jobs grew by 0.5% q/q—five times consensus. The higher labour force participation rate (70.7%, 70.4% prior) reflected greater entry into the job market. Further, wages ex-overtime were up by 0.7% q/q seasonally unadjusted which is the fastest in two years but when seasonally adjusted is running around a long-run average (chart 12). Frankly, I think markets overreacted to the UR and went too far ignoring the rest. Still, meeting pricing still positions expectations for a 25bps hike at the RBNZ’s September 2nd meeting followed by another by year-end on inflation concerns.
REAL WAGES SUPPORT BOJ TIGHTENING
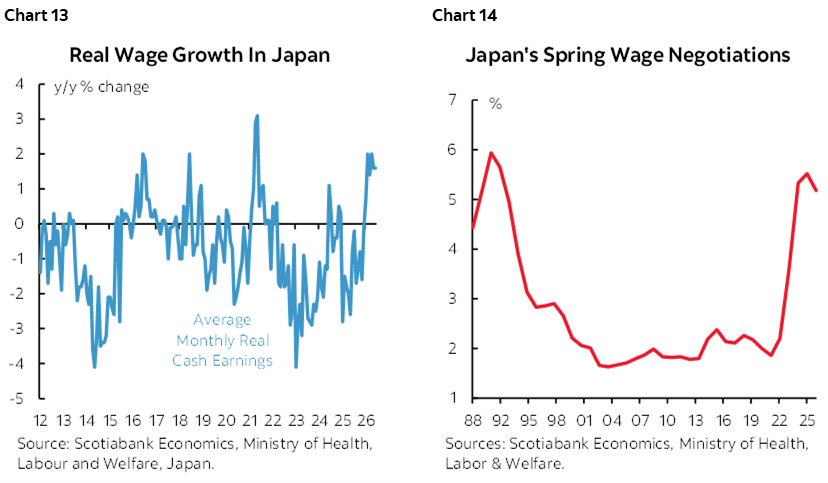
BoJ Governor Ueda got a bit of a helping hand from the latest readings on real wages, although the yen couldn’t have cared less. Inflation-adjusted wage growth continued to creep higher in June (1.6% y/y) with positive revisions. Real wage growth has been trending around the quickest pace since 2021 and excluding the pandemic’s wild distortions it is around the top end of the range set dating back about thirty years (chart 13). Union wage growth during annual Shunto negotiations has been hot for several years and directly affects just under one-fifth of workers (chart 14). Markets have almost two-thirds of a 25bps hike priced by the September 18th meeting and a full hike priced by October 30th.
CHINA’S PRIVATE PMIS TANKED
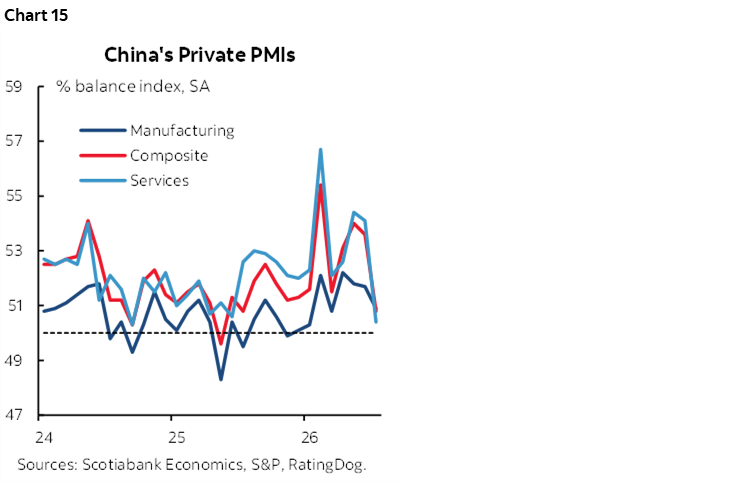
China’s private purchasing managers’ indices for July cratered. The composite PMI fell by almost three full points to 50.8. We already knew about the small drop in the manufacturing PMI from two days ago (50.9, 51.7 prior) but the services PMI that was updated overnight fell by 3.7 points to 50.4 (chart 15). Overall, these readings that are skewed toward smaller, non-SOE firms signalled a sudden deceleration of growth in China’s economy.
GDP BEAT SUPPORTED THE RUPIAH TO BI’S DELIGHT
Bank Indonesia got some long-awaited help defending against currency weakness this time in the form of better performance by the economy. GDP grew by 3.7% q/q SAAR (3.6% consensus) after contracting in Q1 and largely stalling out in Q4. The small beat was enough to drive the rupiah to a gain in the overnight session. Recall that among the reasons for tighter monetary policy over recent meetings has been currency weakening and associated financial stability considerations. The bigger challenge may be addressing market concerns about political independence of the central bank after Governor Perry Warjiyo’s surprise resignation under pressure from President Subianto.
RBI HOLDS AS PRICE PRESSURES MOUNT
India’s central bank held its repurchase rate unchanged at 5.25% as widely expected. The unanimous vote by the bank’s policy committee was accompanied by a neutral stance signalling little appetite to alter policy directions in the nearer term. With inflation on the rise at 4.4% y/y from nothing late last year, any further increases alongside rising breadth of price pressures could that continues to push inflation toward the top end of the 2–6% target range would likely trigger policy tightening by year-end.
BRAZIL’S CENTRAL BANK EXPECTED TO CUT
We’ll also hear from Brazil’s central bank later today (5:30pmET). Consensus unanimously expects a 25bps cut in the Selic rate to 14%. BCB has been easing since March at a 25bps per meeting pace. Statement guidance on future moves is likely to be similar to the mess offered up in the previous June statement.
US ISM-SERVICES, ADP AND FED-SPEAK
On tap into the N.A. session is a blend of US data and Fed-speak. ADP’s private payrolls reading for July disappointed by coming in at +44k relative to expectations for a reading around 65k which was based on the four-week moving average of their weekly measure at a monthly pace. ADP often sneaks in large revisions to the implied weekly path when they issue the monthly update and it’s possible ADP tanked in the reference period. It also matters little because ADP remains a poor guide to Friday’s private nonfarm payrolls report.
US ISM-services for July (10amET) holds out greater potential for sparking market gyrations as they pass the time waiting for nonfarm. A small rise is expected alongside still rapid price pressures and solid growth in new orders but the employment subindex is usually a poor guide to nonfarm payrolls.
Fed officials continue to weigh in with views on the economy and monetary policy. Philly Fed President Paulson sounded highly circumspect yesterday when saying she has an open mind on policy directions and views current policy as mildly restrictive. KC Fed President Schmid weighed in last evening by advocating tighter policy and saying policy isn’t restrictive. We’ll hear from Governor Cook after the close (4:05pmET) and she has sounded relatively hawkish in recent remarks, and then San Fran’s Daly (8:35pmET).
CANADIAN AUTO SALES JUMPED
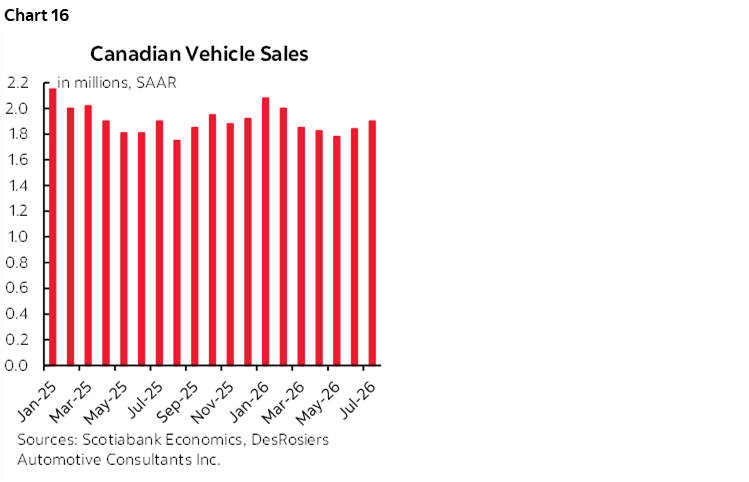
There is nothing on tap in Canada today but we learned late yesterday that auto sales jumped higher in July. Desrosier’s measure showed that sales hit the highest level since February (chart 16). First, this conforms with expectations that some pent-up demand would be released after a lousy winter and early Spring. Second, it’s a good indication of momentum at least for this part of consumer spending into Q3.
DISCLAIMER
This report has been prepared by Scotiabank Economics as a resource for the clients of Scotiabank. Opinions, estimates and projections contained herein are our own as of the date hereof and are subject to change without notice. The information and opinions contained herein have been compiled or arrived at from sources believed reliable but no representation or warranty, express or implied, is made as to their accuracy or completeness. Neither Scotiabank nor any of its officers, directors, partners, employees or affiliates accepts any liability whatsoever for any direct or consequential loss arising from any use of this report or its contents.
These reports are provided to you for informational purposes only. This report is not, and is not constructed as, an offer to sell or solicitation of any offer to buy any financial instrument, nor shall this report be construed as an opinion as to whether you should enter into any swap or trading strategy involving a swap or any other transaction. The information contained in this report is not intended to be, and does not constitute, a recommendation of a swap or trading strategy involving a swap within the meaning of U.S. Commodity Futures Trading Commission Regulation 23.434 and Appendix A thereto. This material is not intended to be individually tailored to your needs or characteristics and should not be viewed as a “call to action” or suggestion that you enter into a swap or trading strategy involving a swap or any other transaction. Scotiabank may engage in transactions in a manner inconsistent with the views discussed this report and may have positions, or be in the process of acquiring or disposing of positions, referred to in this report.
Scotiabank, its affiliates and any of their respective officers, directors and employees may from time to time take positions in currencies, act as managers, co-managers or underwriters of a public offering or act as principals or agents, deal in, own or act as market makers or advisors, brokers or commercial and/or investment bankers in relation to securities or related derivatives. As a result of these actions, Scotiabank may receive remuneration. All Scotiabank products and services are subject to the terms of applicable agreements and local regulations. Officers, directors and employees of Scotiabank and its affiliates may serve as directors of corporations.
Any securities discussed in this report may not be suitable for all investors. Scotiabank recommends that investors independently evaluate any issuer and security discussed in this report, and consult with any advisors they deem necessary prior to making any investment.
This report and all information, opinions and conclusions contained in it are protected by copyright. This information may not be reproduced without the prior express written consent of Scotiabank.
™ Trademark of The Bank of Nova Scotia. Used under license, where applicable.
Scotiabank, together with “Global Banking and Markets”, is a marketing name for the global corporate and investment banking and capital markets businesses of The Bank of Nova Scotia and certain of its affiliates in the countries where they operate, including; Scotiabank Europe plc; Scotiabank (Ireland) Designated Activity Company; Scotiabank Inverlat S.A., Institución de Banca Múltiple, Grupo Financiero Scotiabank Inverlat, Scotia Inverlat Casa de Bolsa, S.A. de C.V., Grupo Financiero Scotiabank Inverlat, Scotia Inverlat Derivados S.A. de C.V. – all members of the Scotiabank group and authorized users of the Scotiabank mark. The Bank of Nova Scotia is incorporated in Canada with limited liability and is authorised and regulated by the Office of the Superintendent of Financial Institutions Canada. The Bank of Nova Scotia is authorized by the UK Prudential Regulation Authority and is subject to regulation by the UK Financial Conduct Authority and limited regulation by the UK Prudential Regulation Authority. Details about the extent of The Bank of Nova Scotia's regulation by the UK Prudential Regulation Authority are available from us on request. Scotiabank Europe plc is authorized by the UK Prudential Regulation Authority and regulated by the UK Financial Conduct Authority and the UK Prudential Regulation Authority.
Scotiabank Inverlat, S.A., Scotia Inverlat Casa de Bolsa, S.A. de C.V, Grupo Financiero Scotiabank Inverlat, and Scotia Inverlat Derivados, S.A. de C.V., are each authorized and regulated by the Mexican financial authorities.
Not all products and services are offered in all jurisdictions. Services described are available in jurisdictions where permitted by law.