Bank of Canada: First to exit QE, first to hike in 2022.
Federal Reserve: A milder taper tantrum?
As distance from emergency conditions grows, policy guidance from both the Bank of Canada and the Federal Reserve will probably turn more restrictive in stages that gradually introduce tightened financial conditions as 2021–22 unfolds. To date, both central banks have guided that they will leave their policy rates unchanged until 2023, if not later, while standing by guidance in favour of a prolonged maintenance of asset purchase programs.
The narrative that follows explains how, dependent upon projected recoveries, material policy exit signals are likely to commence well in advance of guidance from these central banks. The BoC is forecast to be the first major central bank to shut down its Government of Canada bond purchase program within the coming year, to accompany this move with other forms of reduced policy accommodation along the way, and to follow that with a rate hike and restoration of the normal operating band of 50bps for the overnight rate by 2022H2. This is consistent with views expressed since November when vaccine trials became a game changer to the outlook, though perhaps not one set on a linear path!
On the back of heavy fiscal stimulus, we also think the Federal Reserve could achieve the goal of hitting its dual mandate with inflation “moderately above 2% for some time” and full employment by the end of next year. This would follow closure of the output gap by the end of this year and move into excess aggregate demand in 2022 based in part upon delivering a total of at least US$2.3 trillion in US fiscal stimulus including the December bill and the Biden Administration’s plans. The path to such an outcome would merit moving away from emergency stimulus by tapering Treasury and MBS purchases by early 2022. This is expected to be preceded by market effects likely later this year that could be substantially different from 2013–14.
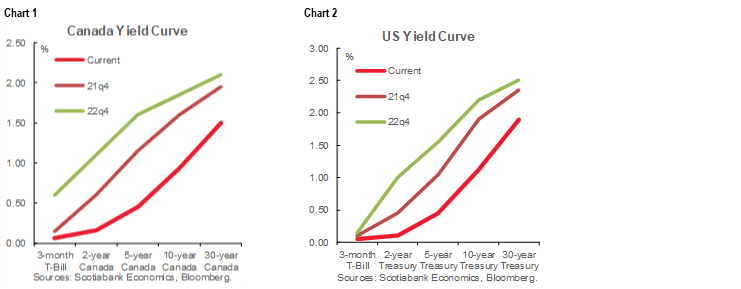
If ever the two central banks are to achieve their inflation goals—plus the Fed’s full employment part of its dual mandate—the conditions may be the ripest for doing so in many years on the back of vaccines, pent-up demand, massive stimulus overshoots and a more restrained supply side of the economy than in the past. That is forecast to lift the US 10 year Treasury yield to 1.9% toward year-end with slight outperformance in Canada 10s.
Risks include vaccine efficacy and roll-out, the ability of the private sector to take over growth following a fiscal ‘cliff’ effect, and potential market dislocation effects stemming from policy exits.
The supporting economics themes are laid out in this note.
1. FORECAST CHANGES
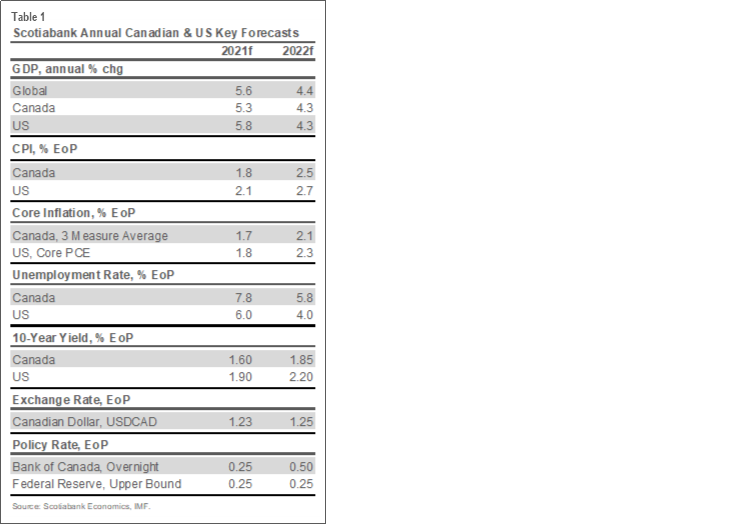
To help set the scene for nonconventional policy expectations and rate forecasts, our fresh February 2021 Economics forecasts have introduced generally positive revisions compared to our prior forecast in early December (table 1 in Appendix).
World GDP growth: 5.6% 2021, 4.4% 2022.
US GDP growth: 5.8%, 4.3%.
Canadian GDP: 5.3%, 4.3%. We have again revised 2020Q4 upward to 7.8% and revised 2021Q1 sharply higher from -2.1% to 0.6%.
Eurozone GDP: unchanged at 4.2%, 3.9%.
China GDP: unchanged at 8.3%, 5.9%.
US PCE inflation: 2.0%, 2.5%.
US core PCE inflation: 2.1% , 2.3%.
Canadian CPI inflation: 1.8%, 2.5%.
CDN core CPI: 1.8%, 2.2%.
US unemployment: 5.2%, 3.6%.
Canadian unemployment: 6.7%, 5.7%.
Note the material progress toward policy goals at both the Fed and the BoC that is embedded within these forecasts.
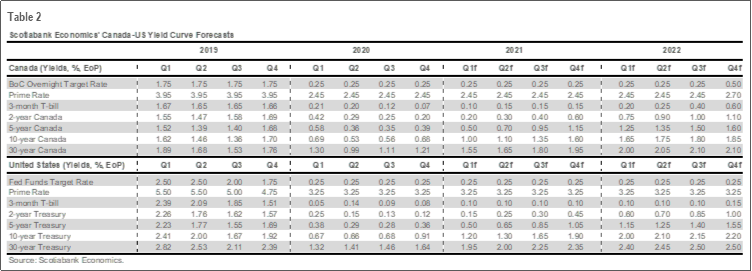
Charts 1 and 2 depict our yield curve forecasts for both the US and Canada over 2020–21. Trend curve steepening is forecast to continue over much of 2021 until broad flattening moves are expected toward year-end and through 2022. Short duration bets are expected to give way to a longer duration bias as the forecast horizon evolves. Please see table 2 in the Appendix for yield curve forecasts for both countries.
2. MACRO THEMES
As painful as COVID-19 has been to so many who have tragically suffered, the core bias is that the bulk of the heightened downside macro effects in the near-term will prove to be transitory. On balance, recent developments have lowered medium-term risks that overlap with the monetary policy horizon.
A) Vaccines
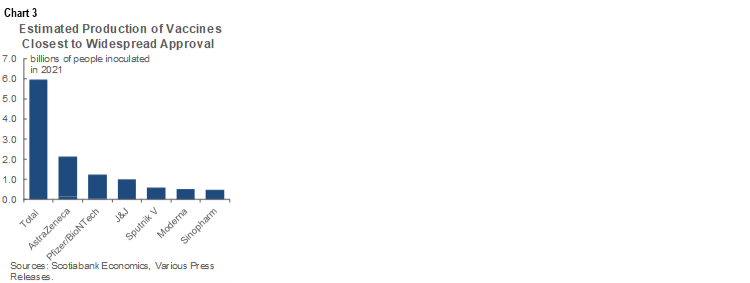
An estimated 9.2 billion doses of COVID-19 vaccines will be produced this year based on guidance from three western companies, one Russian venture and one Chinese outfit starting late last year and throughout this year. That will be enough to inoculate about 5.8 billion people at slightly varying rates of doses (chart 3), or about three-quarters of the world’s total population. Many other vaccine candidates remain under possible development which could eventually inflate coverage. As more production deals are struck, the year may end within spitting distance of global herd immunity defined at a 70% threshold. Many individual countries could well hit this milestone this year including Canada and the US.
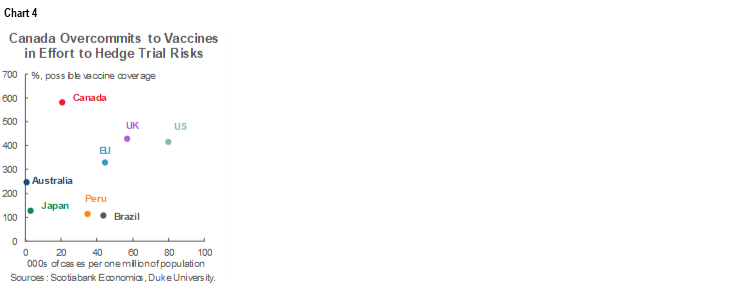
The narrative that is heard in some quarters that vaccine roll-out has been a failure is patently false. Vaccines arrived on the order of at least 6–12 months ahead of common assumptions up to just before positive trial announcements began to roll in during November. Current roll-out plans point toward full inoculation of the Canadian population over 2021H2. Expectations have shifted as the bar got raised and that’s understandable given the exigency of the challenges at hand, but progress is meaningfully more impressive than some of the opportunistic coverage suggests. In fact, as vaccine delivery recovers from temporary delays, Canada is in the sweetest spot of all with relatively fewer cases per capita and much higher coverage through production orders while the US has higher cases but is also above average in terms of securing vaccine contracts (chart 4).
B) Pent-Up Demand
Substantial pent-up demand is expected to be released by global consumers and businesses.
For one, US consumers could lead the world in this regard. Household debt payments are at a record low share of incomes. The US personal saving rate remains almost double what it was pre-pandemic. With the arrival of vaccines, spending may rise commensurately to a decline in the precautionary motive to save. The effects will cut unevenly across households but should be a powerful economic force. Every cycle brings concern that savings won’t be redeployed followed by amazement at how they were.
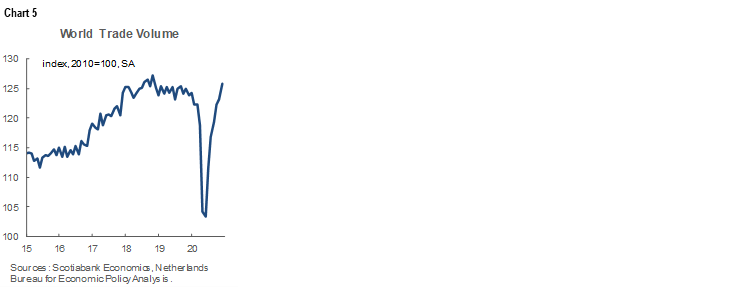
There is further room for recovery in world trade from the shutdown-induced depths of earlier this year (chart 5). The US-led global trade wars that dampened trade and added uncertainty may face an initially somewhat more favourable policy environment under a new US administration.
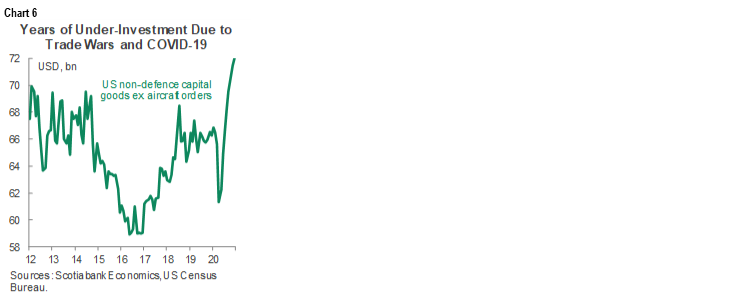
Stronger appetite for capital goods should gradually follow as spare capacity is reabsorbed and technology needs rise following years of under-investing (chart 6).
C) Canada’s Far Fewer COVID-19 cases…
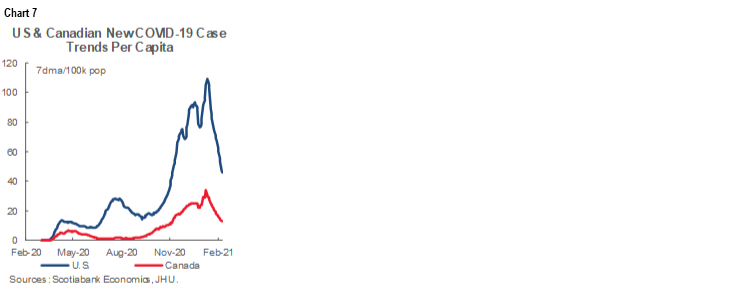
The US has had almost four times the number of COVID-19 cases per capita as Canada (chart 7). One might think that Canada has therefore had to apply less stimulus than the US. A counter point to this is that Canada has suffered not only under the weight of rising cases, but also through the indirect effects on the rest of the world and what that has done to Canada’s economy via trade and commodity channels. Still, while Canada’s economy initially retreated faster than the US, it also rebounded quicker over 2020H2. The economies are diverging somewhat in Q1 as Canada makes more aggressive use of restrictions than in the US, but this is expected to be transitory. If risks appear to be transitory, then the next step is to evaluate the magnitude of stimulus in the face of such a shock and to do so in relative terms.
D) ...Are Being Met by Record Monetary Policy Stimulus…
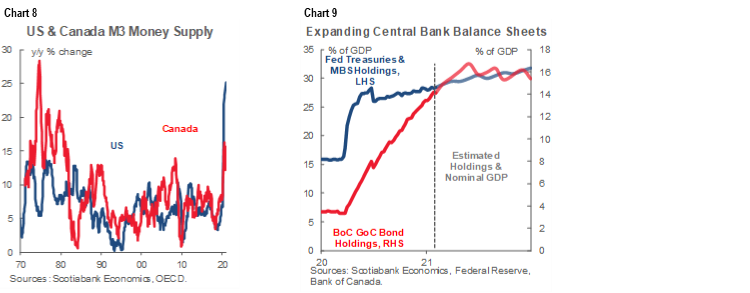
Growth rates in broad money supply are shattering multi-decade records in both countries (chart 8). Unlike the Global Financial Crisis, rapid expansion of central bank balance sheets (chart 9) is not being countered by broad shadow money destruction due to a credit crisis. If this truly proves to be a transitory shock marked by one really bad quarter for GDP last year in both countries, then this kind of sustained monetary policy expansion is extraordinarily aggressive. When accompanied by an expected GDP-driven recovery in velocity of money in circulation (or the rate of churn of the money supply which is low at present), the effects on inflation could be meaningful and quicker to turn than in the past. Until the present time, we’ve never had a period like this that can be modelled within-sample by way of the inflation consequences because we’ve never had a period in which central bank balance sheets have expanded as strongly with no countervailing forces.
E) …and this Time Joined by Explosive Fiscal Stimulus
The way a core debate surrounding the outlook for fiscal policy is being settled may ultimately promote future policy risks, but it supports a medium-term reflation bias. Central bankers across parts of the world economy have spent varying degrees of time and effort beseeching fiscal policymakers to spring the spigot, particularly in Europe, but also in the United States. Recall, for example, that as Chair Powell has noted, the Fed did QE3 when fiscal policy was in contraction whereas today both policy levers are expansionary and the Fed’s prior dreams are now being met—and how!
Governments used to be advised to conduct fiscal policy in counter-cyclical fashion by priming the pump when needed and then shifting to repair mode during a recovery. Whether that view is out of fashion today depends upon uncertain longer-term stimulus plans. For now, we have incorporated US$2.3 trillion of US government stimulus into our forecasts including the December 2020 stimulus bill and US$1.4 trillion of the Biden Administration’s targeted US$1.9 trillion of spending which itself may ultimately prove to be deliverable. That amounts to 11–13% of present nominal US GDP with much of that occurring this year while blowing away prior episodes of fiscal stimulus. Heavy spending ambitions remain targeted within growth-inclusive and environmentally interventionist strategic mandates.
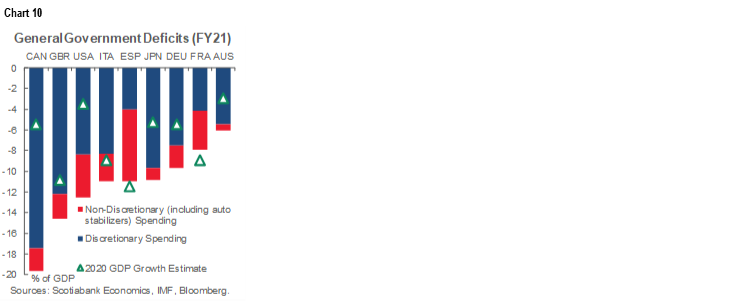
Some of this US stimulus will leak out into Canada through the trade account and represent backdoor stimulus. Further, a modest ‘blue wave’ in Washington is likely to carry spillover effects into a similar bias in Canada. Government deleveraging into stronger economies may be replaced by merely targeting flat government debt to GDP ratios at still-elevated long-run levels (chart 10).
There are merits to this approach—like reducing barriers to growth for women and infrastructure bottlenecks—but also risks if it hampers responses to future shocks. For now, it supports a medium-term reflation bias in stocks over bonds, but the key will be our assumption that there will be enough private sector momentum to take over when a fiscal ‘cliff’ of sorts presents itself later in the forecast horizon.
F) Other Risks
Brexit deal? Check. US stimulus and funding deal? Check. US election risk behind us with ‘blue wave’ achieved? Check. Highly stimulative financial conditions? Check. The broad evolution of risks to the outlook compared to when monetary and fiscal policies were set last year has demonstrated itself to be much more favourable.
3. INFLATION’S BEST CHANCE TO EMERGE
I’ve heard the line that a whole generation of market professionals has never seen inflation and that this might spark concern about how to handle its arrival. My bigger concern is that a whole generation of experienced traders think that because they haven’t seen inflation in the past decade or so that by definition they won’t see it in future. By corollary because they’ve seen the Fed and Fed-watchers over-estimate inflation risk and hence tightening cycles at times, that this means the same will be true in future. Maybe. But this confirmation bias that is rooted in past experience could leave such traders and investors flat-footed.
Set against the above-outlined macro backdrop is inflation’s best chance to emerge in years. Fed Chair Powell rightly notes that the Philips curve relationship between inflation and unemployment is flatter today than historically and that there is little persistence to inflation. He posits that changing demographics, advancing technology and globalization are the main reasons for these two observations. Even if we left it at that, Powell’s drivers could well be less of a drag on inflation going forward. For one, globalization has suffered a blow through trade wars we don’t expect to reverse soon. For another, digital companies may be exercising pricing power in the pandemic and thus mitigating technology’s disinflationary effects. Further, aging demographics is now accompanied by more restrictive immigration policy in the US before the pandemic, and through immigration shortfalls during 2020 and likely for some time yet in both Canada and the US.
It would nevertheless probably be remiss to leave the drivers at that in backward-looking fashion. One reason is the aforementioned far greater fiscal and monetary policy response this time and whether that is an overshoot of a transitory shock.
Second is that potential GDP growth—or non-inflationary growth limits—may be lower this time and lower than agencies like the Congressional Budget Office forecast for the US economy by showing zero net anticipated negative effect on potential growth. More restrictive global trade policies that have stemmed from the US-driven global trade wars commencing in 2018 could limit growth in the supply side of the economy in ways that—all else equal—reinforce inflation. The pandemic’s disruptive impact upon supply chains and scarring effects on labour supply may further this challenge and would be reflected in lowered estimates for noninflationary potential growth. So might the former administration’s anti-immigration policies, the wild card risk of border adjustments and carbon levies across multiple economies.
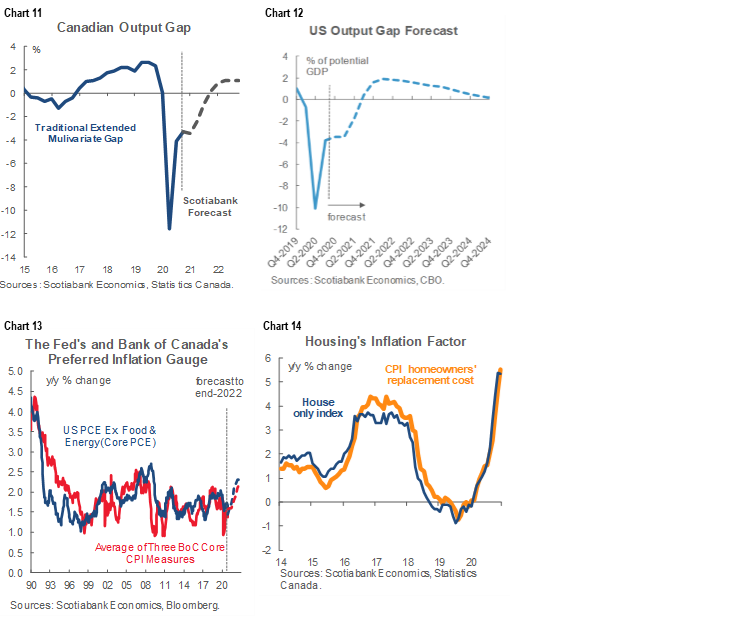
As a consequence to a more constrained supply side in this cycle alongside an expected boom in actual GDP growth, we forecast output gaps—the broadest measure of spare capacity—in the US and Canada to close as soon as the end of this year (charts 11, 12). The connection to inflation is modest. Scotiabank’s René Lalonde and Nikita Perevalov therefore run augmented Philips curve models that—while less sensitive to output gaps than historically—still forecast a gradual rise in US and Canadian core inflation toward target and beyond next year (chart 13). A bottom-up perspective on inflation is also utilized and may reinforce upward pressure upon core inflation through several key drivers. One example is derived from housing markets (chart 14).
4. BANK OF CANADA FORECASTS AND EXPECTATIONS
Set against a fairly upbeat macroeconomic backdrop that foresees a return to equilibrium conditions in terms of slack and the inflation target are expectations for the Bank of Canada to be done with adding new stimulus and to instead begin to transition further toward policy exits. Our official print forecast is for the BoC to raise its policy rate by the October 2023 meeting which will accompany the first hike with fresh forecasts. We have been advising clients to position for rate hikes by 2022H2 since very soon after positive vaccine trial announcements began to arrive in November.
Because of this policy rate bias, a marked cheapening of shorter duration bonds is anticipated with, for example, the two-year Canada bond yield rising toward 0.6% by year-end and to between ¾% and 1% by the end of 2022. Such a movement factors in expectations for a gradual transition toward policy tightening. The Canada 10-year is forecast to marginally outperform US 10s partly on lighter supply risk and less vulnerability to tapering.
Before we get to the risk of increases in the administered rate, there will be policy tightening in other forms that are designed to reduce liquidity and lessen downward pressure upon longer term borrowing costs. Further tapering of bond purchases is expected around 2021Q2. Several specific topics are explored within this outlook.
i. Moving Before Slack is Eliminated
We forecast the closure of the output gap by the end of this year. Note, however, that the BoC does not necessarily need to wait for the output gap to shut before commencing policy withdrawal. Further, this view isn’t contingent on the assumption they will tighten policy in anticipation of the output gap closing.
Recall that the BoC did not wait in 2010 when the BoC hiked three times in rapid succession starting in June of that year despite estimating an output gap of about -2.3% with the currency toward parity against the USD. As extreme emergency conditions passed back then, the case for keeping rates near zero with extreme emergency conditions had also passed, but ongoing stimulus was still required by maintaining a policy rate at something below neutral. Similar logic could be applied over our forecast horizon.
One difference to then is that today’s estimate of the neutral rate is considerably lower which may merit greater caution around lift-off. Back then the BoC commenced lift-off about 1½ years from the onset of the GFC and hiked three times in rapid fire. This time maybe it takes 2½ years to start by slipping in one or two hikes at first.
Other differences might work in the other direction by counselling sooner and faster hikes, like a greater overall monetary and fiscal policy response to this shock that may be more transitory amid a more damaged supply side of the economy.
ii. Micro Cut & Negative Rates Ruled Out
Scotiabank Economics believes the next policy rate move will be up based upon the views expressed thus far, but it’s worth assessing a lingering alternative risk. There has been considerable debate over the merits and likelihood of a small 10–15 basis point rate cut that would bring the Bank of Canada’s overnight lending rate to between 0.10% and 0.15%. This would require the Bank of Canada to lower its present guidance that the effective lower bound is 0.25% and hence the estimate of where rate cuts begin to court greater risk than reward.
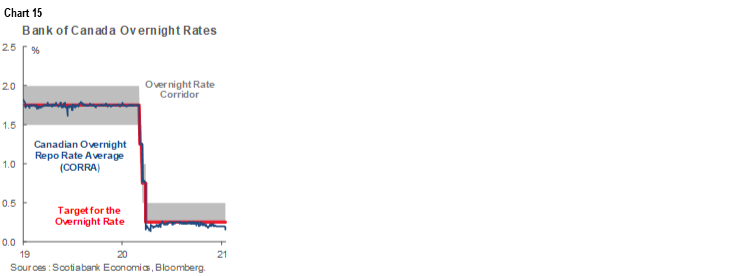
We don’t forecast a micro cut and believe that the Bank of Canada has moved on from the issue by treating it as a technical matter governing the functioning of short-term market rates that is best addressed through other tools. A recent decline in market-based measures of the BoC’s policy rate (chart 15) has slightly diminished and volatility in these measures likely speaks more toward supply shortages in short-term financial market paper such as treasury bills relative to excess liquidity that is still being applied. Following a surge in t-bill issuance, the outstanding amounts have sharply reversed while liquidity has continued to be strong. The net effect put upward pressure upon short-term paper prices and lowered their yields relative to the policy rate. This is a transitory market distortion that may persist for some time but that should not be chased by alterations to the policy rate as opposed to traditional open market tools designed to reduce a liquidity overshoot.
Further, if the output gap indeed shuts by the end of this year, then the medium-term horizon for monetary policy matters arguably needs no further stimulus. This fundamentals view dominates the BoC’s thinking around its policy rate with technical factors playing a more secondary role in the debate.
iii. What’s the Effective Lower Bound?
What also drove some expectations for a micro rate cut were references to such a potential step in remarks offered by Governor Macklem and Deputy Governor Paul Beaudry shortly before the holidays. They also guided that this would require lowering the BoC’s assessment of the effective lower bound for the policy rate from 0.25% at present to something a bit lower while ruling out negative rates at least under present circumstances.
The context in which they said this matters enormously. Beaudry’s speech quite deliberately noted that this would be a policy option “should things take a more persistent turn for the worse.” It’s not the least bit clear that the weakness we are likely to be experiencing in 2021Q1 will be persistent, or at least it’s highly premature to say so. Persistent might also be interpreted to mean downside risk through the medium-term policy horizon. He also said that reducing the ELB and a micro cut were among the policy options that also included increasing LSAPs, adjusting the maturity focus of purchases or other forms of yield curve control.
Instead of hearing “persistent” and that several tools could be employed, too many only heard ‘cut’ which was a misinterpretation.
Still, we don’t know what the BoC really thinks is the effective lower bound. The BoC defined the effective lower bound to be -0.5% from 2015 until March of this year. They presented research and a speech by former Governor Poloz to back this estimate in December 2015 (here). When the BoC redefined the effective lower bound to be +0.25% in April of this year it did so sans research and with no meaningful explanation. It’s feasible that the BoC just didn’t want markets to be pushing it toward a negative policy rate given the uncharted waters that would be entered upon doing so. Nevertheless, the BoC would have to present useful research to back up its claim that the effective lower bound is lower than it presently estimates if it were to revisit this again. That might be best left until we are well into the recovery period.
iv. Tapers sans Tantrums
There are three reasons guiding expected further tapering of Government of Canada bond purchases at a pace of C$4 billion or more per week. Our forecast is for a reduction to C$3 billion or more per week by 2021Q2 and as soon as the April MPR and then C$2 billion/week by about September before the program is wound down at year-end.
One reason is that Governor Macklem has roughly guided that bond purchases will continue until the economic recovery is ‘well underway’ but end before the output gap is shut. Given that we forecast a soft first quarter for growth followed by a persistent and strong rebound, the possibility of ending purchases becomes greater over the second half of the year. If the output gap shuts by the end of 2021, then ending bond purchases before the end of 2021 would fit the guidance.
The second reason concerns supply issues. The reason the BoC reduced its pace of bond purchases from C$5 billion or more per week by $1 billion last Fall was because such a pace of buying was swamping the boat in terms of the availability of shorter-dated bonds and creating market dysfunction. Roger Quick has done a lot of work on this topic across individual parts of the curve and thinks the shortages issue has migrated to somewhat longer maturities in order to merit a further reduction and extension of purchases toward longer maturities.
Third, the effects of Fed tapering and advance guidance could provide cover for the BoC. As explained in the Fed section later, recall that CAD depreciated by over a dozen cents to the USD as the Fed moved toward delivering its first taper in 2013. The BoC’s recent comments on CAD seem to be an exaggeration, but potential currency weakness could allay such concerns.
v. The BoC’s Shifting Balance Sheet
Chart 16 shows how tapering assumptions alongside other drivers contribute to forecasting the BoC’s balance sheet. What falls out of this is insight into timing the stages of policy withdrawal.
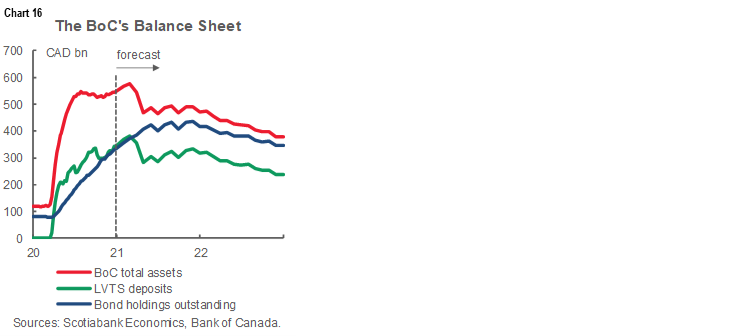
We forecast the Bank of Canada’s balance sheet to peak shortly, shrink in Q2 and then stabilize for a time before gradually declining in 2022. Deposits that Large Value Transfer System Participants hold at the Bank of Canada are forecast to follow a broadly similar trajectory to total BoC assets. LVTS deposits are forecast to start declining soon before stabilizing over the duration of the year and resuming a decline throughout all of 2022. This will represent the first stage of policy tightening as there will be less liquidity going into the financial system. That, in turn, may lessen distortions affecting market rates relative to the BoC’s policy rate.
The BoC’s aggregate bond holdings likely won’t begin to decline until into next year. In addition to BoC tapering of GoC bond purchases, we assume that the Provincial Bond Purchase Program may well not be extended beyond May—or if it is, then only for a few months—that the cessation of the Canada Mortgage Bond Purchase Program at the end of last October will result in slowly shrinking holdings as securities mature, and that corporate bond holdings will remain trivial. It is this second stage of 2021 tapering followed by outright shrinkage in the bond portfolio through 2022 that will mean less policy impetus to keeping longer term bond yields as low.
Government of Canada T-bills are forecast to shrink to about the C$30 billion stock that existed pre-pandemic as a normalized holding for monetary policy purposes. Provincial money market instruments are assumed to fully roll off the balance sheet by 2021Q2.
vi. Hiking and the neutral rate
If a runner knows s/he is facing a short 100 meter sprint toward the finish line, then s/he will want to burst out of the runner’s block and run as hard as possible. If, however, it’s a marathon then a more moderated pace is more likely to enjoy success.
In central banking, the opposite holds true. The lower the estimated neutral policy rate sits relative to the effective lower bound, the more slowly and measured the central bank may choose to proceed toward tightening policy. The scope for error attached to going too quickly may be greater given the lower margin of potential policy error.
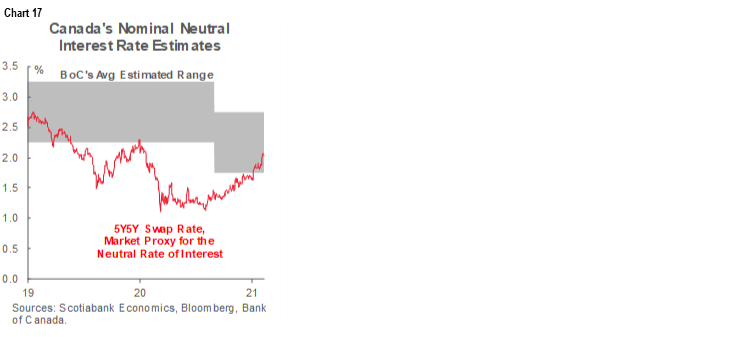
Thus, when the pandemic caused the Bank of Canada to further reduce its estimated neutral rate range by 50bps to 1.75%–2.75% with a 2.25% mid-point (here), it sent a signal that it is going to proceed carefully. Policy adjustments need not go in a straight line and are unlikely to zip back to the neutral rate in a hurry. It’s feasible that the BoC thinks the neutral rate rests closer to the lower half of the 1.75–2.25% policy range based upon similar guidance from Governing Council in the years before the pandemic. Markets presently think that the neutral rate is toward the bottom of the BoC’s band (chart 17). If so, then 2% would likely be around where the BoC defines the neutral rate. That implies about 175bps of room to tighten before policy is no longer stimulative.
vii. Starting the Journey
Proceeding slowly and in measured fashion does not, however, have to mean never getting started. This truism is offered to make the point that as emergency conditions pass and further distance emerges from such conditions, the BoC should feel comfortable starting the process of removing emergency levels of stimulus. That doesn’t need to mean quickly shooting to neutral or beyond. It could mean experimenting with policy withdrawal by hiking in chunks and seeing how the economy and markets respond. In my view, markets are already long past emergency conditions and the economy will soon be. As distance from emergency conditions increases, less stimulus should follow. Because the neutral rate is likely lower now, there may be less room for error which suggests an appropriate path could be to begin with modest adjustments with go-slow forward guidance.
viii. Hike ahead of the Fed?
Yes, it is possible. In fact it has happened before. Former Governor Carney hiked the BoC’s policy rate by 75bps to 1% in 2010 while the Fed left its policy rate unchanged until late 2015. The BoC’s policy rate stayed at 1% for five years until early 2015 when conditions changed and then Governor Poloz felt it necessary to ease policy in response to a transitory oil shock. There was also the episode in 2002–03 when the BoC was raising its policy rate as the Fed continued to cut; that period, however, was more likely a policy error than in 2010 as the BoC would soon unwind all of its hiking.
The BoC may well end up hiking ahead of the Fed again in this cycle. Canada’s COVID-19 cases have been vastly lower than in the US, it is much more hedged through vaccine commitments than the US and expected to catch up on administered doses, and both fiscal and monetary stimulus responded more aggressively in Canada than the US with an earlier forecast closure of spare capacity. Canada should also benefit vicariously from US fiscal stimulus. A more aggressive stimulus response to a more modest—but still large and tragic—transitory shock may get the BoC to its goalpost ahead of the Fed.
ix. What about the currency?
Thus far CAD appreciation is supported by underlying fundamental drivers and would only be a concern to the BoC if it overshoots a fundamentals-driven equilibrium, but would hiking ahead of the Fed drive C$ appreciation in a way that hampered policy goals? Or would the fact the BoC is leading on tapering boost the C$? These are feasible effects, but not foregone conclusions. Starting with a simple example, note that when the BoC ran 75bps ahead of the Fed in 2010, the Canadian dollar barely budged which served as a reminder that there are many drivers of the currency.
Furthermore, the offset could be the effects of Fed tapering that could leave room for the BoC to hike. Recall that the Canadian dollar depreciated by over a dozen cents to the USD when the Fed started moving toward guiding and then delivering tapered bond purchases from January 2013 through to about a year later. The potential for C$ depreciation in a tapering scenario could well mitigate BoC concerns toward the currency effects of hiking the policy rate.
This also assumes that further BoC tapering of its own bond purchases will continue to have little effect on the C$—like the first taper last October that did not result in outperformance of the C$ to the USD compared to other crosses. Why? That first time it was likely because they reduced but also lengthened the weighted average maturity of purchases to influence longer-term borrowing costs. Going forward, BoC tapering will likely be child’s play compared to the Fed in terms of influences on USDCAD. The BoC’s program at C$16 billion+ per month may be roughly proportionate to US$120 billion/month at the Fed, but the Fed reinvests maturing flows and the Bank of Canada does not, which is a meaningful difference in that it drives expectations for the BoC’s balance sheet to shrink outright much earlier than the Fed’s. Markets already understand that the BoC does not need to begin eliminating reinvestment flows that are not priced into Canadian bonds as they are in the US.
In any event, the principal mechanism by which CAD appreciation would impact the BoC would be through inflation pass-through arguments. For every sustained 10% trade-weighted appreciation in the currency, most economists continue to feel comfortable estimating a disinflationary effect in the low tenths of a percentage point over about a 1–2 year period. The effects of currency movements are also likely to be transitory. Modest further currency strength is factored into our inflation forecast, yet other domestic drivers dominate the inflation outlook with the return to target within our forecast horizon, and Fed tapering could drive CAD the other way in my personal opinion.
X. Will the Strategic Review Follow the Fed?
The Bank of Canada is undergoing its usual five-year strategic review on the path to the next inflation renewal agreement. The results of its review will not be communicated until later this year.
Recall that the Fed shifted last August toward aiming “to achieve inflation moderately above 2 percent for some time” following periods when inflation has persistently undershot the 2% target. It is also bound by the mandate set by Congress to achieve maximum employment. How to define “moderately” and “some time” is uncertain. The broad aim is to embrace a price-level targeting approach following periods of sub-target inflation in order to allow price levels to fully catch up with inflation allowed to overshoot the goal. Once arriving at that point, policy shifts toward flexible inflation targeting with a symmetrical policy bias.
Should the BoC do the same thing? Theoretically, it may not have to. It targets 1–3% inflation with a 2% mid-point that is expressed as symmetrical in nature. It aims to achieve this goal over the medium-term defined as typically within 6–8 quarters. In practice, there have been times when the BoC has employed a flexible approach to inflation targeting, such as in 2011 when inflation shot to a peak of 3.7% y/y while the BoC resisted further tightening because it believed the transitory nature of the overshoot and the downside risks facing the economy merited a continued pause at 1%.
So far, Governor Macklem has reinforced emphasis on the 2% target as past reviews have rejected the merits of alternative frameworks such as price level targeting—permanent or like the Fed’s transitory hybrid—or targeting nominal GDP or allowing inflation overshoots following undershooting periods. The conclusion of its review nevertheless remains a risk to our views.
That’s because—like the Fed—inflation has persistently undershot the Bank of Canada’s inflation target for about a decade now. Headline CPI inflation has been below the 2% target two-thirds of the months since 2010. Core inflation using the average of the BoC’s three measures has been below the 2% target 94% of the time over this same period. As a consequence, headline and core inflation have averaged 1.7% over this period. The BoC—like many other central banks—has generally been unsuccessful toward achieving its target in symmetrical fashion for a now lengthy period.
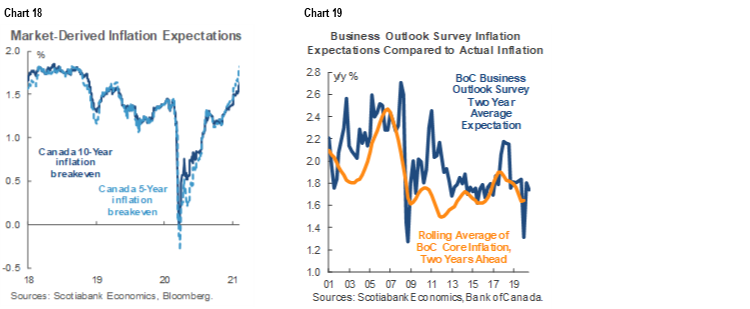
Because of persistent shortfalls to the 2% target, measures of inflation expectations have also moved below 2%. Chart 18 shows market-based measures while chart 19 shows survey-based measures.
What’s more, the BoC’s track record at forecasting inflation has been persistently too aggressive. Chart 20 shows the path of actual inflation over the past decade compared to each successive round of forecasts drawn from Monetary Policy Reports over the years and depicted as dashed lines. The central bank routinely forecasts a return toward 2% within its horizon and has been routinely disappointed.
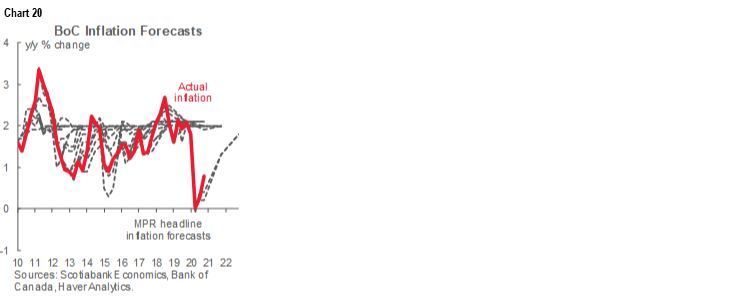
Why? The challenge may well lie in the way the central bank operationalizes its inflation target. It has arguably treated 2% as a ceiling that has invoked past tightening, rather than as a symmetrical target. As a consequence of this asymmetric operationalization of the symmetrical target range, the BoC’s actions have arguably unmoored measures of inflation expectations.
At this point, the way we express this view in our forecast guidance is that the reduction of downside inflation risk will merit commencement of rate hikes in keeping with the traditional policy apparatus but the track record and expectations will merit going slowly.
5. THE FEDERAL RESERVE—FORECASTS AND EXPECTATIONS
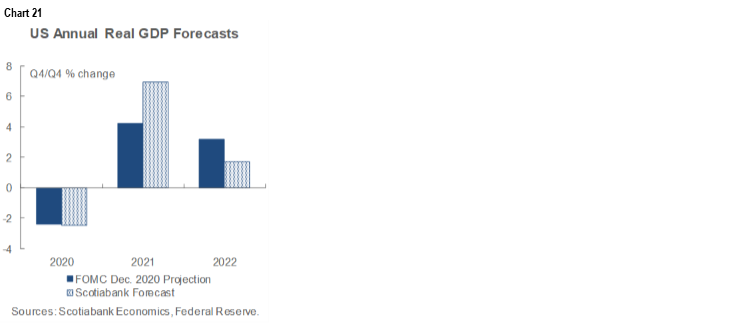
The Federal Reserve is forecast to tighten policy in stages starting over the second half of this year. The effects are expected to be disruptive to markets but possibly in a lighter version of what happened in 2013–14 at least for the bond market. The fundamental drivers have already been discussed and they are expected to result in the FOMC revising upward its projected growth this year compared to the December forecasts that did not fully incorporate fiscal policy and vaccine effects (chart 21).
The heart of the argument that follows is that as distance from true emergency conditions increases, the case for sitting near zero on the policy rate and buying bonds by the bucketful becomes increasingly tenuous, even if it is decided that a large balance sheet and below neutral policy rate will need to be maintained for some time yet.
i. Moving in a More Optimistic Direction
At the margin, the tone of Fed communications is tentatively already judged to be moving in the direction of a different policy framework. For example, Chair Powell’s recent remarks on the policy rate have shifted from “we’re not even thinking about thinking about raising rates” just months ago to recently guiding that rates will not go up “soon.” Further, on returning to full employment, Powell recently said "I think we can get back there [ed. to before 2020] earlier than we had feared." Powell has also remarked that “we need to finish the job” and “it’s within our power to do that this year” in reference to the collective abilities of all policymakers. He also repeated reference to how the pandemic “had a much smaller effect than expected” on the economy as “people just got on with their lives” even as COVID-19 cases picked up over the summer. That’s as far as the Fed is likely to go so far as they talk down more upbeat scenarios to avoid early market tightening.
Ii. Stages of Tightening
The first stage is expected to involve addressing whether to extend several facilities that are slated to expire at the end of March. They include the Commercial Paper Funding Facility, the Money Market Mutual Fund Liquidity Facility, the Primary Dealer Credit Facility, and the Paycheck Protection Program Liquidity Facility. Powell recently only said that “We're going to continue to monitor conditions. If emergency conditions persist then our emergency facilities will continue. I have not had meetings or discussions with Treasury on that.” In my view, emergency conditions have passed quite some time ago and, while there may be a case for allowing the facilities to expire, their underutilization may also pose little downside to extending them other than tying up a modest remaining amount of Treasury capital that may be put to better uses by that time.
The second stage is expected to involve tapering the present rate of purchases set at US$80 billion per month into Treasuries and US$40 billion per month into MBS. The Fed’s first guidance to expect tapering is assumed to arrive over 2021H2. The first taper is expected to be delivered early in 2022. 100% of economists in a recent Bloomberg survey said they expect tapering by 2022Q2 and about three-quarters expect it by 2022Q1 with roughly half of that expecting tapering by 2021Q4. You may see that survey result move earlier and with higher probabilities centered around Q4/Q1 if upside progress to the outlook unfolds, but our base case assumption is 2022Q1. Traders are generally backing up such a view in light of the steepening of the US Treasury curve and rising market-based measures of inflation expectations. Given that Chair Powell has said the FOMC will provide plenty of heads-up, market participants will soon be looking for guidance.
Thereafter, the minutes to the October 2020 FOMC meeting indicated that a similar approach to tapering purchases to that which was adopted in 2014 is likely which implies that purchases will be reduced on a meeting-by-meeting basis until eliminating them in late 2022. If the Fed continues to follow the order of operations employed over 2013–15 then this implies that a one-year reinvestment period during which the balance sheet will be held steady is likely to ensue throughout all or much of 2023. We’ve left open the possibility that the different conditions during current circumstances may compress the process and possibly deliver a first hike in 2023 or perhaps earlier. Reducing accommodation and then quantitative tightening are expected to steepen the Treasury curve.
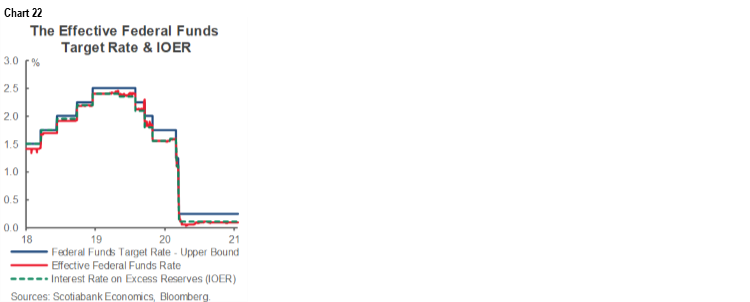
Along the way we may see the spread between the fed funds target rate and the Interest on Excess Reserves rate narrow from present levels (chart 22).
It is expected that Chair Powell will learn from the abrupt disruptions that Chair Bernanke’s guidance on May 22nd 2013 caused when he sparked a taper tantrum across financial markets by stating that reduced purchases would be implemented “in the next few meetings.” Simply providing advance guidance well ahead of tapering will be insufficient as that would replay the experience of 2013.
Still, the process is expected to be disruptive to asset pricing almost by definition. The entire point of reducing purchases is to gradually reduce stimulus and tighten financial conditions which implies repricing assets from bonds through equities, currencies and commodities. The issue is how disruptive this process may be to markets, yet it’s not clear how the Fed will manage a soft(er) landing this time.
Iii. A Lower and Tighter Treasury Yield Corridor
One possible argument applied to the bond market is that there is a narrower corridor within which Treasury yields may be rocked than was the case in 2013 when the 10-year Treasury shot up from 1.6% in May 2013—when then-Chair Bernanke first guided that the Fed may taper over the coming meetings—to 3% by the time they did so in December of that year.
That’s because the Fed and the market have lowered their estimates of the Fed’s long-run neutral rate (chart 23). Market measures don’t necessarily perform any better at estimating the neutral rate than fed funds futures perform at predicting the fed funds target rate, so a neutral rate around 2% or slightly higher is assumed. With the policy rate constrained by a positive lower bound given the Fed’s rejection of negative rates, a lower neutral rate estimate with term premia tacked on should contain the upside pressure upon the whole term structure of interest rates to less than what was the risk in 2013–14. Markets are notorious for undershooting and overshooting resting points, but this corridor argument could contain the ultimate resting point.
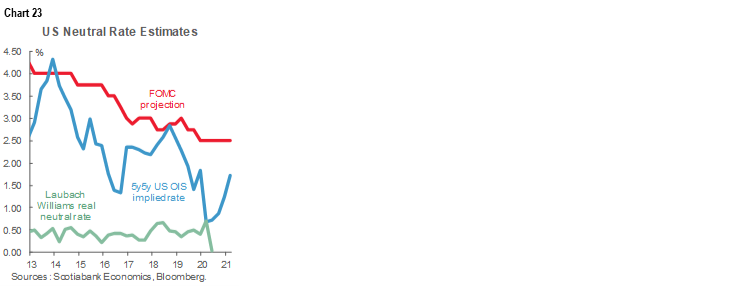
That doesn’t mean a bond sell-off would be a delightful experience this time, but it’s a reason the US 10-year yield is forecast in a tapering scenario to rise to just shy of 2% this year. That would still be relatively low by historical standards, but a notable sell-off from today’s levels.
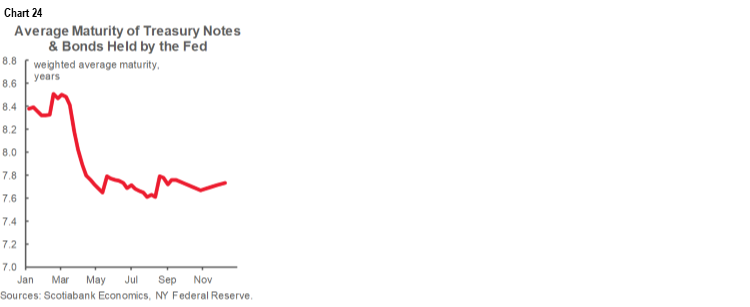
iv. WAM Adjustments?
Another tool that the Fed might come to consider in controlling tapering effects on markets could be to extend the weighted average maturity of its purchases (chart 24). “Nearly all” FOMC members were opposed to extending the weighted average maturity of its bond purchases at the December meeting—as the BoC did at its October meeting—and they are likely to be of the same view now given sound drivers of the modest additional rise in Treasury yields since then. If the FOMC judges that those drivers continue to be sound, then it may be unlikely they would resort to extending WAM, while retaining it as an option should market volatility become too great.
That’s not a guarantee of success as there are limits to Fed influences upon the curve. For example, each time the Fed introduced successive rounds of QE, Treasuries rallied into it and sold off with yields pushing higher and with little to no permanent effect and trying to fight this might backfire by driving inflation expectations higher. They could even come to argue that should the Treasury curve steepen too far then it may be taken as a signal that raising the policy rate is needed to contain inflationary pressures as factored into longer term yields.
v. Knock-on Effects of Tapering
The same argument about a lesser potential effect on bond markets from tapering today versus in 2013–14 may only partially apply to today’s currency markets and cross-border capital flows.
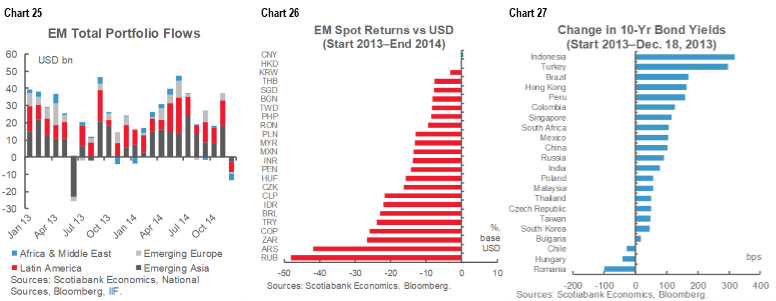
Recall that in 2013, the initial taper tantrum resulted in a large withdrawal of portfolio flows from emerging markets (chart 25). This was true across both equities and bonds. The second-round response continued to offer capital flows, but the market demanded a steadily higher return which drove many currencies sharply lower over 2013–14 (chart 26). This was not just the case for EMs either, as other higher beta currencies weakened—such as the Canadian dollar that depreciated by over a dozen cents from early 2013 through to early 2014. The repricing of the US 10-year note and capital flight from EMs also drove their own bond yields sharply higher (chart 27).
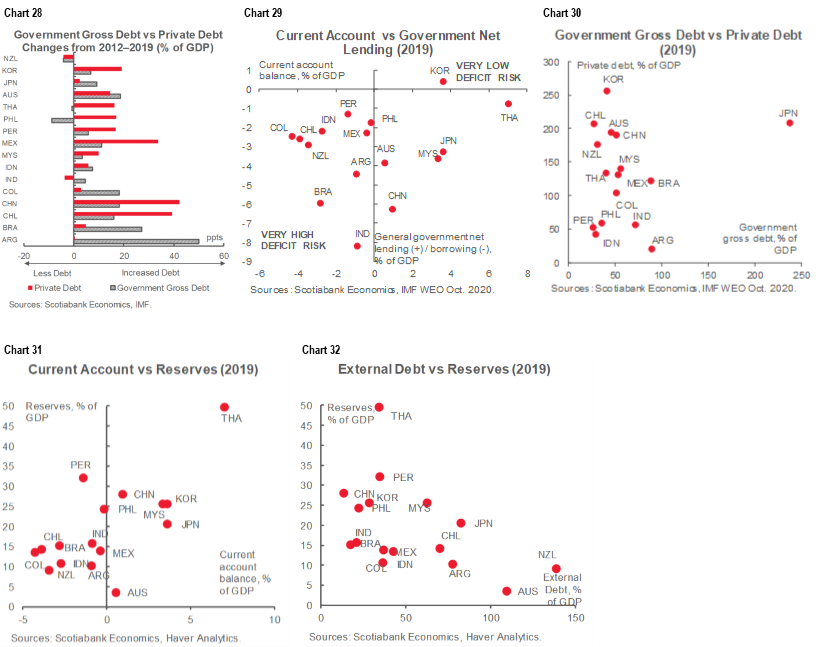
That EMs may be more vulnerable to capital withdrawal and higher return expectations is partly indicated by chart 28 that shows how much their private and government debt has risen since the eve of the 2013 tantrum to the eve of the pandemic. The importance of not treating EM as a broad asset class rather than dissecting prospects on a differentiated basis is illustrated by charts 29–32 that depict the vast differences in measures like external debt, reserves and current account balances. Fed tapering that pulled back the security blanket on EMs set in motion a round of challenges by unveiling what lurked beneath and therefore served as the catalyst to broader challenges.
To these points one could add other aspects of how the markets have changed since the 2013 tantrum. Back then there was basically no negative-yielding debt in the world versus US$16 trillion of negative-yielding debt today. While correlated selloffs are likely across global bond markets in a taper scenario, carry out of negative-yielding markets into Treasuries may contain at least some of the potential rise in Treasury yields. Downward pressure upon relative carry now versus 2013–14 including via negative policy rates in the Eurozone and Japan could contain currency movements as well. If so, then negative rates elsewhere and carry into the US Treasury market could actually serve to expedite the withdrawal of Fed stimulus. In addition, there remains a large glut of global excess savings that can help contain higher yields and pressure on individual countries’ capital accounts, but not thwart such effects.
APPENDIX: FORECAST SUMMARIES
DISCLAIMER
This report has been prepared by Scotiabank Economics as a resource for the clients of Scotiabank. Opinions, estimates and projections contained herein are our own as of the date hereof and are subject to change without notice. The information and opinions contained herein have been compiled or arrived at from sources believed reliable but no representation or warranty, express or implied, is made as to their accuracy or completeness. Neither Scotiabank nor any of its officers, directors, partners, employees or affiliates accepts any liability whatsoever for any direct or consequential loss arising from any use of this report or its contents.
These reports are provided to you for informational purposes only. This report is not, and is not constructed as, an offer to sell or solicitation of any offer to buy any financial instrument, nor shall this report be construed as an opinion as to whether you should enter into any swap or trading strategy involving a swap or any other transaction. The information contained in this report is not intended to be, and does not constitute, a recommendation of a swap or trading strategy involving a swap within the meaning of U.S. Commodity Futures Trading Commission Regulation 23.434 and Appendix A thereto. This material is not intended to be individually tailored to your needs or characteristics and should not be viewed as a “call to action” or suggestion that you enter into a swap or trading strategy involving a swap or any other transaction. Scotiabank may engage in transactions in a manner inconsistent with the views discussed this report and may have positions, or be in the process of acquiring or disposing of positions, referred to in this report.
Scotiabank, its affiliates and any of their respective officers, directors and employees may from time to time take positions in currencies, act as managers, co-managers or underwriters of a public offering or act as principals or agents, deal in, own or act as market makers or advisors, brokers or commercial and/or investment bankers in relation to securities or related derivatives. As a result of these actions, Scotiabank may receive remuneration. All Scotiabank products and services are subject to the terms of applicable agreements and local regulations. Officers, directors and employees of Scotiabank and its affiliates may serve as directors of corporations.
Any securities discussed in this report may not be suitable for all investors. Scotiabank recommends that investors independently evaluate any issuer and security discussed in this report, and consult with any advisors they deem necessary prior to making any investment.
This report and all information, opinions and conclusions contained in it are protected by copyright. This information may not be reproduced without the prior express written consent of Scotiabank.
™ Trademark of The Bank of Nova Scotia. Used under license, where applicable.
Scotiabank, together with “Global Banking and Markets”, is a marketing name for the global corporate and investment banking and capital markets businesses of The Bank of Nova Scotia and certain of its affiliates in the countries where they operate, including; Scotiabank Europe plc; Scotiabank (Ireland) Designated Activity Company; Scotiabank Inverlat S.A., Institución de Banca Múltiple, Grupo Financiero Scotiabank Inverlat, Scotia Inverlat Casa de Bolsa, S.A. de C.V., Grupo Financiero Scotiabank Inverlat, Scotia Inverlat Derivados S.A. de C.V. – all members of the Scotiabank group and authorized users of the Scotiabank mark. The Bank of Nova Scotia is incorporated in Canada with limited liability and is authorised and regulated by the Office of the Superintendent of Financial Institutions Canada. The Bank of Nova Scotia is authorized by the UK Prudential Regulation Authority and is subject to regulation by the UK Financial Conduct Authority and limited regulation by the UK Prudential Regulation Authority. Details about the extent of The Bank of Nova Scotia's regulation by the UK Prudential Regulation Authority are available from us on request. Scotiabank Europe plc is authorized by the UK Prudential Regulation Authority and regulated by the UK Financial Conduct Authority and the UK Prudential Regulation Authority.
Scotiabank Inverlat, S.A., Scotia Inverlat Casa de Bolsa, S.A. de C.V, Grupo Financiero Scotiabank Inverlat, and Scotia Inverlat Derivados, S.A. de C.V., are each authorized and regulated by the Mexican financial authorities.
Not all products and services are offered in all jurisdictions. Services described are available in jurisdictions where permitted by law.