CANADA HOUSING MARKET: THE BEGINNING OF THE END?
SUMMARY
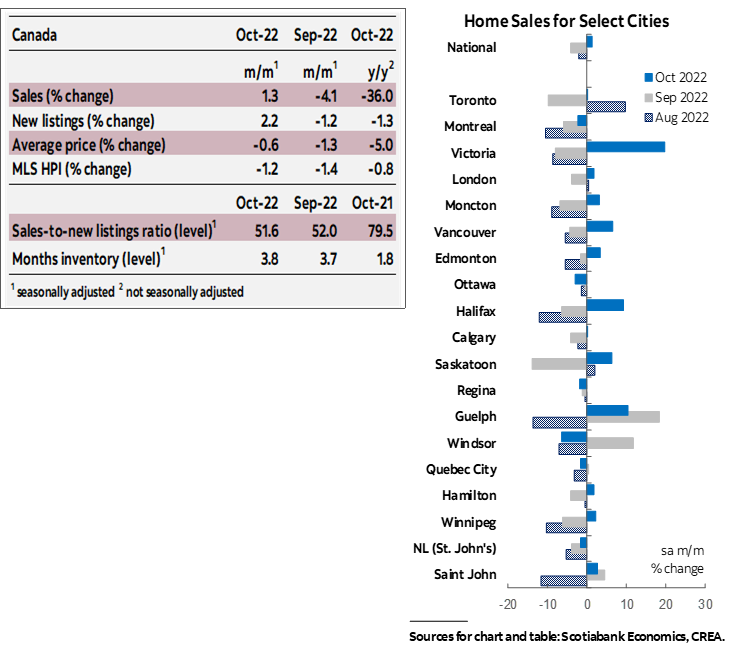
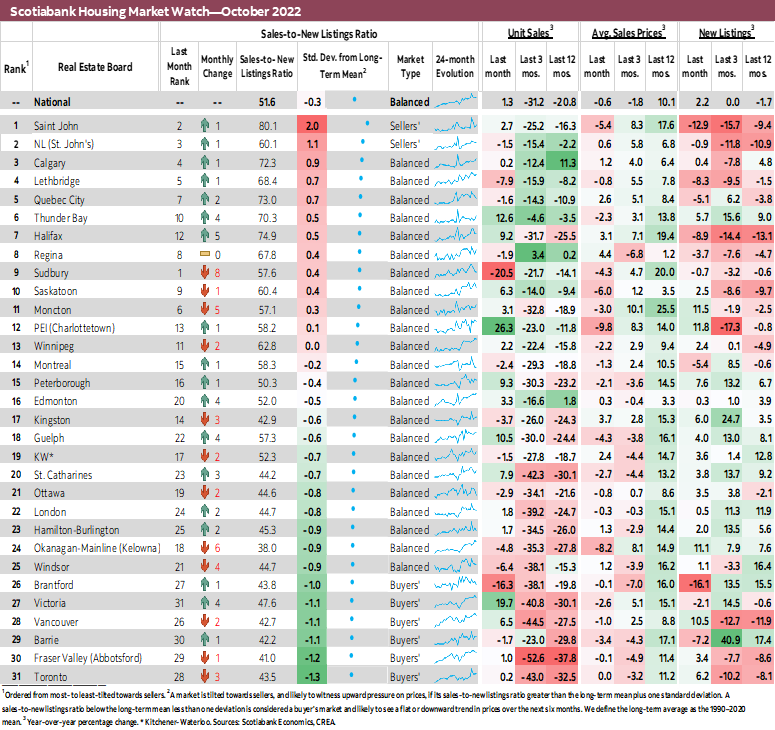
Canadian home sales rose for the first time in eight months, up by 1.3% (sa m/m) in October. Listings followed suit, rising by 2.2% (sa m/m). This eased the sales-to-new listings ratio, an indicator of how tight the market is, to 51.6%—below its long-term average of 55.1%, putting the national housing market in balanced territory. This easing and overall more balanced market conditions brought about another decline in the composite MLS Home Price Index (HPI), which edged down 1.2% (sa m/m) in October compared to September, a deceleration from September’s 1.4% decline, continuing a trend of decelerations in price declines since June.
While sales declined in almost half of the local markets we track, those were offset by double-digit gains in Guelph, Thunder Bay, Victoria and Charlottetown. Despite the resulting national monthly increase, the level of sales remains below its pre-pandemic levels, with October’s sales hovering around 12% below the month’s 2010–2019 average.
Listings increased in two-thirds of our local markets. This could have assisted some of the sales as listings increased in half of the markets where sales did too. Listings had been declining up until this point, and October’s increase leaves them 4% below the month’s 2010–2019 average. The month’s increase nonetheless helped prop up months of inventory, which continued to climb up from record lows, reaching 3.8 months in October—still below its long-term average of 5 months, but much higher than its all-time low of 1.7 months.
Single-family homes led October’s price declines—measured by the MLS Home Price Index (HPI)—while apartment prices proved stickier. October’s monthly decline in the composite MLS HPI represented a deceleration from the prior month. This deceleration was led by apartments and townhomes. Relative to a year ago, October was the first month since November 2019 where the MLS HPI recorded a decline, albeit a very small one (-0.4% nsa y/y). The 1.9% (nsa y/y) decline in single-family homes offset 5.9% (nsa y/y) and 3.9% (nsa y/y) gains in apartments and townhomes.
IMPLICATIONS
After seven months of declines in home sales, triggered by the Bank of Canada hiking cycle alongside worsening economic conditions, October saw home sales edge up. Whether this marks the end of the welcome correction that has been underway is premature to call. However, this is in line with our expectations of a moderating pace of correction and an eventual uptick in demand. It will be interesting to see whether this month’s result will trigger a return to the market by buyers—the same way that declines triggered a self-fulfilling wait-and-see approach as buyers expected further softness and price declines. If those buyers interpret October’s result as the dip, then this could mark the beginning of the end of the housing market correction. This is of course all speculative, we should refrain from declaring beginnings and ends based on a single month’s data point. However, this is one of the things we will be paying attention to in the upcoming months to assess the stage of the housing correction.
National home sales are now around 36% below their February 2022 level, right before the Bank of Canada started hiking its overnight rate. Despite October’s uptick in activity, national sales levels continue to sit below their pre-pandemic long-term average. Other factors also contributed to this recent softness in the market, including the rising uncertainty and loss of purchasing power as prices rose and equity markets plummeted. Not to mention the fact that the level of activity seen in the housing market in 2021 was substantially above what historical trends implied, despite that year being the weakest in Canada’s modern history in terms of population growth. The softness so far this year, therefore, is also partly the outcome of an advancement in purchases to 2021 that would’ve otherwise taken place in 2022.
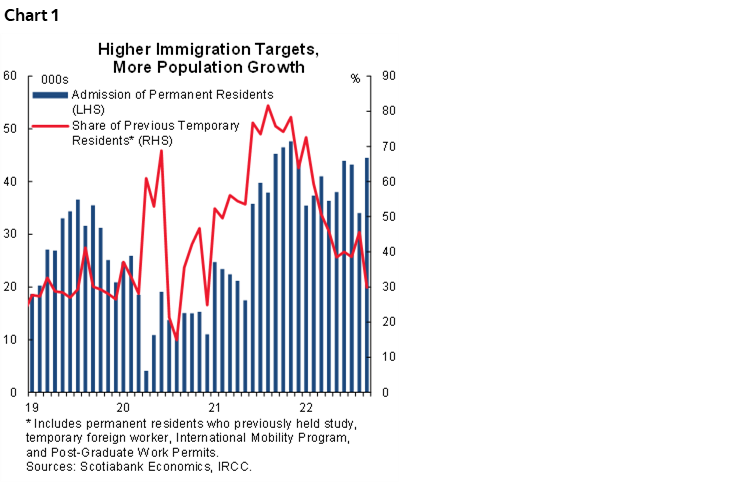
This is expected to start reversing however as population growth picks up due to higher immigration targets and the rising share of newcomers to fulfill them (chart 1). It is unclear whether this motivated the uptick in activity in October in any meaningful way, but what is more clear is that in the longer term, this acceleration of immigration will reverse the recent easing of supply-demand imbalances in Canada’s housing market if no progress is made on increasing the stock of housing supply.
In any case, prices continued to decline in October despite the rise in sales and are expected to continue to decline at least in the short term, even if it does turn out that sales will be on an upward trajectory moving forward if the above speculation proves true. This is because of the shift in the market’s psychology since the beginning of the correction whereby buyers have regained some pricing power and sellers have partially adapted their profit expectations. Don’t forget that the increase in sales in October after months of declines was also accompanied by an increase in listings, some of which are sellers accepting the new status quo and returning to the market with more reasonable (only relatively) asking prices. Therefore the beginning of the end of prices adjusting, if it were to happen, would lag that of sales.
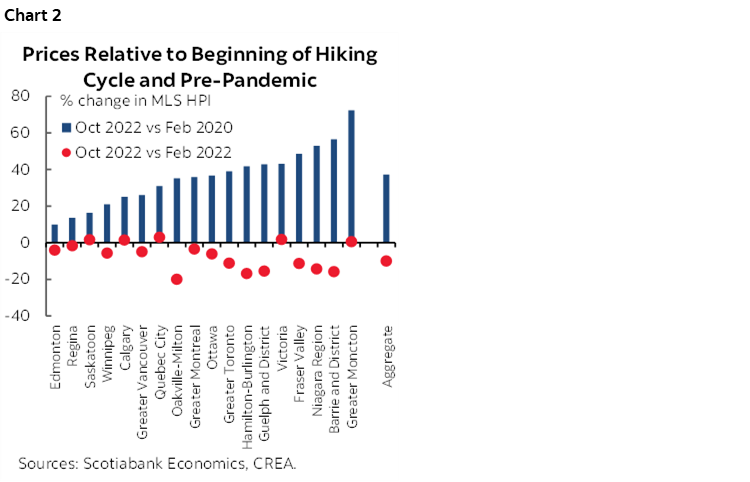
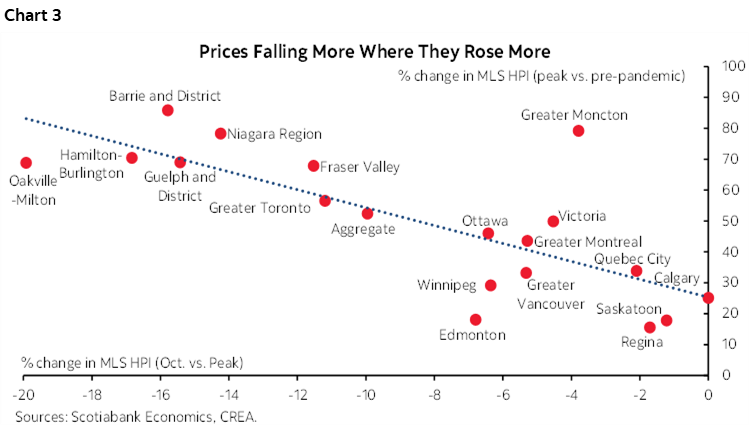
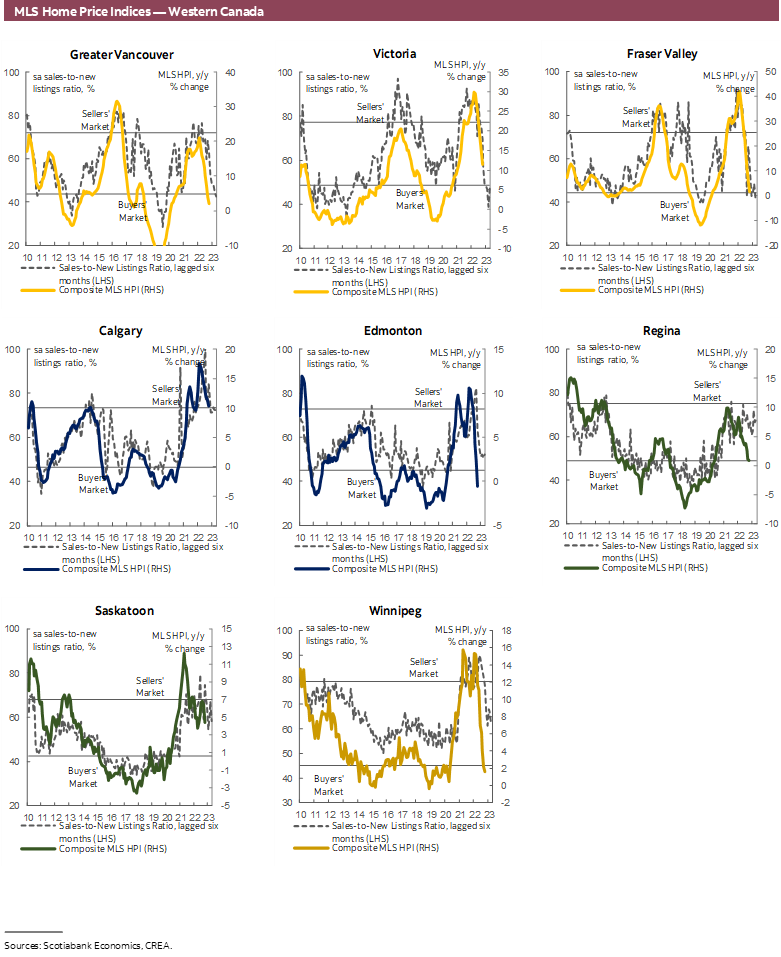
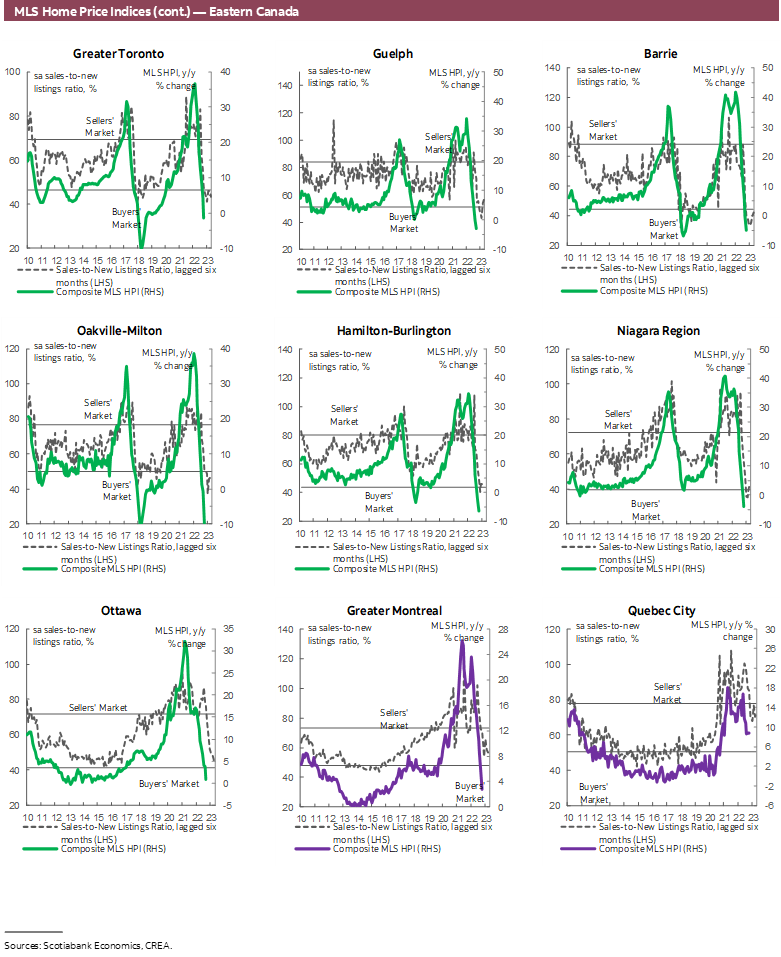
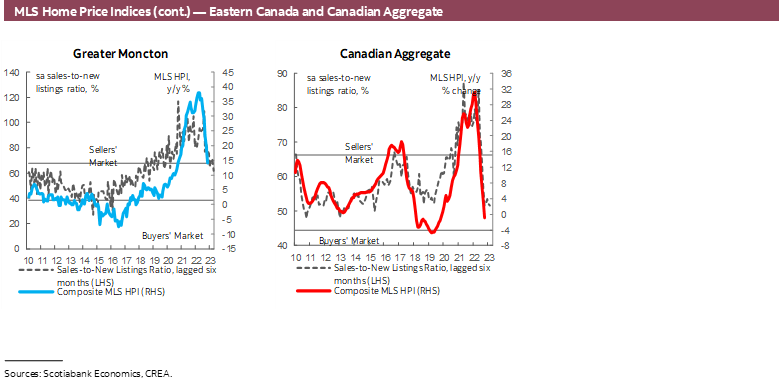
Indeed, the recent declines in prices, measured by the MLS House Price Index (HPI), are following a similar trend to the declines in sales before they increased, getting progressively smaller each month. As explained in previous reports, focusing on monthly changes in the average selling price is misleading as it does not indicate a change in the value of the average home and is easily swayed by the composition of sales. Instead, we focus on the MLS House Price Index (HPI), a much more stable measure that accounts for differences in house type and size, which with October’s decline stands (only) 10% below February 2022’s level (when the Bank of Canada started hiking) and remains 37% above pre-pandemic levels, with variations across cities (chart 2). Chart 2 is a good reminder that things vary quite significantly across cities. In Calgary for example, prices continued to climb after the Bank of Canada started hiking, and after three months of small declines, prices started climbing again and are now above their February 2022 level. This shows up in chart 3, which plots October’s prices relative to each city’s peak (horizontal axis) against each city’s peak relative to pre-pandemic prices (vertical axis)—and we can see Calgary’s October’s price is at peak level. Notwithstanding, chart 3 is intended to show that cities where prices have risen more during the pandemic and low-rates driven rally are also experiencing bigger price adjustments down from peaks.
DISCLAIMER
This report has been prepared by Scotiabank Economics as a resource for the clients of Scotiabank. Opinions, estimates and projections contained herein are our own as of the date hereof and are subject to change without notice. The information and opinions contained herein have been compiled or arrived at from sources believed reliable but no representation or warranty, express or implied, is made as to their accuracy or completeness. Neither Scotiabank nor any of its officers, directors, partners, employees or affiliates accepts any liability whatsoever for any direct or consequential loss arising from any use of this report or its contents.
These reports are provided to you for informational purposes only. This report is not, and is not constructed as, an offer to sell or solicitation of any offer to buy any financial instrument, nor shall this report be construed as an opinion as to whether you should enter into any swap or trading strategy involving a swap or any other transaction. The information contained in this report is not intended to be, and does not constitute, a recommendation of a swap or trading strategy involving a swap within the meaning of U.S. Commodity Futures Trading Commission Regulation 23.434 and Appendix A thereto. This material is not intended to be individually tailored to your needs or characteristics and should not be viewed as a “call to action” or suggestion that you enter into a swap or trading strategy involving a swap or any other transaction. Scotiabank may engage in transactions in a manner inconsistent with the views discussed this report and may have positions, or be in the process of acquiring or disposing of positions, referred to in this report.
Scotiabank, its affiliates and any of their respective officers, directors and employees may from time to time take positions in currencies, act as managers, co-managers or underwriters of a public offering or act as principals or agents, deal in, own or act as market makers or advisors, brokers or commercial and/or investment bankers in relation to securities or related derivatives. As a result of these actions, Scotiabank may receive remuneration. All Scotiabank products and services are subject to the terms of applicable agreements and local regulations. Officers, directors and employees of Scotiabank and its affiliates may serve as directors of corporations.
Any securities discussed in this report may not be suitable for all investors. Scotiabank recommends that investors independently evaluate any issuer and security discussed in this report, and consult with any advisors they deem necessary prior to making any investment.
This report and all information, opinions and conclusions contained in it are protected by copyright. This information may not be reproduced without the prior express written consent of Scotiabank.
™ Trademark of The Bank of Nova Scotia. Used under license, where applicable.
Scotiabank, together with “Global Banking and Markets”, is a marketing name for the global corporate and investment banking and capital markets businesses of The Bank of Nova Scotia and certain of its affiliates in the countries where they operate, including; Scotiabank Europe plc; Scotiabank (Ireland) Designated Activity Company; Scotiabank Inverlat S.A., Institución de Banca Múltiple, Grupo Financiero Scotiabank Inverlat, Scotia Inverlat Casa de Bolsa, S.A. de C.V., Grupo Financiero Scotiabank Inverlat, Scotia Inverlat Derivados S.A. de C.V. – all members of the Scotiabank group and authorized users of the Scotiabank mark. The Bank of Nova Scotia is incorporated in Canada with limited liability and is authorised and regulated by the Office of the Superintendent of Financial Institutions Canada. The Bank of Nova Scotia is authorized by the UK Prudential Regulation Authority and is subject to regulation by the UK Financial Conduct Authority and limited regulation by the UK Prudential Regulation Authority. Details about the extent of The Bank of Nova Scotia's regulation by the UK Prudential Regulation Authority are available from us on request. Scotiabank Europe plc is authorized by the UK Prudential Regulation Authority and regulated by the UK Financial Conduct Authority and the UK Prudential Regulation Authority.
Scotiabank Inverlat, S.A., Scotia Inverlat Casa de Bolsa, S.A. de C.V, Grupo Financiero Scotiabank Inverlat, and Scotia Inverlat Derivados, S.A. de C.V., are each authorized and regulated by the Mexican financial authorities.
Not all products and services are offered in all jurisdictions. Services described are available in jurisdictions where permitted by law.