CANADA HOUSING MARKET: THE FALL’S RISE
SUMMARY
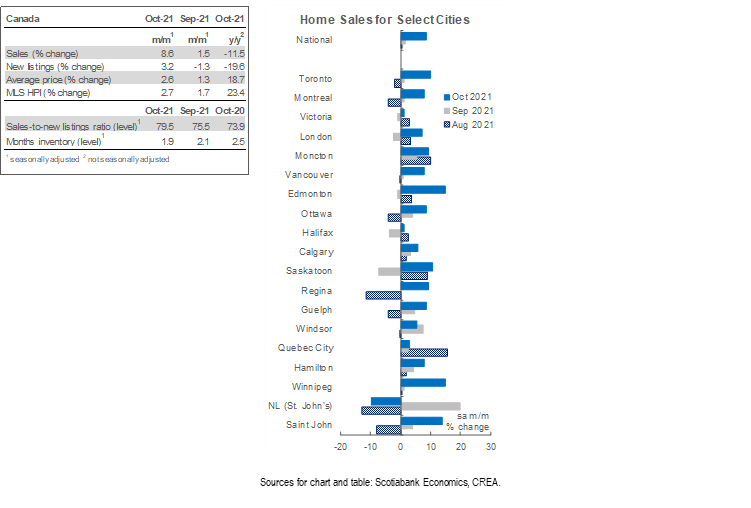
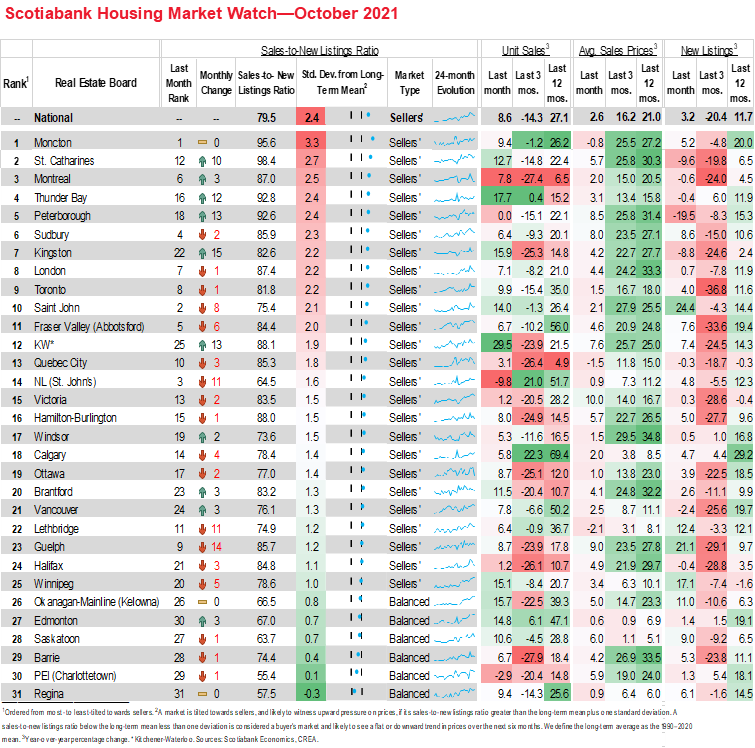
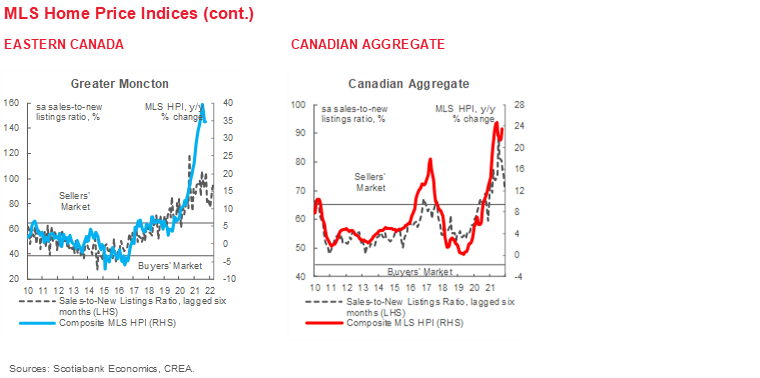
Canadian home sales rose by 8.6% (sa m/m) in October, the largest increase since July 2020. Listings moved in the same direction, albeit by a much smaller 3.2% (sa m/m). The larger increase in sales carried the sales-to-new listings ratio, an indicator of how tight the market is, to 79.5%, up from 75.5% in September, and much higher than its long-term average of 54.5%. As a result, the composite MLS Home Price Index (HPI) rose by 2.7% (sa m/m)—the third consecutive acceleration, and the biggest, after months of price gains deceleration. Single-family homes and apartments were the main drivers of October’s price gain.
Movements in the market were broad-based, with the uptick in sales spread out across much of the country. Sales went up in 28 of 31 local markets we track. Kitchener-Waterloo recorded the largest increase (29.5% sa m/m) followed by Thunder Bay, Kingston, Okanagan-Mainline, and Winnipeg—all recording increases of over 15% (sa m/m). While these are mainly suburban secondary markets, primary markets are also showing signs of strength, with Toronto’s sales going up by 9.9% (sa m/m) and Montreal’s and Vancouver’s by 7.8% (sa m/m). October’s national level of sales is historically strong—the second highest on record for October after October 2020, and a remarkable 40% (sa) higher than the 2000–2019 October-average.
The increase in listings was also broad-based but lagging sales in magnitude and adding to the market’s tightness. Of our 31 markets, listings went up in 23, of which 21 saw an increase in sales, a sign of supply being absorbed as it hits the market. The resulting increase in the sales-to-new listings ratio pushes 25 of our local centres into sellers’ market territory, up from 22 in September. Months of inventory continued to decline, falling to 1.9 months in October—nearing 1.8 months, their lowest level on record that was reached in March 2021, far below their long-term average of 5 months. Months of inventory were at record lows in Ontario, Quebec, and New Brunswick.
All home types contributed to this month’s price gains, with single family-homes and apartments leading the way. The MLS HPI for the two segments increased by 2.7% (sa m/m). Zooming in on two-storey homes within the single-family segment, the MLS HPI gain goes up to 3.1% (sa m/m). While this is higher than the increase in apartments, the latter registered the biggest price-gain acceleration. The 2.7% MLS HPI increase for this segment is almost double September’s 1.4% (sa m/m) number and is the steepest monthly increase since March 2017 (2.9% sa m/m). This continues to signal a concentration of demand at the two opposing ends of the market; a preference for larger units that are relatively scarce and, therefore, more competitive, which drives their prices up, and apartments that are now the only viable options for those priced out of larger units and seeing an uptick in demand. On the whole, the growth in composite MLS HPI for all homes in Canada was 23.4% (nsa y/y) in October 2021 compared to the same month last year—higher than September’s year-over-year increase, but still below the largest year-over-year increase on record in June of 24.7% (nsa y/y).
IMPLICATIONS
Home sales increased in October, in line with expectations of a fall pick-up in activity after the summer slowdown. This slowdown is a regular feature of the Canadian summer housing market which was exacerbated by a larger-than-usual summer exodus—as people shifted their focus to enjoy a double-vaccinated, travel-permitted summer—and in turn a larger-than-usual fall return.
The increase was buoyed by improved labour market conditions, strong immigration, and investor demand—the latter at least partly fueled by the return of in-class learning and international students who account for a large proportion of rental demand. Data from Equifax shows the number of people with more than 4 mortgages in the second quarter of this year was 7.7% higher than last year, and HELOC (home equity lines of credit) volumes were 57% higher—both are signs of investor activity. This has likely continued into October, supported by movements in the rental market—a report by Rentals.ca shows that average rent in October 2021 was 1.6% higher than in October 2020, 1.8% higher than in September 2021, and 7% higher than the record lows in April 2021. Immigration numbers lag a month, so we don’t yet have October data, but September data came in line with our assertion last month that September’s increase in home sales was partly driven by the government doubling down on its efforts to meet its immigration target for the year. Canada welcomed a record 45,050 new immigrants in September, the highest in Canada’s modern history and indicative of the acceleration in admissions—the September number brought forward the government’s progress toward its target of 401,000 new immigrants in 2021 to 67%, up from 55% in August.
It is unclear whether the increase in sales in October was held back by the increase in fixed mortgage rates, which are closely tied to government bond yields—the latter have been on the rise since the Bank of Canada turned more hawkish in the face of rising inflationary pressures proving more persistent than previously expected. Canada 5-year government bond yields, a benchmark for fixed mortgage rates, increased by over 40 bps in October, which translated to an average 51 bps increase in 5-year fixed mortgage rates at some of the big banks and key mortgage lenders between October 1 and November 11, according to data from Canadian Mortgage Trends. But a shift to variable-rate mortgages over the past year may be limiting the impact of these higher rates on borrowing, evident through this month’s acceleration in home sales. The share of new variable-rate mortgages reached a record 54% in August 2021, double what it was last year.
Variable rates today are lower since they are tied to the Bank of Canada’s policy rate, which remains at its effective lower bound, unlike fixed rates that are tied to government bond yields. When bond yields go up, while the Bank of Canada holds its policy rate steady, the spread between the two rates increases. This higher spread partly explains the shift to these variable-rate mortgages. This spread is set to decrease, however, with the Bank of Canada signalling it might raise its policy rate as early as April next year—we currently have the Bank raising its rate by a total of 100 bps in 2022, and another 100 bps in 2023. With an increasing share of today’s home buyers taking out variable-rate mortgages and HELOCs (which also have variable rates), policy makers and market participants will be monitoring these rate hikes closely.
Due to the speculative and elastic nature of investor activity, a larger share of investors in the buyers’ pool means demand might be more sensitive to expectations of higher borrowing costs and lower profitability. While much of the buying frenzy in 2020 was driven by first-time home buyers and buyers who planned to live in their homes, the story seems to have changed in 2021. Data for Ontario from Teranet shows the largest segment of buyers is now multiple property owners, reaching 25% in August—a new record. This may result in a disproportionate fall in demand in response to rate increases. We will be looking to the data over the next year to see whether this fall in investor demand materializes, which would alleviate some of the current pressure on the housing market.
Some might also argue that the impact on borrowing from rising rates is being offset by the expectation of higher rates in the future, leading buyers to rush to lock in lower rates today. We indeed have anecdotal evidence of a surge in requests for mortgage-approvals, which lock in current approval rates for up to 130 days. Home buyers thinking of entering the market today are better off basing their decision on long-term affordability planning rather than short-term focus of locking in lower rates today. That is because in today’s inflated price environment, small rate hikes translate into relatively large increases in interest payments over the term of the mortgage.
With all this playing out on the demand side, listings continued to lag sales. After falling in September when sales had increased, an increase in listings in October was only a third as high as the rise in sales, far from what’s needed for a proper catch-up. This has added to the market tightness and pushed prices up further. The chronically lagging supply demands more attention and action from policy makers, who so far have focused their efforts on making promises to increase demand-side affordability, which only adds to demand pressures rather than materially solving the supply issue. Much of the solution lies in a collaborative, multi-stakeholder process to comprehensively identify and tackle the obstacles to more responsive supply in all segments of the housing market and at all levels of government.
DISCLAIMER
This report has been prepared by Scotiabank Economics as a resource for the clients of Scotiabank. Opinions, estimates and projections contained herein are our own as of the date hereof and are subject to change without notice. The information and opinions contained herein have been compiled or arrived at from sources believed reliable but no representation or warranty, express or implied, is made as to their accuracy or completeness. Neither Scotiabank nor any of its officers, directors, partners, employees or affiliates accepts any liability whatsoever for any direct or consequential loss arising from any use of this report or its contents.
These reports are provided to you for informational purposes only. This report is not, and is not constructed as, an offer to sell or solicitation of any offer to buy any financial instrument, nor shall this report be construed as an opinion as to whether you should enter into any swap or trading strategy involving a swap or any other transaction. The information contained in this report is not intended to be, and does not constitute, a recommendation of a swap or trading strategy involving a swap within the meaning of U.S. Commodity Futures Trading Commission Regulation 23.434 and Appendix A thereto. This material is not intended to be individually tailored to your needs or characteristics and should not be viewed as a “call to action” or suggestion that you enter into a swap or trading strategy involving a swap or any other transaction. Scotiabank may engage in transactions in a manner inconsistent with the views discussed this report and may have positions, or be in the process of acquiring or disposing of positions, referred to in this report.
Scotiabank, its affiliates and any of their respective officers, directors and employees may from time to time take positions in currencies, act as managers, co-managers or underwriters of a public offering or act as principals or agents, deal in, own or act as market makers or advisors, brokers or commercial and/or investment bankers in relation to securities or related derivatives. As a result of these actions, Scotiabank may receive remuneration. All Scotiabank products and services are subject to the terms of applicable agreements and local regulations. Officers, directors and employees of Scotiabank and its affiliates may serve as directors of corporations.
Any securities discussed in this report may not be suitable for all investors. Scotiabank recommends that investors independently evaluate any issuer and security discussed in this report, and consult with any advisors they deem necessary prior to making any investment.
This report and all information, opinions and conclusions contained in it are protected by copyright. This information may not be reproduced without the prior express written consent of Scotiabank.
™ Trademark of The Bank of Nova Scotia. Used under license, where applicable.
Scotiabank, together with “Global Banking and Markets”, is a marketing name for the global corporate and investment banking and capital markets businesses of The Bank of Nova Scotia and certain of its affiliates in the countries where they operate, including; Scotiabank Europe plc; Scotiabank (Ireland) Designated Activity Company; Scotiabank Inverlat S.A., Institución de Banca Múltiple, Grupo Financiero Scotiabank Inverlat, Scotia Inverlat Casa de Bolsa, S.A. de C.V., Grupo Financiero Scotiabank Inverlat, Scotia Inverlat Derivados S.A. de C.V. – all members of the Scotiabank group and authorized users of the Scotiabank mark. The Bank of Nova Scotia is incorporated in Canada with limited liability and is authorised and regulated by the Office of the Superintendent of Financial Institutions Canada. The Bank of Nova Scotia is authorized by the UK Prudential Regulation Authority and is subject to regulation by the UK Financial Conduct Authority and limited regulation by the UK Prudential Regulation Authority. Details about the extent of The Bank of Nova Scotia's regulation by the UK Prudential Regulation Authority are available from us on request. Scotiabank Europe plc is authorized by the UK Prudential Regulation Authority and regulated by the UK Financial Conduct Authority and the UK Prudential Regulation Authority.
Scotiabank Inverlat, S.A., Scotia Inverlat Casa de Bolsa, S.A. de C.V, Grupo Financiero Scotiabank Inverlat, and Scotia Inverlat Derivados, S.A. de C.V., are each authorized and regulated by the Mexican financial authorities.
Not all products and services are offered in all jurisdictions. Services described are available in jurisdictions where permitted by law.