CANADA HOUSING MARKET: UPWARD AND UPWARD
SUMMARY
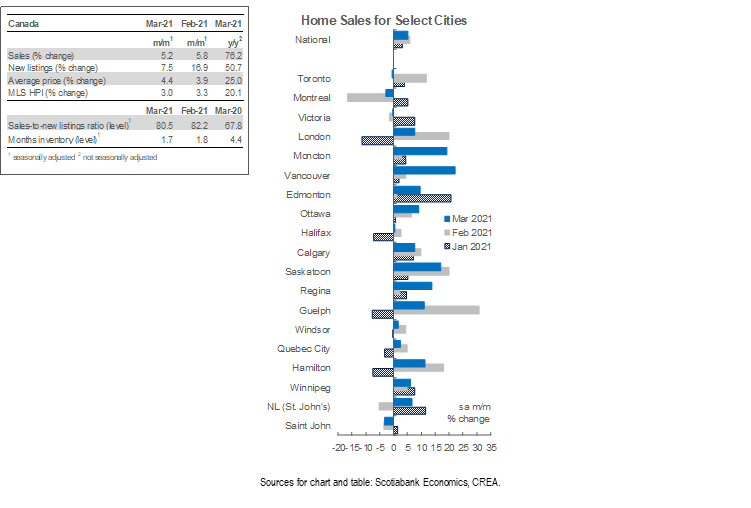
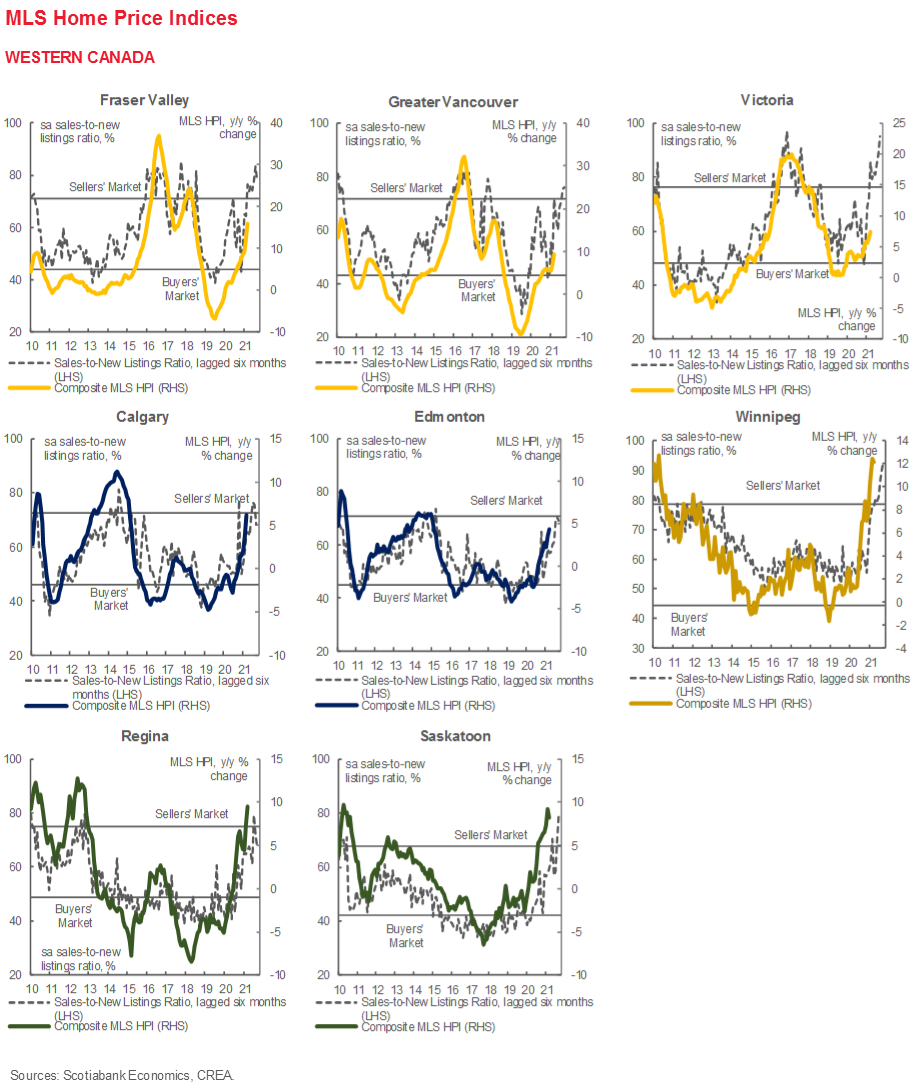
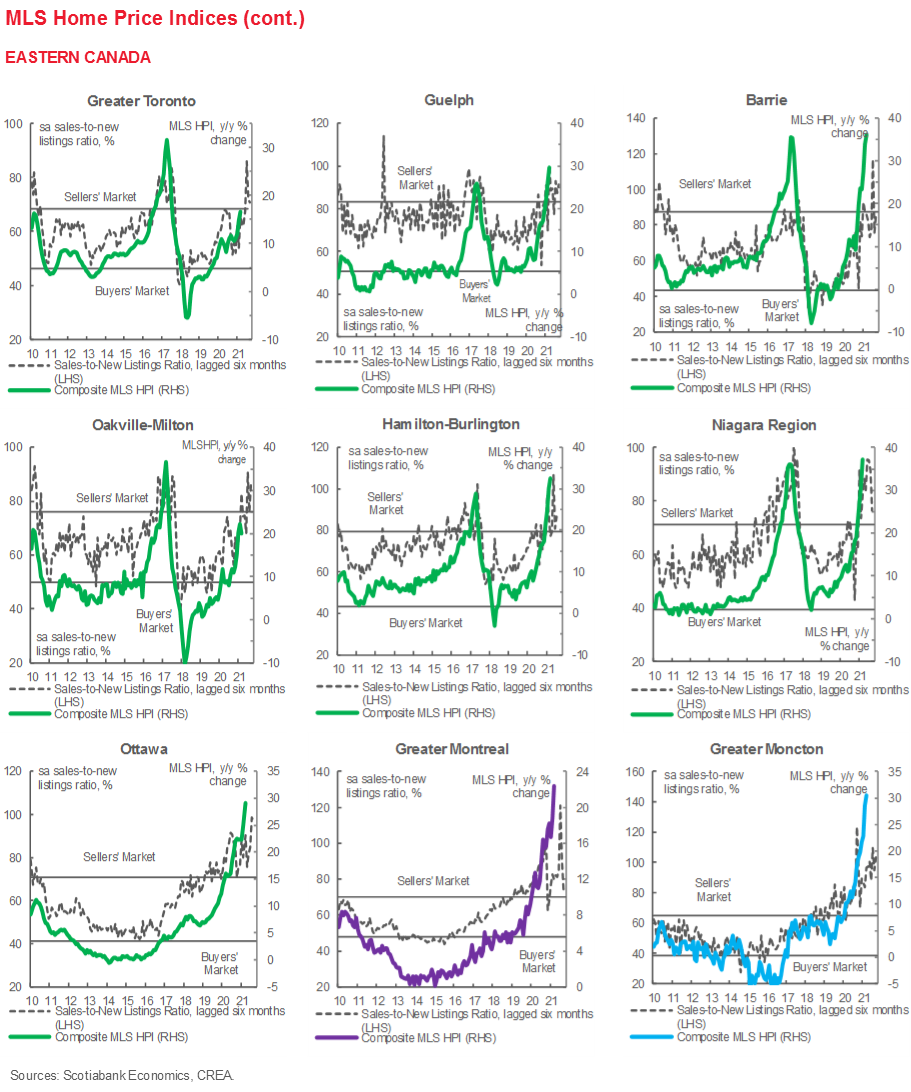
Canadian home sales continued to set records in March, rising by 5.2% (sa m/m). Listings rose by an even more rapid 7.5% (sa m/m). The level of residential property sales in March 2021 was the highest ever on record. On the other hand, listings went up for the second consecutive month this year, bringing about a 25% increase in supply over the months of February and March. This increase in homes for sale drops the national-level sales-to-new listings to 80.5% from the record readings of 91% and 84% in January and February. While this signals a welcome improvement in market conditions, the ratio is still significantly higher than its long-term average and remains firmly in sellers’ market territory. As a result of this tightness in the housing market, the composite MLS Home Price Index (HPI) rose 3% (sa m/m). Single-family homes continue to be the main driver of this price appreciation. Apartment and townhouse prices, which had remained relatively close to pre-pandemic levels up until January of this year, are accelerating.
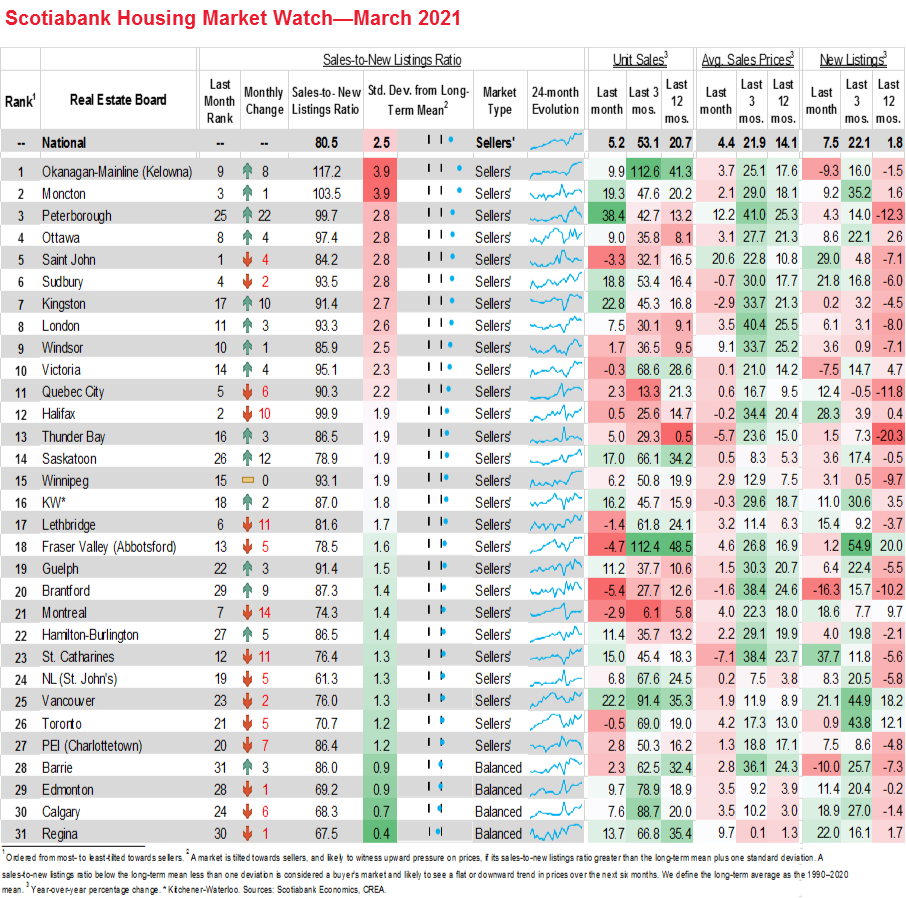
Sales gains continued to be spread out across much of the country in March and relative to a year ago, particularly as buyers rush to absorb the new supply in different regions. Of the 31 local markets we monitor, 24 witnessed sales gains this month compared to last, with Peterborough recording a whopping 38.4% (sa m/m) increase followed by Kingston and Vancouver at around 22.6%. Compared to March of last year, all the 31 markets we monitor witnessed gains, with national sales increasing by 76.2% (nsa y/y). While the housing market has been indisputably strong, it is important to keep in mind that comparing this month’s results to the same month last year generates inflated growth rates due to the significant drop in sales activity in the second half of March 2020. If we were able to observe daily activity, we could split the months into pre-COVID period and COVID period and compare sales activity for each period separately. It is safe to assume that the uptick in March 2021 sales activity compared to March 2020 would be more modest in the pre-COVID period than in COVID period. Luckily, the Toronto Regional Real Estate Board (TRREB) does have access to this information and provides an example of this COVID-onset impact on this month’s numbers. In the first 14 days of March 2021, sales were up 41 % from the same period in March 2020 (pre-COVID), compared to an increase of 174 % in the COVID period.
Listings continued to increase this month as we had expected, while months of inventory continued to fall to a new record low. New listings increased in 27 of the 31 centres in our list this month. The bigger gain in listings compared to sales in March relaxed the sales-to-new listings ratio to its 4th highest level on record (80.5%), and while that’s better than its 1st and 2nd highest levels witnessed in January and February this year, it is significantly higher than its long-term average at 54.4%. Following this drop, 27 of our centres (down from 29 last month) are in sellers’ market territory, with the remaining 4 markets being balanced. Despite subtle signs of loosening in supply-demand conditions, months of inventory continue to trend downward—at the current rate of sales activity, national inventories would be liquidated in 1.7 months—the fastest rate on record. Months of inventory were the lowest on record in four provinces, with Ontario having less than a month of inventory.
Single-family homes continued to drive growth in housing prices. With a 20.1% (nsa y/y) increase in the composite MLS HPI for all homes in Canada (again, keeping in mind the impact of the COVID-onset in March 2020), single-family homes recorded a 25.4% (nsa y/y) increase, followed by an increase of 18.1% (nsa y/y) in the townhouse market. While this considerably outpaces the apartment market which saw an increase of 7.9% (nsa y/y), this market is starting to show signs of increased price vigour. March saw an uptick of 2% (sa m/m) in the MLS HPI for apartments, the highest since May 2017.
IMPLICATIONS
By now it’s no longer surprising news that the housing market in Canada continues to break records month after month during a global pandemic—fueled by low interest rates (and the promise of keeping them low for a while), job growth, accumulated savings, and low supply of housing. With the sales-to-new-listings ratio still far above its long-term average, we are likely to continue to see further price gains in the months ahead. Certainly, as immigration begins to pick up once global border restrictions are lifted, demand for housing will only increase. While much is being said about whether government intervention is needed in the market and, if so, what kind of intervention, all agree that the most viable long-term solution is an increase in supply, which suffers mostly from blockages at the municipal level due to outdated zoning laws. Last month for instance, the TRREB estimated that changing zoning laws may result in as many as 400,000 additional units of housing.
The preference for more space resulting from the pandemic’s impact on living and working conditions persists—with more spacious homes driving much of the increase in the composite MLS HPI. However, we are beginning to see signs that homebuyers are turning to smaller units, a result of either being priced out of the single-family home market, or speculative activity in the condo space. We can see this by looking at data released by the TRREB earlier this month. The GTA saw an increase of 21.6% (y/y) in average selling price. Looking at detached homes only, this number goes up to 26.6% (y/y), and zooming in further on these homes in the suburban areas surrounding the City of Toronto, it reaches 31.3% (y/y). On the other hand, the average selling price of condos in the GTA was up 5.2% (m/m) this month, surpassing detached homes in which were up only 2.3% (m/m) compared to last month. A report released by the Bank of Canada earlier this month also shows that in major cities (Toronto, Vancouver, Montreal and Ottawa), prices increased more rapidly the further one moved from the city centre. Sticking to Toronto, the report shows that at 9km away from city centre, prices went up by 6.3% (y/y) in Q4-2020, whereas at 64 km away from the centre, they went up by 19.8%.
Incoming data continue to point to very robust GDP growth and employment that reached 98.5% of its pre-COVID levels in March. This means we are well on our way to full employment and a closing output gap by the end of this year. We are likely to revise our growth forecasts upward, despite the lockdowns put in place this in April 2021. While these lockdowns will certainly soften growth in Q2 of this year, it follows a stronger than expected Q1 and is likely to end on a strong note as vaccine rollouts continue and restrictions ease in tandem with improved weather conditions (not to mention the US fiscal stimulus and its imported benefits to the Canadian economy). Therefore, even as the risk of the third wave and virus variants materialize this month, strength in the economy will continue to support housing demand, but also bring sellers off the sidelines and facilitate more housing starts, which will hopefully continue to ease the supply-demand tightness as we have seen in the last two months. At the same time, these projections of an earlier full recovery than anticipated by the Bank of Canada indicate a possibility of an earlier rate hike than they have previously announced. We continue to expect further tapering of the Bank of Canada’s quantitative easing program in the months ahead, and expect a rate hike by Q4-2022. With fixed mortgage rates already ticking up given the steepening of yield curves resulting from improved growth prospects—and OSFI’s announcement on resuming consultations to raise the minimum-qualifying rate on uninsured mortgages (possibly by June)—we might see an influx of buyers into the spring housing market rushing to lock in a lower rate and to qualify for a mortgage.
DISCLAIMER
This report has been prepared by Scotiabank Economics as a resource for the clients of Scotiabank. Opinions, estimates and projections contained herein are our own as of the date hereof and are subject to change without notice. The information and opinions contained herein have been compiled or arrived at from sources believed reliable but no representation or warranty, express or implied, is made as to their accuracy or completeness. Neither Scotiabank nor any of its officers, directors, partners, employees or affiliates accepts any liability whatsoever for any direct or consequential loss arising from any use of this report or its contents.
These reports are provided to you for informational purposes only. This report is not, and is not constructed as, an offer to sell or solicitation of any offer to buy any financial instrument, nor shall this report be construed as an opinion as to whether you should enter into any swap or trading strategy involving a swap or any other transaction. The information contained in this report is not intended to be, and does not constitute, a recommendation of a swap or trading strategy involving a swap within the meaning of U.S. Commodity Futures Trading Commission Regulation 23.434 and Appendix A thereto. This material is not intended to be individually tailored to your needs or characteristics and should not be viewed as a “call to action” or suggestion that you enter into a swap or trading strategy involving a swap or any other transaction. Scotiabank may engage in transactions in a manner inconsistent with the views discussed this report and may have positions, or be in the process of acquiring or disposing of positions, referred to in this report.
Scotiabank, its affiliates and any of their respective officers, directors and employees may from time to time take positions in currencies, act as managers, co-managers or underwriters of a public offering or act as principals or agents, deal in, own or act as market makers or advisors, brokers or commercial and/or investment bankers in relation to securities or related derivatives. As a result of these actions, Scotiabank may receive remuneration. All Scotiabank products and services are subject to the terms of applicable agreements and local regulations. Officers, directors and employees of Scotiabank and its affiliates may serve as directors of corporations.
Any securities discussed in this report may not be suitable for all investors. Scotiabank recommends that investors independently evaluate any issuer and security discussed in this report, and consult with any advisors they deem necessary prior to making any investment.
This report and all information, opinions and conclusions contained in it are protected by copyright. This information may not be reproduced without the prior express written consent of Scotiabank.
™ Trademark of The Bank of Nova Scotia. Used under license, where applicable.
Scotiabank, together with “Global Banking and Markets”, is a marketing name for the global corporate and investment banking and capital markets businesses of The Bank of Nova Scotia and certain of its affiliates in the countries where they operate, including; Scotiabank Europe plc; Scotiabank (Ireland) Designated Activity Company; Scotiabank Inverlat S.A., Institución de Banca Múltiple, Grupo Financiero Scotiabank Inverlat, Scotia Inverlat Casa de Bolsa, S.A. de C.V., Grupo Financiero Scotiabank Inverlat, Scotia Inverlat Derivados S.A. de C.V. – all members of the Scotiabank group and authorized users of the Scotiabank mark. The Bank of Nova Scotia is incorporated in Canada with limited liability and is authorised and regulated by the Office of the Superintendent of Financial Institutions Canada. The Bank of Nova Scotia is authorized by the UK Prudential Regulation Authority and is subject to regulation by the UK Financial Conduct Authority and limited regulation by the UK Prudential Regulation Authority. Details about the extent of The Bank of Nova Scotia's regulation by the UK Prudential Regulation Authority are available from us on request. Scotiabank Europe plc is authorized by the UK Prudential Regulation Authority and regulated by the UK Financial Conduct Authority and the UK Prudential Regulation Authority.
Scotiabank Inverlat, S.A., Scotia Inverlat Casa de Bolsa, S.A. de C.V, Grupo Financiero Scotiabank Inverlat, and Scotia Inverlat Derivados, S.A. de C.V., are each authorized and regulated by the Mexican financial authorities.
Not all products and services are offered in all jurisdictions. Services described are available in jurisdictions where permitted by law.