Next Week's Risk Dashboard
- US government headed for 11th shutdown in four decades
- US nonfarm payrolls could be a shutdown casualty
- Canadian jobs and wages to further inform inflation pressures
- China PMIs could impact Monday’s market open
- Peru’s central bank expected to cut again
- RBA, RBI, RBNZ all likely to hold
- CPI: Chile, Colombia, Peru, Switzerland, Australia, Indonesia, Philippines, SK, Taiwan, Thailand
Chart of the Week
Business as usual for China’s government will still result in the release of a key macroeconomic report to kick off the week while the US demonstrates to the world how not to run a government. How to further jeopardize its credit rating. How not to jeopardize the availability of key information at a sensitive point for the Federal Reserve. How not to place disproportionate power into the hands of an unruly and implacable handful of individuals and their de facto leaders.
Key developments over the coming week that we can say with certainty will still unfold will be the release of China’s PMIs and how they may impact the market tone on Monday, plus Canada’s updates on jobs and wages on Friday, and a wave of global inflation readings in between.
What could dominate the importance of these developments would be key US macroeconomic reports, particularly nonfarm payrolls and wages on Friday. They, among other reports that are scheduled for release over the week, may be postponed for an indeterminate length of time along with core government services.
Frankly, they should make a statute of David Beers and mount it on the steps of Congress. A government that ceases its operations an eleventh possible time in just over forty years—three times since 2018—is clearly experiencing generational dysfunction and polarization.
CANADIAN JOBS—RISING IMBALANCES
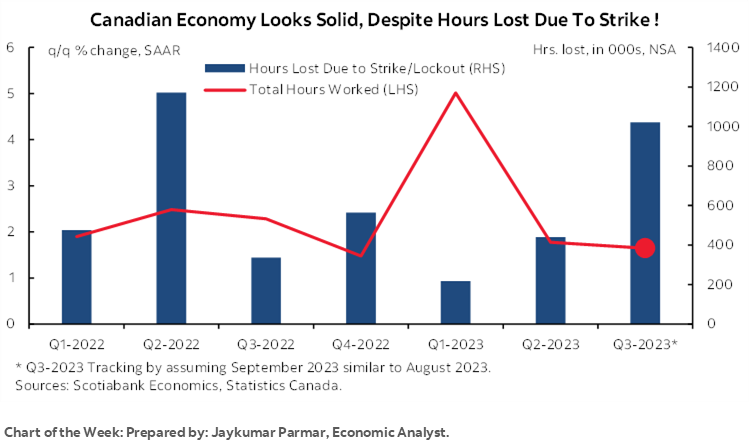
Canada will update jobs, wages and other labour market metrics for the month of September on Friday. The readings will further advance understanding of the risks on the path to the Bank of Canada’s posture on October 25th when it rolls a fresh decision plus new forecasts and analysis.
I’ve guesstimated a modest gain of 15,000 workers and a slightly higher unemployment rate.
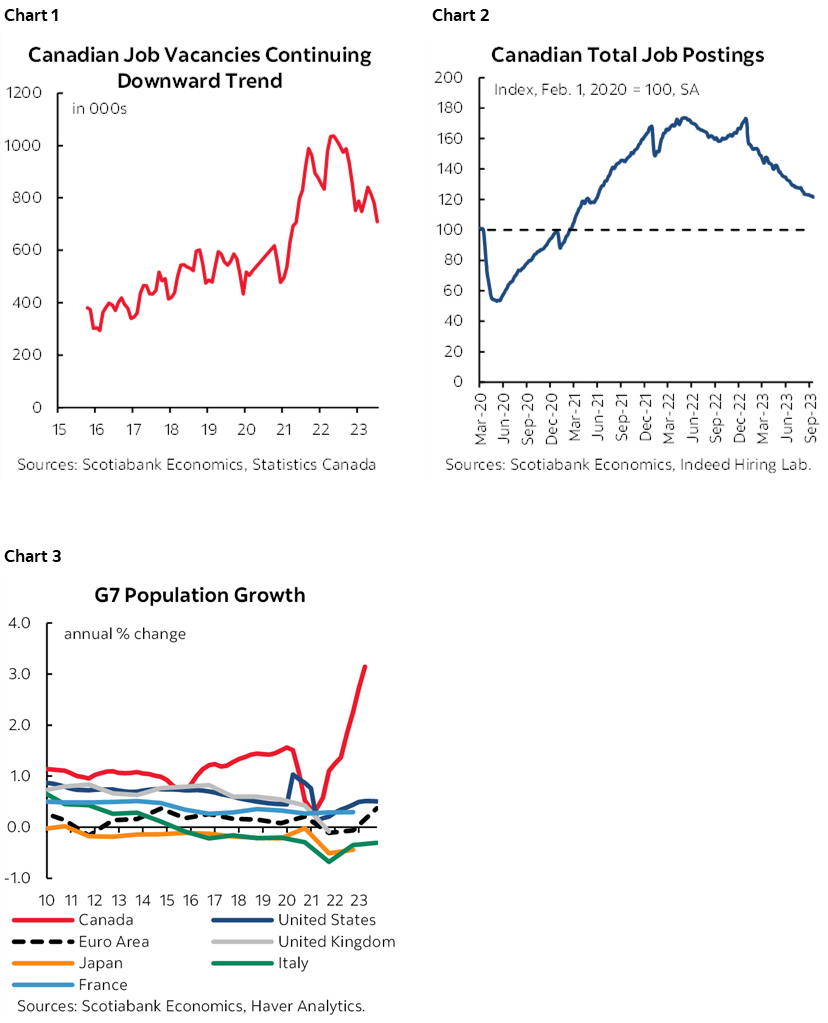
Still relatively elevated job vacancies (chart 1), diminishing but still high job postings (chart 2) and off-the-charts population growth (chart 3) as Canada continues to throw open its doors to new arrivals could make for another strong report after jobs rebounded in August.
What lessens confidence in this tally is how quirky the prior month’s report was. There was a large decline in educational services of 44k employees significantly due to the problems Statcan is having with controlling for shifting seasonality in teacher contracts. This effect might rebound as the school year started, but the 50k rise in self-employed jobs could go the other way and is often treated as relatively soft quality data. The effects of the BC port strike in July might continue to reverse if it wasn’t fully captured into the reference week of August 13th – 19th.
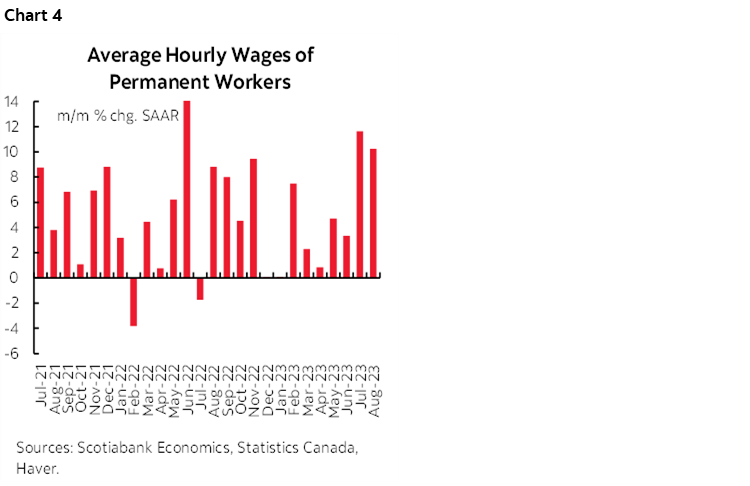
It may be tough to repeat the incredibly strong wage growth that we’ve seen over the prior couple of months (chart 4), although I said the same thing the last time and July’s strong double-digit gain in average hourly earnings on a month-over-month seasonally adjusted and annualized basis led to another similar gain in August.
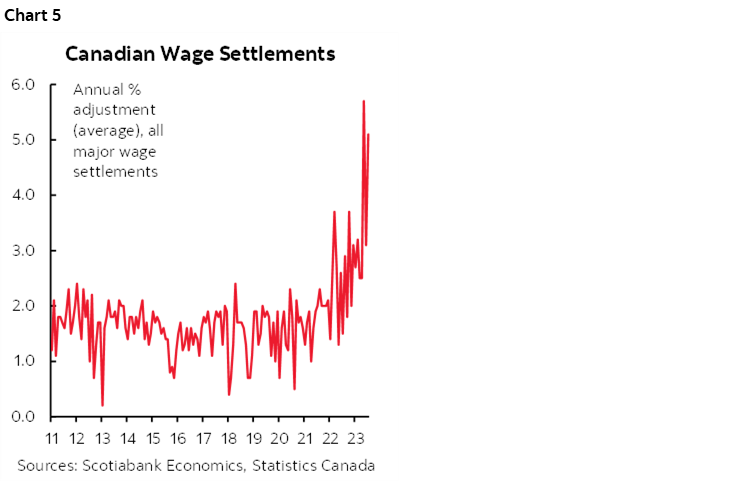
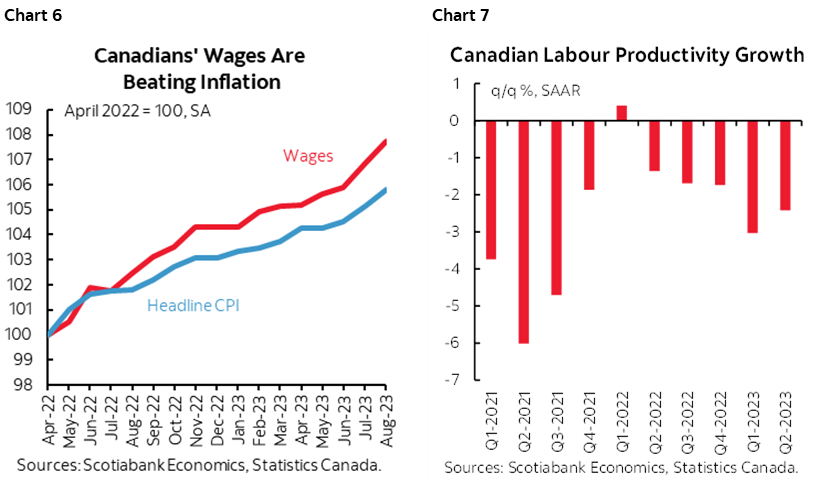
About one-in-three Canadian workers are unionized—triple the US rate—and collective bargaining exercises are driving very strong wage gains that are well above the BoC’s 2% inflation target (chart 5). This is a key distinction when it comes to considering BoC versus Fed dynamics. That’s not just true for the first year of the average 2–4 year contract periods in recent settlements; recent settlements have been establishing multi-year gains 2–3 times the BoC’s inflation target. This is a sign of changed behaviour by workers that are engaged in extrapolative behaviour, demanding wage increases well in excess of inflation.
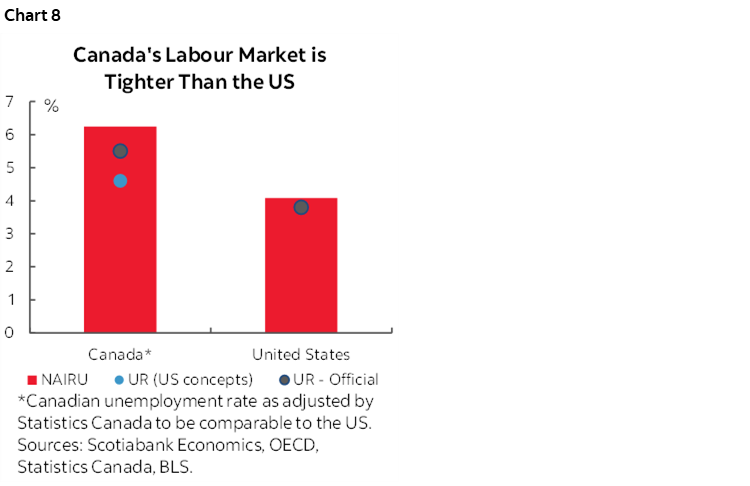
That has been the case throughout the past year (chart 6) despite tumbling worker productivity for which shared blame must be spread across governments, c-suites and workers (chart 7).
Such are perhaps the luxuries associated with an incredibly tight labour market. Canada’s job market is tighter than the US at least in terms of the unemployment rate compared to OECD estimates of Canada’s natural equilibrium rate of unemployment (chart 8).
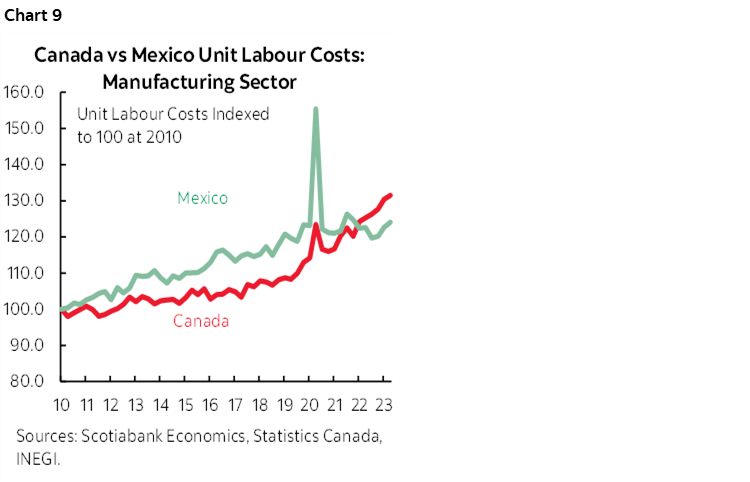
This combination of soaring wage gains and tumbling productivity is driving competitive imbalances. It is driving Canadian manufacturing unit labour costs (productivity-adjusted employment costs) to rise faster than in Mexico (chart 9).
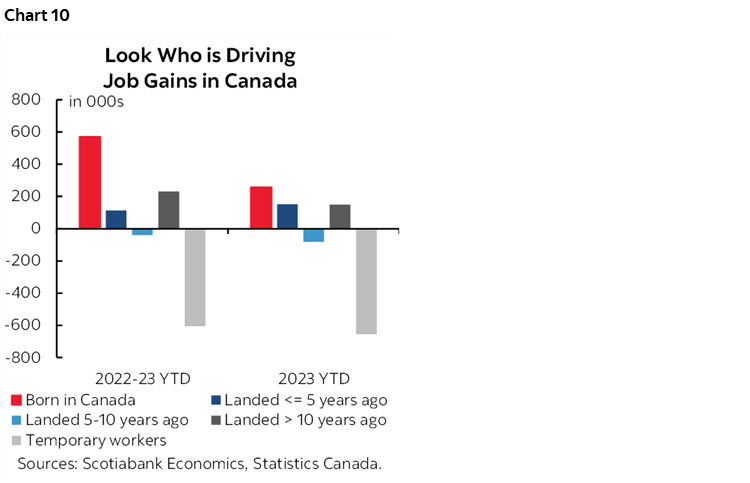
What is unlikely to drive wage disinflationary pressures as offsets to aggressive multi-year wage hikes net of tumbling productivity is immigration. The composition of the employment gains is subject to wide intervals of estimates, but generally points to how most of the job growth has gone to born-in-Canada and long-time permanent residents (chart 10). Relatively newer permanent residents have not participated in much of this. Canada has always been challenged with respect to successfully integrating new arrivals and has much work to do in order to get better at it. Further, recall the evidence from the US literature with a suite of studies generally concluding that the immigrant wage elasticity effect is near zero. Variations in immigration over the decades have had negligible effects upon wage growth net of other drivers.
US NONFARM—WE MIGHT NOT GET THEM!
A wave of employment releases over the coming week will culminate in Friday’s nonfarm payrolls and wages for the month of September. I’ve guesstimated a gain of 175k payroll positions and trend wage growth of about 0.3% m/m.
That is, of course, assuming that the numbers are released. As the US government probably shuts down this weekend, the length of shutdown and whether it extends to Friday and beyond could be highly disruptive to the flow of key US data reports. The Bureau of Labor Statistics would “completely cease operations” in a shutdown. Even post-shutdown, it would take some time for normal activities and the publication of key reports to resume. Whether that affects the FOMC’s next decision on November 1st or not depends critically upon how long a shutdown lasts.
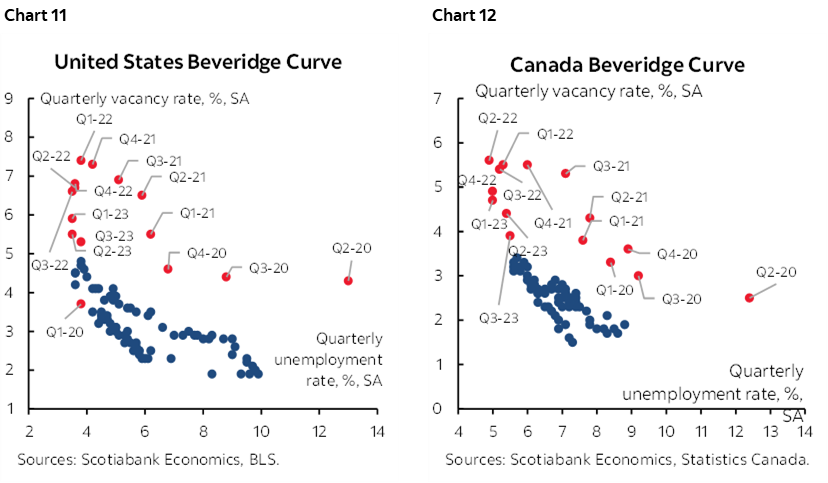
Both the US (chart 11) and Canada (chart 12) are making progress toward rebalancing labour markets. So far, however, it is very one-sided as the charts show that both countries have come down from the top left of the so-called Beveridge curves primarily through reduced job vacancies while the unemployment rates continue to signal tight job markets.
Still, those job openings remain high (chart 13). Weekly filings for employment insurance are very low (chart 14). Mass layoffs have normalized toward pre-pandemic levels compared to when nobody was getting laid off during the most powerful wave of post-pandemic recovery but remain low (chart 15).
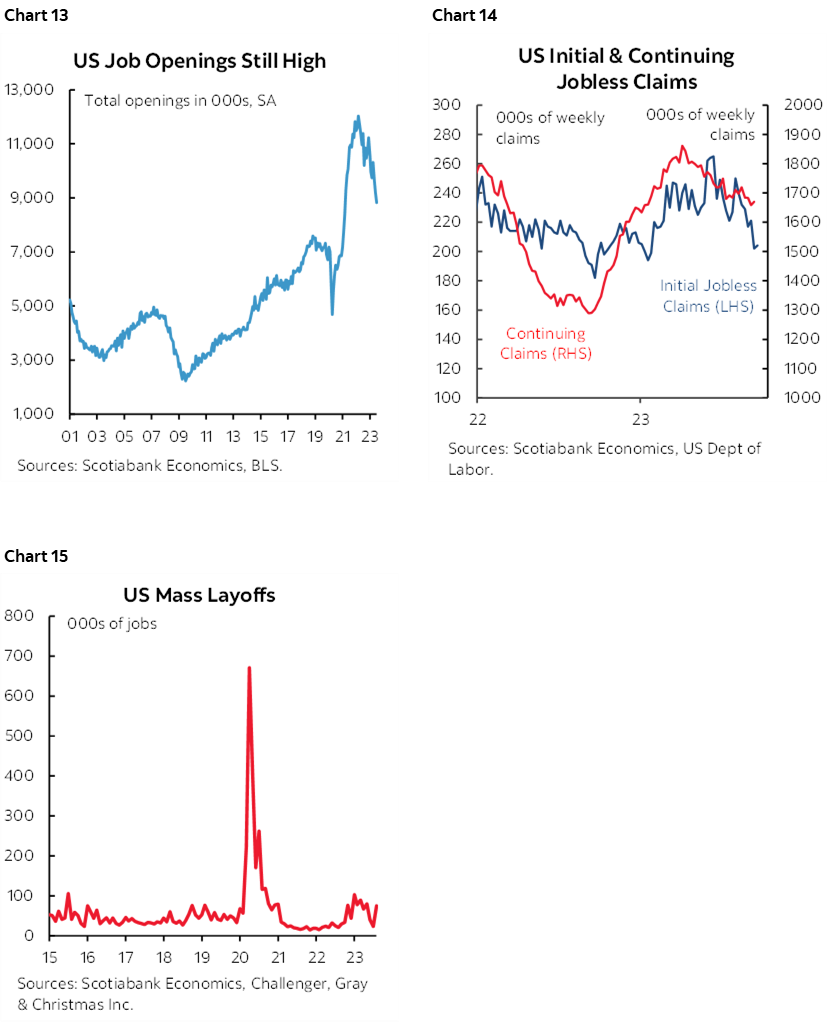
These are not the signs of a labour market in trouble. They continue to indicate buoyant activity in tight conditions.
CENTRAL BANKS—MOSTLY STUCK IN HOLDING PATTERNS
Four central banks will deliver policy decisions over the coming week. There are generally low odds that anything any of them will do could impact local, let alone global markets.
RBA—Hawkish Hold
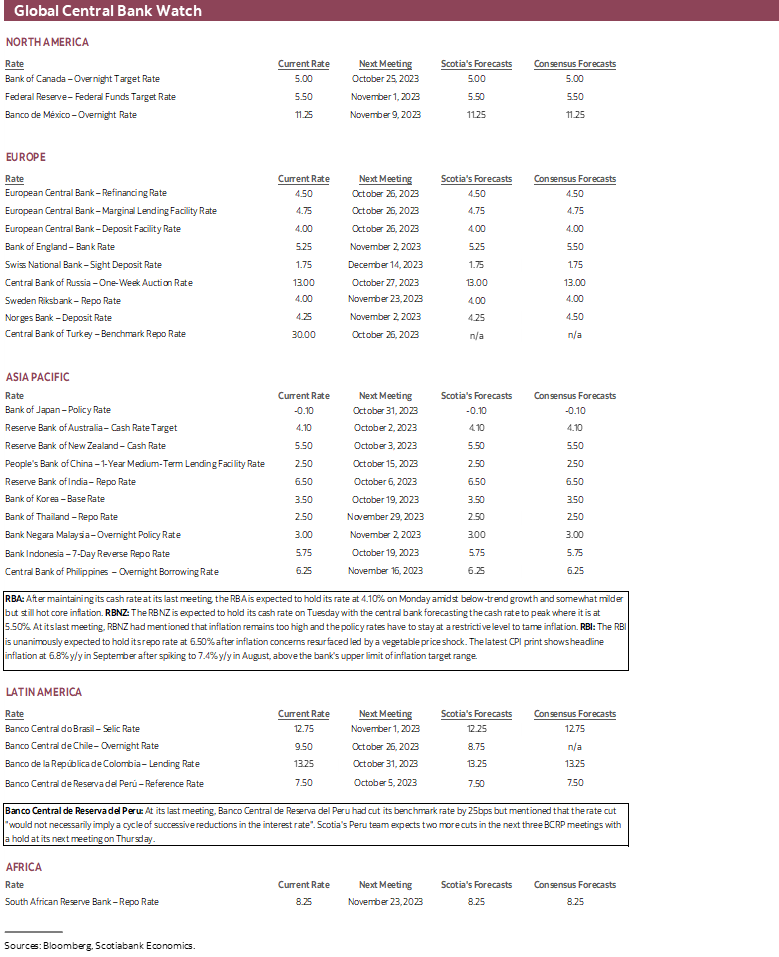
Australia’s central bank is widely expected to stay on hold at a cash rate target of 4.1% again on Tuesday night (ET). Consensus is close to unanimous and markets have nothing priced in for this decision. Since its last decision to stay on hold in early September, jobs jumped 65k higher but entirely due to part-time workers. CPI inflation increased to 5.2% y/y for the first up-tick since April, but mostly due to transportation and within that energy costs. Traditional core CPI ebbed to 5.5% while trimmed mean CPI was unchanged at 5.6%.
RBNZ—This One Could Get More Interesting
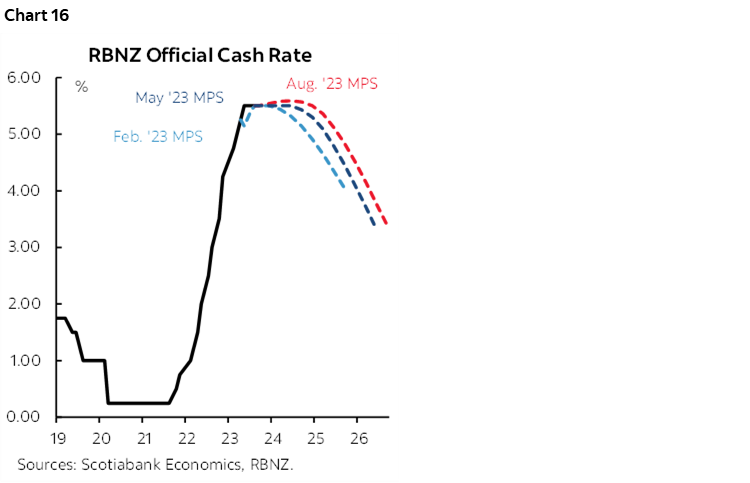
No policy rate change is expected on Wednesday. New Zealand’s central bank is unanimously expected to hold again at a target rate of 5.5%. Since its hold on August 15th, growth has surprised higher, coming in at about 3½% q/q SAAR. That followed two weak quarters. More important are likely to be the next releases for Q3 wage growth at the end of the month, and Q3 CPI on October 16th as they could influence the next decision on November 28th and whether to adjust its forward guidance at the next meeting (chart 16).
Banco Central de Reserva del Peru—It’s Looking Pretty Linear So Far
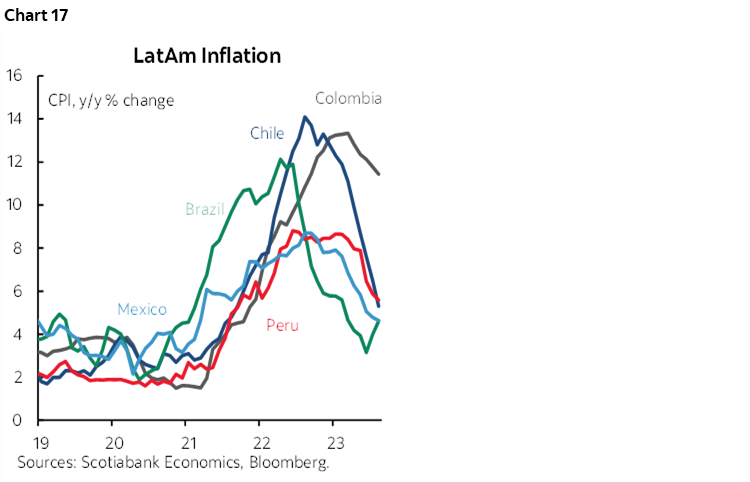
Peru’s central bank is widely expected to cut its reference rate by 25bps on Thursday. This would be the second reduction following September’s cut that itself followed a holding pattern since the last hike of the cycle was delivered back in January. At its September meeting, the BCP said that its cut “would not necessarily imply a cycle of successive reductions in the interest rate". Since then, a monthly indicator of economic activity that serves as a guide to GDP growth worsened in July to -1.3% y/y. This weekend’s CPI figures may further inform cut risk and guidance on the bias for the remaining two meetings this year. Peru has been witnessing among the fastest decelerations in inflationary pressures among its neighbours (chart 17).
RBI—Making Progress
India’s central bank is widely expected to stay on hold at a repurchase rate of 6.5% on Friday. Core inflation has continued to ebb to below 5% y/y. The central bank is likely to look through a recent spike in energy and vegetable prices.
GLOBAL MACRO—CHINA’S GOVERNMENT DOESN’T SHUT DOWN
First up by way of global macroeconomics indicators will be this weekend’s release of China’s purchasing managers’ indices for September. They could impact the Asian market open by informing markets about growth momentum in China’s economy in response to various stimulus measures.
A wave of CPI readings will emerge from a collection of mid-sized to smaller economies. Australia and Peru release into Sunday (ET), followed by Indonesia on Monday, Switzerland (Tuesday), South Korea, Thailand and the Philippines on Wednesday, Taiwan on Thursday and both Chile and Colombia on Friday.
Canada will update trade figures for August on Thursday that we’ll use to update quarterly GDP tracking.
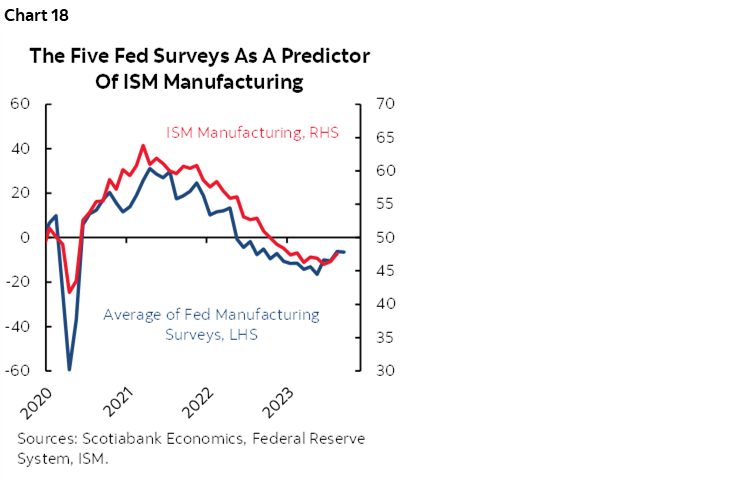
How much US data actually sees the light of day this week will depend in part on the likelihood of a lengthy government shutdown. Reuters assembled this handy list as a reference. Construction spending (Monday), JOLTS job openings (Tuesday), factory orders (Wednesday), weekly initial jobless claims (Thursday) and part of the vehicle sales tally (Tuesday) will all be held up by a shutdown. ISM-manufacturing (Monday) could further stabilize (chart 18) and then comes ISM-services (Wednesday) plus ADP private payrolls (Wednesday) and the Challenger mass layoffs tally (Thursday) all of which will be unaffected by a shutdown.
Eurozone macro calendars will be lightly populated with the main focus upon German exports (Thursday) and factory orders (Friday). Asia-Pacific markets will primarily consider Japan’s Q3 Tankan report (Sunday ET). LatAm markets face light data risk with just manufacturing PMIs from Mexico and Brazil on Monday and the Brazilian composite PMI on Wednesday.

DISCLAIMER
This report has been prepared by Scotiabank Economics as a resource for the clients of Scotiabank. Opinions, estimates and projections contained herein are our own as of the date hereof and are subject to change without notice. The information and opinions contained herein have been compiled or arrived at from sources believed reliable but no representation or warranty, express or implied, is made as to their accuracy or completeness. Neither Scotiabank nor any of its officers, directors, partners, employees or affiliates accepts any liability whatsoever for any direct or consequential loss arising from any use of this report or its contents.
These reports are provided to you for informational purposes only. This report is not, and is not constructed as, an offer to sell or solicitation of any offer to buy any financial instrument, nor shall this report be construed as an opinion as to whether you should enter into any swap or trading strategy involving a swap or any other transaction. The information contained in this report is not intended to be, and does not constitute, a recommendation of a swap or trading strategy involving a swap within the meaning of U.S. Commodity Futures Trading Commission Regulation 23.434 and Appendix A thereto. This material is not intended to be individually tailored to your needs or characteristics and should not be viewed as a “call to action” or suggestion that you enter into a swap or trading strategy involving a swap or any other transaction. Scotiabank may engage in transactions in a manner inconsistent with the views discussed this report and may have positions, or be in the process of acquiring or disposing of positions, referred to in this report.
Scotiabank, its affiliates and any of their respective officers, directors and employees may from time to time take positions in currencies, act as managers, co-managers or underwriters of a public offering or act as principals or agents, deal in, own or act as market makers or advisors, brokers or commercial and/or investment bankers in relation to securities or related derivatives. As a result of these actions, Scotiabank may receive remuneration. All Scotiabank products and services are subject to the terms of applicable agreements and local regulations. Officers, directors and employees of Scotiabank and its affiliates may serve as directors of corporations.
Any securities discussed in this report may not be suitable for all investors. Scotiabank recommends that investors independently evaluate any issuer and security discussed in this report, and consult with any advisors they deem necessary prior to making any investment.
This report and all information, opinions and conclusions contained in it are protected by copyright. This information may not be reproduced without the prior express written consent of Scotiabank.
™ Trademark of The Bank of Nova Scotia. Used under license, where applicable.
Scotiabank, together with “Global Banking and Markets”, is a marketing name for the global corporate and investment banking and capital markets businesses of The Bank of Nova Scotia and certain of its affiliates in the countries where they operate, including; Scotiabank Europe plc; Scotiabank (Ireland) Designated Activity Company; Scotiabank Inverlat S.A., Institución de Banca Múltiple, Grupo Financiero Scotiabank Inverlat, Scotia Inverlat Casa de Bolsa, S.A. de C.V., Grupo Financiero Scotiabank Inverlat, Scotia Inverlat Derivados S.A. de C.V. – all members of the Scotiabank group and authorized users of the Scotiabank mark. The Bank of Nova Scotia is incorporated in Canada with limited liability and is authorised and regulated by the Office of the Superintendent of Financial Institutions Canada. The Bank of Nova Scotia is authorized by the UK Prudential Regulation Authority and is subject to regulation by the UK Financial Conduct Authority and limited regulation by the UK Prudential Regulation Authority. Details about the extent of The Bank of Nova Scotia's regulation by the UK Prudential Regulation Authority are available from us on request. Scotiabank Europe plc is authorized by the UK Prudential Regulation Authority and regulated by the UK Financial Conduct Authority and the UK Prudential Regulation Authority.
Scotiabank Inverlat, S.A., Scotia Inverlat Casa de Bolsa, S.A. de C.V, Grupo Financiero Scotiabank Inverlat, and Scotia Inverlat Derivados, S.A. de C.V., are each authorized and regulated by the Mexican financial authorities.
Not all products and services are offered in all jurisdictions. Services described are available in jurisdictions where permitted by law.