Next Week's Risk Dashboard
- BoC will likely defer to October
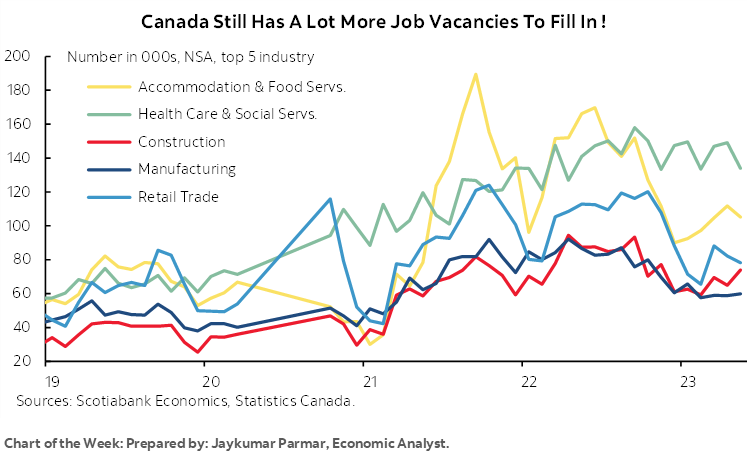
- Canada could witness a rebound in jobs
- Canadian immigration: macro effects and policy
- RBA to stand pat
- Chile’s central bank expected to deliver another mega-cut
- Bank Negara will likely hold
- Other global macro reports
Chart of the Week
The only thing that US and Canadian markets are likely to have in common this week is a quiet start as both countries enjoy their Labour Day holidays. Their calendar-based risks subsequently diverge from one another as the US will face a relatively quiet week but Canada could be a beehive of activity.
Global developments will also be relatively light. Chile’s central bank is expected to deliver another large rate cut, while the RBA and Negara are expected to hold. Data risk will focus upon what I’m sure will be another round of misleading China deflation headlines, plus reports out of Germany, LatAm inflation updates and GDP figures from Australia and South Korea.
BANK OF CANADA—SEE YA IN OCTOBER
The Bank of Canada will deliver a statement-only decision on Wednesday morning at 10amET sans a Monetary Policy Report or press conference. Governor Macklem will speak in Calgary the next day as it’s his turn to deliver the customary Economic Progress Report that follows non-MPR decisions. He will also host a press conference. The next MPR arrives on October 25th with complete forecast updates.
No policy change is likely at this meeting. I think they should have comfort to deliver another rate hike at this point, but they will probably seek the cover of the latest GDP figures and defer a fuller forecast assessment to the October meeting by which point they will also have a lot more data. Recent data affords the opportunity to buy some time. Key will be their assessment of how much of the underlying weakness in the economy during Q2 is transitory and how much of it signals a loss of momentum. I think most of it is transitory, but they may see it differently at least in part.
Please see here for further views on GDP and implications for the BoC, and last week’s Global Week Ahead that included a section on the BoC’s main focal points (here).
Nevertheless, I’m unsure that rate hikes are done. The Governor has been clear that a protracted period of actual GDP growth underperforming potential GDP growth will be required in order to open up disinflationary slack in the economy. In plain language, he realizes he has to break a few things in order to achieve his inflation goals. I don’t think he has the confidence to this point to say that they are clearly on such a path.
By the October MPR, the BoC will also have further data on inflation, productivity, jobs, inflation expectations, and GDP. In fact, some of it begins to arrive this week. These are the things that Macklem has said he is closely following in addition to activity variables and in keeping with his mandate which is to control inflation at a 2% rate over the medium-term.
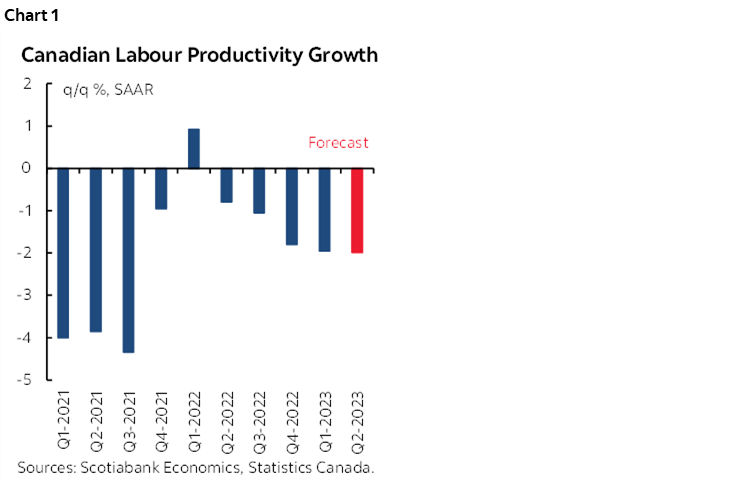
- Q2 labour productivity figures will be released ninety minutes before their decision on Wednesday. I expect a nonannualized drop of -0.5% q/q SA. That would extend a miserable streak to date (chart 1).
- Jobs and wages arrive on Friday, two days after the BoC decision (see next section). There will then be another jobs report on October 6th.
- The Governor needs to be mindful that market conditions have eased of late and careful not to drive a further easing that could replay the rally in 5-year GoC bonds earlier this year that set up cheaper mortgages and drove a Spring housing boom. The C$ has depreciated by about a nickel to the USD since about mid-July and 5s have rallied by about one-third of a percentage point in just over a week.
- The next BoC surveys that include measures of inflation expectations will arrive on October 16th before the October 25th policy decision. If they continue to indicate a lack of faith among businesses and consumers in the BoC’s 2% inflation forecast for years to come, then that would be disturbing to the BoC.
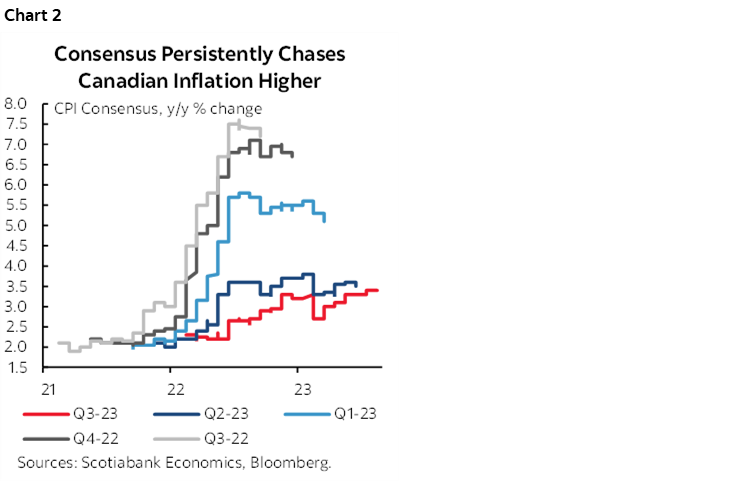
- The next CPI inflation reading for August lands on September 19th and there will be one more on October 17th before the next decision. We’ll see if consensus does a better job at forecasting inflation going forward than when everyone chased it higher with constant forecast revisions to date (chart 2). I think Governing Council will be rightly skeptical toward anyone’s ability to forecast inflation over time even as it puts on a brave face.
A bigger risk may entail watching Federal and provincial government fiscal updates into the Fall. Governments may jawbone inflation control, but it will be their specific proposals and numbers that will tell the truth with implications for whether fiscal policy continues to fight monetary policy at the margin.
CANADA’S LABOUR MARKET—FROM BOGUS TO BONANZA?
After Canada lost a small number of jobs in July (-6k), the tally for August will help to determine whether the country’s job market is faltering. My hunch is that we’ll see a rebound and that too many economists were too quick to pounce on the decline in employment in May and then again in July as signs that the job market is rolling.
There is always a hefty degree of trepidation that accompanies forecasting job creation for a report that has a 95% confidence interval of +/-57k. That said, I’m reasonably confident that the distortions that dragged July lower will set up a rebound, but don’t have a lot of confidence in how much. I’ve gone with a guesstimated increase in employment of 35k during August with a solid gain in hours worked. I would be more surprised by a much softer number than I would be by a much stronger one. Wage growth is likely to decelerated from the prior month’s 11% m/m SAAR jump and take the year-over-year rate back down again from 5% in July.
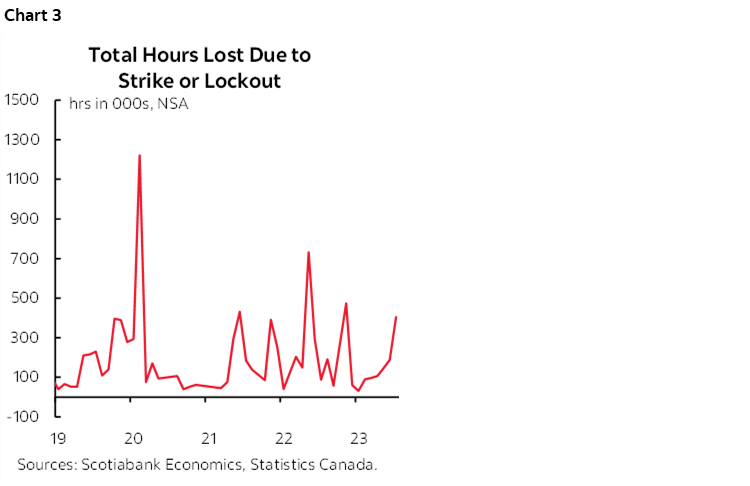
Work stoppages affected about 127k workers in each of April and May. While the data stops at June, the BC port strike probably drove this number higher again in July before falling in August as workers returned to work. Hours of work lost due to strikes have also been elevated up to July (chart 3). If not for strikes, hours worked would have grown by 0.2% m/m in July instead of 0.1%. Strikes therefore cost the job market in July but this effect should moderate in August.
The drop in employment during July seemed anomalous for other reasons (chart 4).
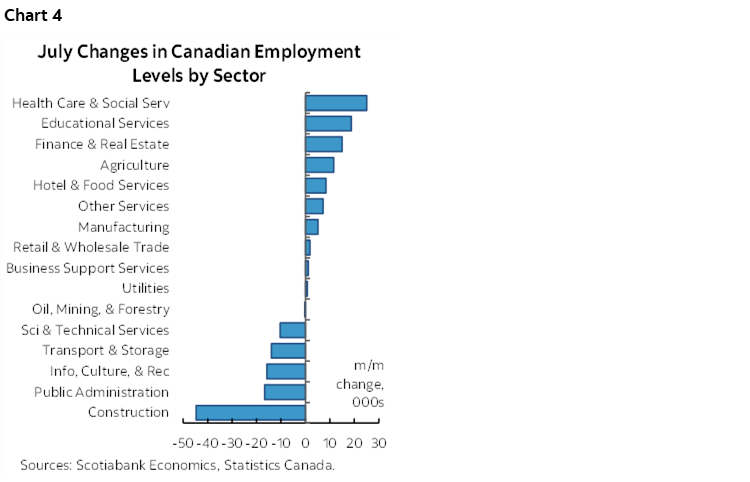
- What caught my attention more than anything else was a 45k loss of construction employment mostly in Ontario and BC during July. Are those two provinces not trying to build as many homes as possible and fast enough in order to meet immigration needs? One possible explanation is that July was a super wet month in parts of the country and it’s obviously hard to build houses, pour foundations and build the structures when it’s soaking wet. It’s very unlikely that Canada actually lost 40k construction jobs as they were off building an Ark instead of pouring foundations! In Toronto, for example, it rained on 19 of the 31 days that month for the most wet days ever in a month of July. Montreal had a record amount of rain for a month of July. August should see a rebound in this category.
- Further, what government suddenly embraced austerity and made civil servants into the riskiest profession in July such that 17k public administration jobs got lost? Probably none, versus treating this as noise.
- Losses in transportation and warehousing (-14k) were likely related to the port strike as workers shifted to strike pay especially into the July Labour Force Survey reference week. We also know that some firms indicated they were curtailing operations because they couldn’t get parts due to the strike. Spillover effects likely rippled throughout transportation, warehousing, agricultural and manufacturing related sectors. Workers in these sectors likely returned in August’s survey.
- The 6k loss of self-employed positions is always unverifiable soft data. It’s a valuable part of the economy, but I never really trust this component’s reliability.
Other details in the July figures were more robust including a mild gain in hours worked and a super acceleration of average hourly wages that were up by 11% m/m at a seasonally adjusted and annualized rate.
CANADIAN IMMIGRATION, HOUSING AND JOBS
Immigration and its various effects on the Canadian economy serve as a segue off the prior section’s focus upon the job market. I’d like to touch on three related points.
i) Productivity
Should we be concerned that per capita GDP growth has fallen? Yes and no. If it persists, then it’s bad for living standards. A lot of the bleak commentary on this measure seems to be implicitly assuming that it will persist. I don’t think we can say that.
At issue is whether a surge of immigration carries first and second (third, fourth…) round effects on the economy. In the first round, a surge of population growth struggles to be integrated, to become familiar with their new country, and to integrate. The second-round effects could entail obtaining employment, and maybe starting a business and ramping up output. This second phase could unleash beneficial effects to labour productivity and lift per capita GDP growth. Obviously it’s too early to assess this second-round effect in response to the surge of immigration that Canada has sought.
There is an analog to the energy patch. For years it was a productivity sinkhole as an enormous amount of capital went in while nothing came out. Transitioning to the second phase is where the benefits get unleashed.
There is empirical evidence to back the assertion that higher immigration can boost productivity growth. Studies like this one in the US, or this one at the firm level by Statistics Canada are supportive.
ii) Who’s Getting the Jobs?
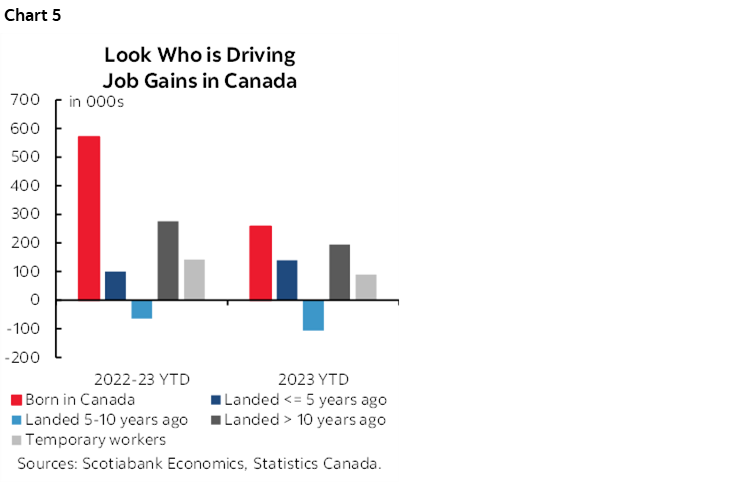
Until I see clear evidence to the contrary, it seems that thus far most of the job gains in Canada are going to those who were either born in Canada or to immigrants who earned permanent resident status years ago (chart 5). Academic studies that point to undercounting of total population in Canada don’t necessarily change this proportion. Undercounting because the figures may miss around one million, maybe more or maybe less, assumes that the nature of the community being undercounted is being fully employed and just not counted. We don’t know that just from population counts and don’t know what fraction of the undercounted population even count themselves in the labour force.
iii) How Much More Housing Should be Built?
For some time now there has been an understanding that immigration tallies undercount temporary, or nonpermanent residents. Academics have been saying this for a while. The extension being offered to housing policy is where things break down in my view.
Canada is undercounting temps by around one million people, we’re told. This is because they overstay their welcome after visas expire and this is not counted by Census data, plus a much smaller number exploit a loophole by not filling out Census surveys while claiming they are returning parents in the home country. So, these pundits advise, why not build more housing for them and use taxpayer funds to do so?
The consequences could be far reaching. One is that the integrity of the nation’s immigration rules is imperilled through lax enforcement that encourages future abuse. Another is that someone has to pay for the housing assistance for people in the country illegally and that means a few things. It means higher taxes for hard working immigrants who came through legal channels. It means greater inflationary pressure by spending more on housing in an economy at capacity limits. That in turn means greater risk of more Bank of Canada rate hikes or higher rates for longer than otherwise. The most inhumane policy option would be to get in the way of the BoC’s job to control inflation given its insidious, regressive effects.
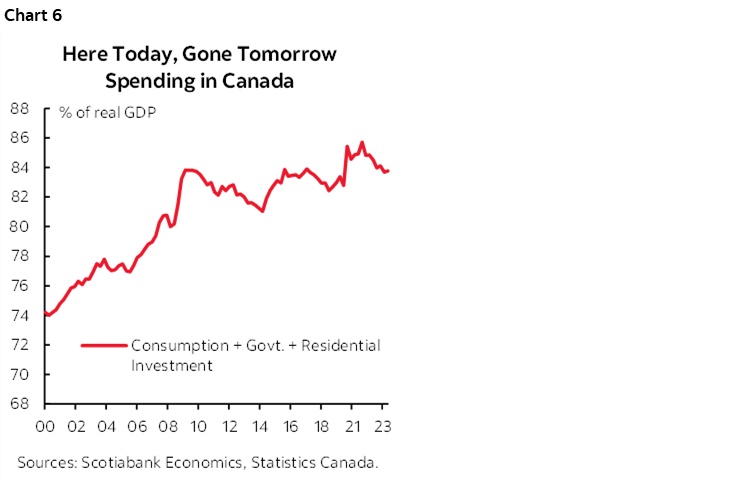
There is a bigger macro point here though. 84% of GDP now goes to housing, consumer spending and current government spending. 84% on here-today-gone-tomorrow activities in productivity sinkholes that divert workers and resources away from sectors that could otherwise invest and drive productivity in a nation with a perpetual productivity problem. That’s a 20+ year high (chart 6). Federal and provincial governments in Canada routinely overstimulate housing and there is a macro cost to doing so. Sounder macroeconomic policy advice may well be to enforce the immigration rules and crack down on the cheaters.
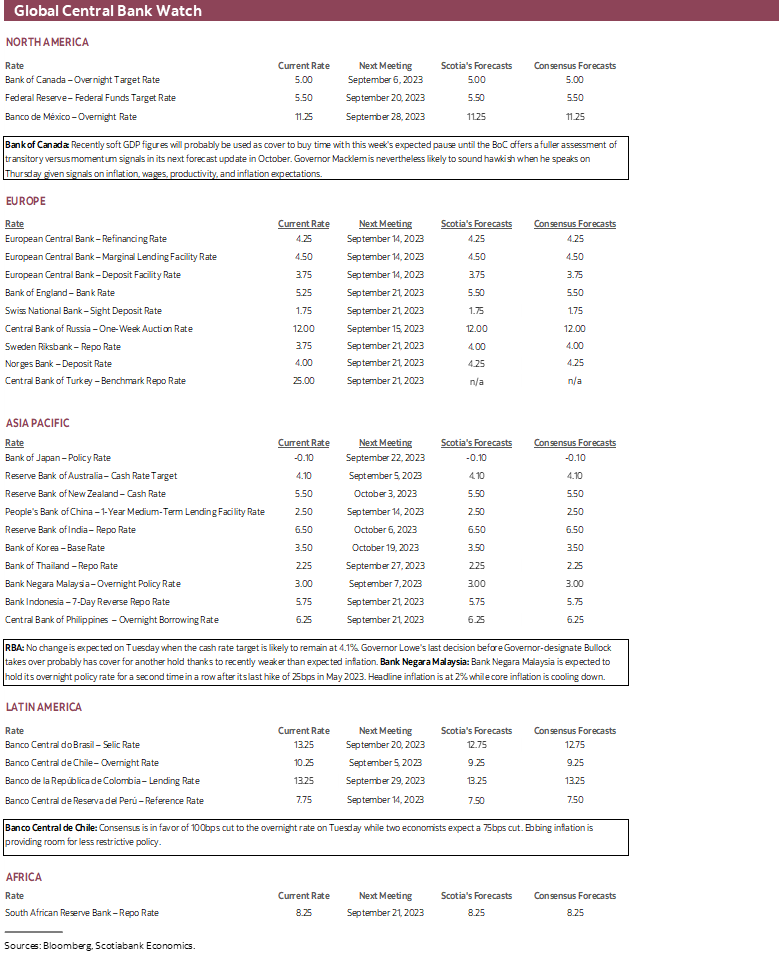
OTHER CENTRAL BANKS—TWO HOLDS AND A CUT
Only three other central banks will weigh in with policy decisions and updated guidance this week. Two holds and a cut are expected.
RBA—Inflation Counsels Another Hold
No one really expects Australia’s central bank to change its cash rate target on Tuesday. Markets are priced for no change and consensus is unanimous that the rate will stay parked at 4.1%. It’s Governor Lowe’s last decision before Governor-designate Bullock takes over on September 18th. Bullock recently warned of the need for restrictive policy in her recent comments, but then CPI landed materially weaker than expected for the month of July.
Banco Central de Chile—Another Cut Coming
Chile’s central bank is widely expected to cut its policy rate again on Tuesday. It had reduced the rate from a peak of 11.25% to 10.25% in July (chart 7). Another 100bps cut is expected on Tuesday with a minority of economists expected a smaller 75bps reduction. Easing inflationary pressures and an outlook for further easing is providing room for less restrictive monetary policy.

Bank Negara—Getting Ready?
Malaysia’s central bank is forecast to hold its overnight rate at 3% again on Thursday. The ringgit has stabilized since the last decision on July 6th, but the central bank will be sensitive to doing anything that can destabilize it and thus pose financial stability concerns. Inflation came in weaker than expected at 2% y/y in July and has been falling for a year now. The path toward easing may feature in forward guidance.
GLOBAL MACRO—MORE MISLEADING CHINA DEFLATION HEADLINES COMING
Most of the global weekly indicator risk will be focused upon China’s inflation readings, the US service sector, Latin American inflation, readings on Germany’s economy and a pair of Asia-Pacific GDP reports.
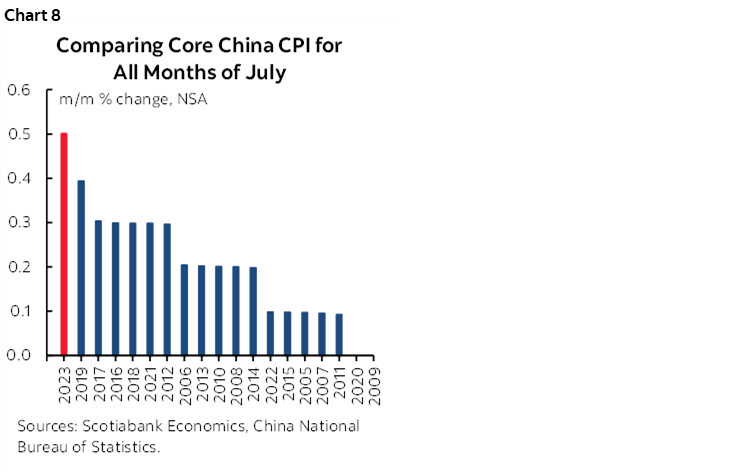
China will top the list of weekly indicator risks. CPI inflation during August (Friday) may continue to hover in negative year-over-year territory for now and I’m sure that will incite another round of misleading deflation calls. All we’re doing is basing year-over-year readings to this time last year when, for example, pork prices rose by about double over a six-month period of time. That’s not deflation the way most economists define it. I still stand by views expressed here. Watch the month-over-month core CPI gauge to see if it jumps as much as it did in July (chart 8).
Also watch China’s trade figures for August on Wednesday to see how much further weakness may be unfolding.
Canada will mostly focus upon the BoC communications and jobs, but Wednesday’s trade figures for July will help to inform how trade is contributing to Q3 GDP at the same time that productivity is updated with Q2 figures and is likely to decline again. The Ivey PMI for August arrives Thursday.
This will be a light week for US observers. Markets start off shut for Labour Day on Monday ahead of the following Saturday’s commencement of the Fed’s communications blackout. Very little data is out this week. The key release will be Wednesday’s ISM-services report that is expected to continue to demonstrate modest growth. Factory orders will probably follow the already known durable goods orders report lower and add on orders for nondurable goods (Tuesday). The trade deficit probably widened a bit given the already known merchandise component plus a usually stable services surplus (Wednesday).
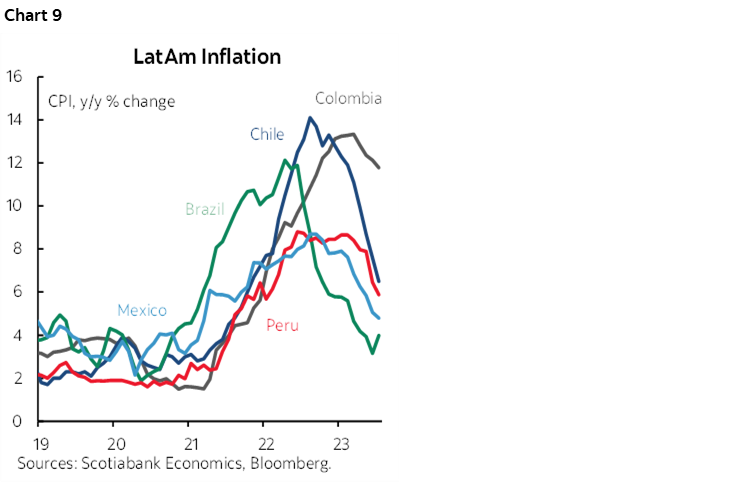
LatAm and Asia-Pacific countries will update inflation readings for August starting with Taiwan and Philippines on Monday. Colombia and Mexico update on Thursday and then Chile on Friday (chart 9).
Hours after the RBA’s decision, Australia will report Q2 GDP growth that is expected to stay gently on the plus side.
South Korean GDP (Monday) should remain resilient with estimated growth of 0.6% q/q SA nonannualized. CPI for August will be released at the same time and is expected to accelerate closer to 3%.
European markets face light developments. The ECB’s inflation expectations survey for July (Tuesday), plus Germany trade (Monday), factory orders (Wednesday) and industrial output (Thursday) will be the main events.

DISCLAIMER
This report has been prepared by Scotiabank Economics as a resource for the clients of Scotiabank. Opinions, estimates and projections contained herein are our own as of the date hereof and are subject to change without notice. The information and opinions contained herein have been compiled or arrived at from sources believed reliable but no representation or warranty, express or implied, is made as to their accuracy or completeness. Neither Scotiabank nor any of its officers, directors, partners, employees or affiliates accepts any liability whatsoever for any direct or consequential loss arising from any use of this report or its contents.
These reports are provided to you for informational purposes only. This report is not, and is not constructed as, an offer to sell or solicitation of any offer to buy any financial instrument, nor shall this report be construed as an opinion as to whether you should enter into any swap or trading strategy involving a swap or any other transaction. The information contained in this report is not intended to be, and does not constitute, a recommendation of a swap or trading strategy involving a swap within the meaning of U.S. Commodity Futures Trading Commission Regulation 23.434 and Appendix A thereto. This material is not intended to be individually tailored to your needs or characteristics and should not be viewed as a “call to action” or suggestion that you enter into a swap or trading strategy involving a swap or any other transaction. Scotiabank may engage in transactions in a manner inconsistent with the views discussed this report and may have positions, or be in the process of acquiring or disposing of positions, referred to in this report.
Scotiabank, its affiliates and any of their respective officers, directors and employees may from time to time take positions in currencies, act as managers, co-managers or underwriters of a public offering or act as principals or agents, deal in, own or act as market makers or advisors, brokers or commercial and/or investment bankers in relation to securities or related derivatives. As a result of these actions, Scotiabank may receive remuneration. All Scotiabank products and services are subject to the terms of applicable agreements and local regulations. Officers, directors and employees of Scotiabank and its affiliates may serve as directors of corporations.
Any securities discussed in this report may not be suitable for all investors. Scotiabank recommends that investors independently evaluate any issuer and security discussed in this report, and consult with any advisors they deem necessary prior to making any investment.
This report and all information, opinions and conclusions contained in it are protected by copyright. This information may not be reproduced without the prior express written consent of Scotiabank.
™ Trademark of The Bank of Nova Scotia. Used under license, where applicable.
Scotiabank, together with “Global Banking and Markets”, is a marketing name for the global corporate and investment banking and capital markets businesses of The Bank of Nova Scotia and certain of its affiliates in the countries where they operate, including; Scotiabank Europe plc; Scotiabank (Ireland) Designated Activity Company; Scotiabank Inverlat S.A., Institución de Banca Múltiple, Grupo Financiero Scotiabank Inverlat, Scotia Inverlat Casa de Bolsa, S.A. de C.V., Grupo Financiero Scotiabank Inverlat, Scotia Inverlat Derivados S.A. de C.V. – all members of the Scotiabank group and authorized users of the Scotiabank mark. The Bank of Nova Scotia is incorporated in Canada with limited liability and is authorised and regulated by the Office of the Superintendent of Financial Institutions Canada. The Bank of Nova Scotia is authorized by the UK Prudential Regulation Authority and is subject to regulation by the UK Financial Conduct Authority and limited regulation by the UK Prudential Regulation Authority. Details about the extent of The Bank of Nova Scotia's regulation by the UK Prudential Regulation Authority are available from us on request. Scotiabank Europe plc is authorized by the UK Prudential Regulation Authority and regulated by the UK Financial Conduct Authority and the UK Prudential Regulation Authority.
Scotiabank Inverlat, S.A., Scotia Inverlat Casa de Bolsa, S.A. de C.V, Grupo Financiero Scotiabank Inverlat, and Scotia Inverlat Derivados, S.A. de C.V., are each authorized and regulated by the Mexican financial authorities.
Not all products and services are offered in all jurisdictions. Services described are available in jurisdictions where permitted by law.