Next Week's Risk Dashboard
- CDN CPI could be another hot one
- The BoC’s dubious peak wages call
- A strong start for US holiday shopping?
- PBoC could invoke stealth easing
- Will Australian wage growth accelerate?
- UK CPI, jobs and wages to inform BoE’s stance
- Ontario fiscal update
- BI, BSP expected to hike
- Other global macro
Chart of the Week
THE NEXT CANADIAN CPI REPORT MAY BE ANOTHER HOT ONE
Canada updates CPI for October on Wednesday and it could be another doozie. I’ve estimated that it should rise by about 1.2% m/m NSA and 1.0% in seasonally adjusted terms. If so, then the y/y rate would pop back up by a half point to 7.4% y/y. Traditional core CPI (ex-food and energy) is also forecast to rise by about 0.7% m/m SA and lift the year-over-year rate above 6%. There is more downside caution to this forecast in light of some of the evidence in the softer than expected US CPI report, but there are important idiosyncratic differences between the two.
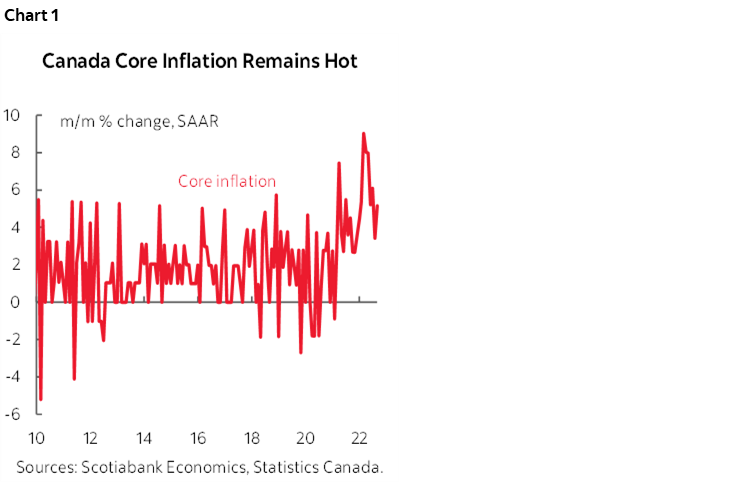
If such estimates prove to be near to reality, then core inflation will continue to run hot (chart 1). Add in very high breadth to price pressures and the BoC would be unlikely to take comfort that policy tightening and market tightening that preceded their delayed actions are having any effect just yet, though it remains early in terms of the lagging effects.
Forecasting near-term inflation is done on a bottom-up components basis. Drivers include the following points:
- If the only thing that changed was the shift in year-ago base effects (ie: comparing to the CPI index of October 2021 instead of September) then this would drop the y/y inflation rate from 6.9% in September to 6.1% in October. Other drivers generally work in the other direction for this month.
- the price of gasoline rose by 9% m/m in October and is tracking a milder increase in November. This should add about 0.4ppts to m/m inflation in weighted terms;
- October is normally a significant up-month for CPI inflation;
- A 16% weight on food prices in the CPI basket is assumed to add a weighted 0.1 ppt contribution;
- little net contribution is expected from new and used vehicles;
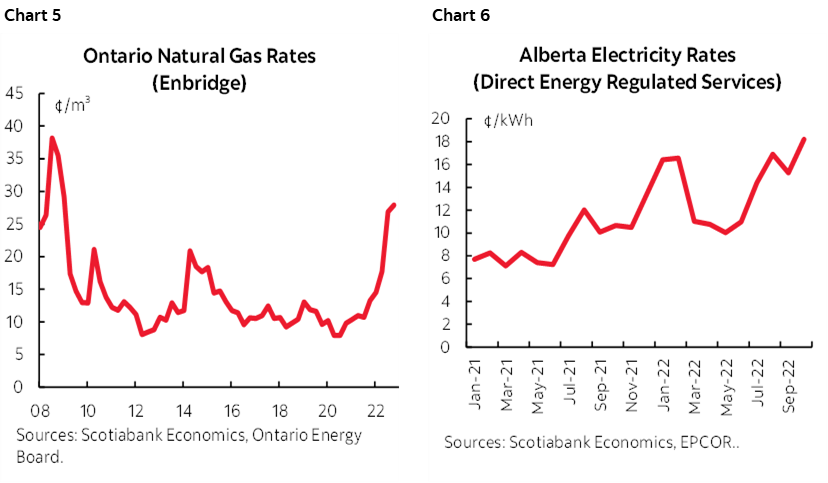
- some regulated prices for natural gas (0.8% weight) and electricity (1.8% weight) pushed higher;
- service price inflation is forecast to add about a couple of tenths to m/m price pressures.
- The 13% m/m NSA drop in airfare in September and two months of decline in the recreation, reading and education categories are estimated to reverse higher in October.
- The way Statcan captures housing in CPI emphasizes new house prices with a low weight on the replacement cost component of CPI. New house prices are levelling off at high levels over recent months and when combined with their low weight this is not expected to be a material drag.
Furthermore, I'm still of the view that Canada faces materially greater inflation risk than the US and that it would be a mistake if the central bank signalled clearly that it is done next month in addition to the signals Governor Macklem provided in his recent speech (covered in the next section). Points are offered below. Combine October’s blow out jobs and wages with next week's likely hot CPI report and the BoC may be more likely to hike by another 50 on December 7th if data carried the day versus Macklem's openness to going either 25 or 50 at the next meeting. What follows are views on the drivers.
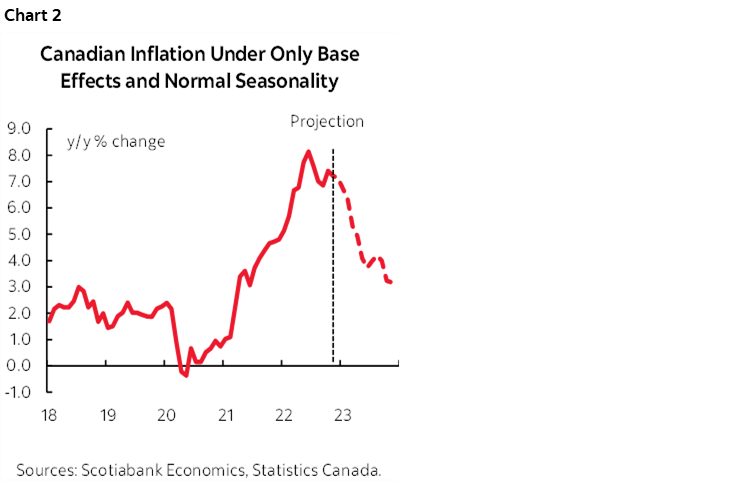
1. First, the right way to look at inflationary pressures going forward won’t be the year-over-year rate as argued for a long time now. Base effects and normal seasonality would alone take inflation sharply lower toward around 3.2% by the end of 2023 (chart 2). That’s only a half point above our forecast that assumes modestly decelerating but still material month-over-month inflation. Instead, watch the trend in month-over-month seasonally adjusted and annualized core price pressures which is what the rest of the arguments hang on below.
2. We are assuming that there will be gradual further progress toward healing supply chains. Some of that progress has been mixed across various measures and some of it has stalled out. My own view is that we could stall or regress over the near-term (hence upside risks to inflation) partly as covid flares.
3. Canada is probably in a deeper state of excess demand than the US after a torrid pace of growth over the four quarters up to mid-year and with Q3 looking like it will remain positive. Excess demand is likely to be reined in only gradually. Our forecast through to the end of 2023 doesn’t open up enough slack if we’re right with the house view pointing to just a couple of mildly negative quarters in 23H1 and then positive but below potential GDP growth over 23H2. Canada is better positioned than other countries to withstand tighter monetary policy given the commodities and terms of trade lift, given serial fiscal policy stimulation versus likely gridlock in the US, given higher immigration stimulus, given robust nonfinancial corporate balance sheets, and given still pent-up demand for autos and services by consumers as some of the arguments.
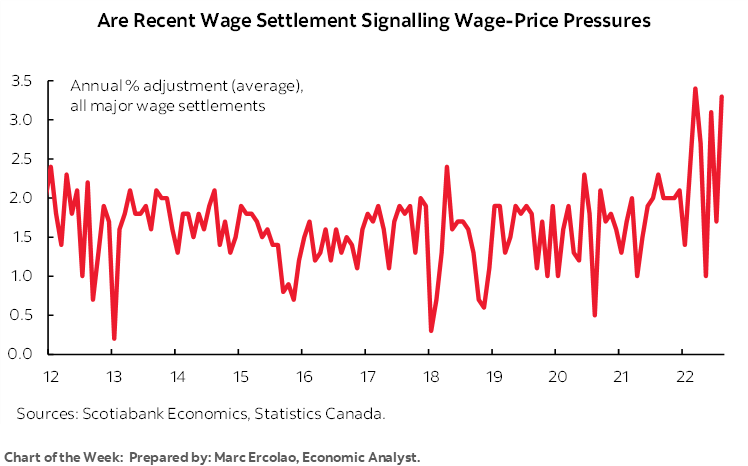
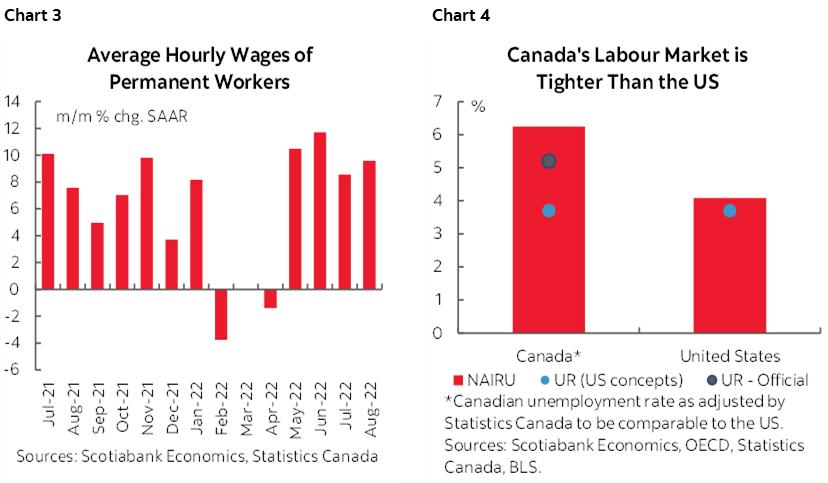
4. Canada faces high risk of a wage-price spiral. August wage settlements (freshest so far) spiked toward 3.5% which is about double (or more) compared to what we had become accustomed to over the past decade and still on an upward trend (see the cover chart). Momentum into the Fall is likely to take that higher. Month-over-month wages have grown by 5–11% m/m SAAR in 12 of the past 16 months through reopening and shutting experiences suggesting there is something more durable by way of the drivers to wage gains (chart 3). That is now taking real wage gains into positive territory since May of this year. Canada’s job market is super tight in a state of excess demand with the UR well below estimates of structural unemployment and more so than the US (chart 4). Our forecast unemployment rate only rises toward about 6% over 23H2 from 5.2% now and partly on the assumption that the demographics are very different in this cycle (more of a seller’s market for labour in aging populations than a buyer’s market). Therefore, an augmented Phillips curve approach only sees a mild assist from developments in the labour market toward the aim of cooling inflationary pressures.
5. Rising evidence of labour strife needs to be closely monitored including for spillover effects. The catch-22 to aggressive wage hikes is that they could be precedent-setting for other workers and they would fan inflation and a combination of higher rate peaks for longer.
6. Productivity is awful in absolute terms and relative to other countries. Canadian wages are going up as output per hour worked tanks which is a bad combination.
7. The terms of trade effect is more powerful for Canada. In plain English, high commodity prices insulate the country from some of the risks facing the world economy.
8. CAD has not cooperated with the terms of trade all year and its weakness adds to import price pressures. CAD weakening from last year may carry lagged effects on CPI of around +0.2–0.4 ppts. That’s hardly a dominant driver, but the import price pressures are likely to remain.
9. I think housing weakness is more likely to be transitory in Canada than the US. Housing all of the planned new arrivals through aggressive immigration targets will be a bigger challenge over time in relation to the paucity of supply.
10. Housing’s influence on Cdn CPI is less than the US because of measurement differences. The house-only component of the new house price index is used as the driver of replacement costs within CPI and replacement cost has only a 6.4% weight in the Canadian CPI basket. This contrasts to OER as the way the US captures housing’s direct effects. Then there is the whole discussion around how I think Canadian housing softness will be transitory.
10. Regulated price changes will be passing on higher pressures. Regulated natgas prices, for example, are up sharply this month everywhere except Alberta. Therefore, even if market prices ebb, we’re not done with regulatory prices. See charts 5–6.
11. Fiscal policy remains expansionary in Canada across all levels. The serial stimulators are alive and kicking in Ottawa and the provincial capitals and with more promised (and probably yet to be revealed) spending ahead. Contrast this to likely gridlock in Washington over the back half of President Biden’s mandate.
Beyond the next year there is a whole separate discussion on how the longer-term structural drivers of inflation are probably very different than the prior decade before the pandemic and even earlier.
BANK OF CANADA’S MACKLEM CALLS A DUBIOUS PEAK FOR WAGE GROWTH
Whatever CPI number lands, it’s fairly clear that the BoC is turning incrementally cautious. Evidence of this can be found in Governor Macklem’s recent speech on labour markets (here). The speech made me uneasy in several important respects, but I’ll address those while sharing a view on his main message.
Guiding that wage growth is peaking (his view) and that there will be "difficult adjustment" in the labour market is incrementally dovish and is the speech's main forward-looking insight. The foundations nevertheless seem to be suspect.
Macklem’s argument for how wage growth is peaking is wanting in my opinion. Wage growth accelerated in the latest October wage report so it's a bold call to say that's a peak. In fact, most of the months since the summer of 2021 have been marked by really strong annualized wage gains (chart 3 again). Macklem may be relying on the BoC’s latest Business Outlook Survey (here) that shows businesses expecting softer wage growth over the next 12 months, but businesses in this small sample were caught flat footed by the run-up and so I’m not sure how reliable their forward guidance may be. Also note the August wage settlements data was at the highest in ages (cover chart again) which he did not mention. Nor did he mention that there are several important contract disputes in the public sector that could stamp precedents on other wage negotiations.
Furthermore, there has been no material loosening of conditions in the job market to date. Employment skyrocketed to a record high in October. The unemployment rate is up from the trough of 4.9% in June and July and is now at 5.2% but that's a tiny change that is partly driven by a two-tenths increase in participation since then. That small rise in the participation rate is likely driven by a combination of factors like tight labour markets driving accelerating wage gains and pulling in more workers but not quickly enough in order to stymy such wage gains, plus inflationary pressures perhaps driving some households to have no choice but to seek extra jobs. There may be additional factors to consider like childcare changes albeit still plagued by a shortage of spaces, and rising immigration although the latter typically involves integration lags in Canada. The UR is also well below natural rate estimates and hence deeply into excess labour demand.
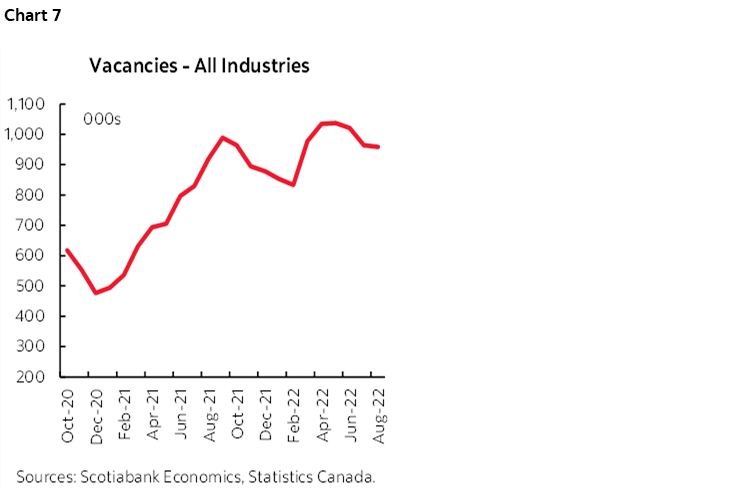
Macklem instead appears to be relying upon the so-called Beveridge curve (not Beverage; that one shows rising average scotch consumption with age! Not to mention incomes at today’s prices!). The chart he references on this in his speech has probably one of the most generous regression fits to the data that I’ve ever seen. Macklem is saying that since job vacancies are falling, this will drive the unemployment rate higher and wage growth down with it. That could be sensible and job losses are likely, but he’s overplaying the evidence on vacancies to date that remain high and have only barely slipped (chart 7) and he may be overplaying the fit.
In a glaring omission, nowhere does Macklem’s speech even mention productivity. How can you say wage growth is peaking without speaking to awful productivity given the connections to inflation? Maybe it’s just too dirty of a word in Ottawa these days.
Overall, I think the way to interpret his remarks that basically say yes we treat our 2% inflation target as paramount but we also want to support maximum sustainable employment is that they have an asymmetric bias toward the 1–3% inflation target range that may be comfortable riding in the upper half when we get there so as not to unduly damage job markets. That's how I'd play it. They realize they have to cool things down in the economy and job market.
This is not, however, the BoC of, say, the early 90s that dismissed the impact on labour markets when one-in-five were unemployed or dropped out and perhaps the greater challenge facing inflation expectations back then explains some of that difference.
This is also not the BoC of 5-year inflation renewal agreements before last year's that treated 2% as sacrosanct. To me, that says it's a dirtier inflation target now. I question the BoC's commitment to its inflation target accordingly and also anchor that view by reminding readers of Macklem's bias throughout 2021 when he was all about targeting extreme maximum employment and misjudged inflationary pressures. We'll see how this unfolds for them, but I think the signal here is that they're done in December, maybe January, and then we’ll go into a protracted period of assessing the outlook and further adjustments if needed.
CENTRAL BANKS—PBoC STEALTH EASING?
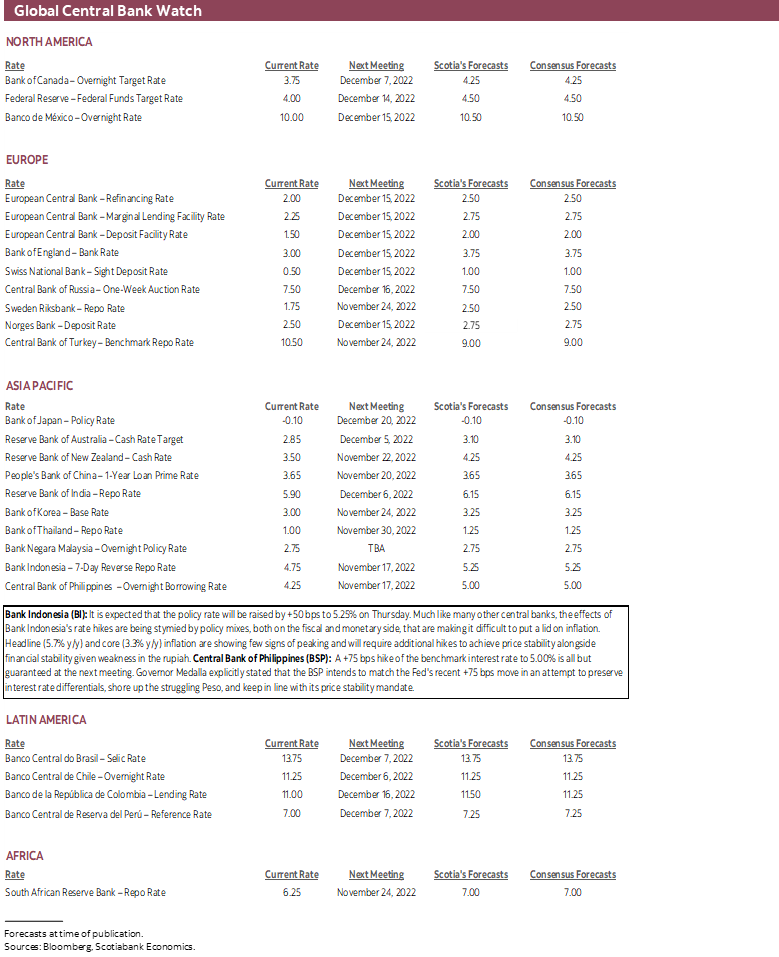
There are only three central banks on the docket for next week and none of them are likely to deliver decisions that will be impactful to global markets.
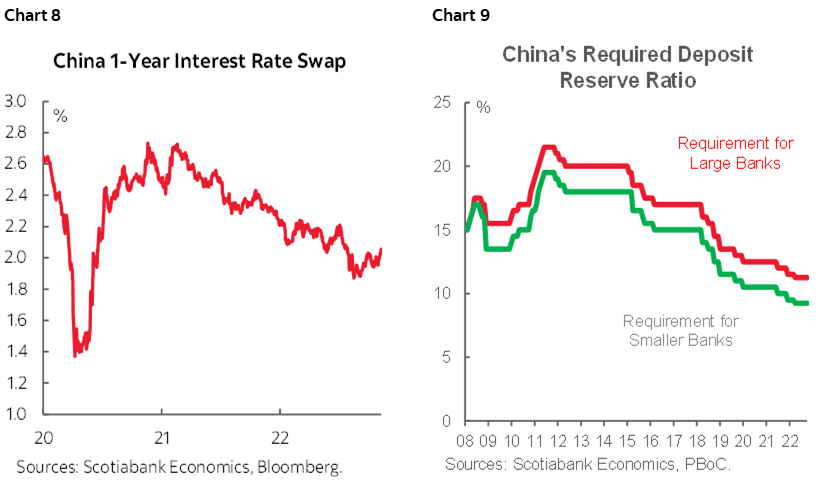
The People’s Bank of China is widely expected to keep its 1-year Medium-Term Lending Facility Rate unchanged at 2.75% on Tuesday. That will likely inform expectations for the 1-year and 5-year Loan Prime Rates to remain unchanged the following week. Market measures have gradually drifted lower (chart 8). There is some speculation that another cut to required reserve ratios may be delivered given that cutting rates would further destabilize the yuan as the Fed continues to tighten and given cash drain in China’s banking system (chart 9).
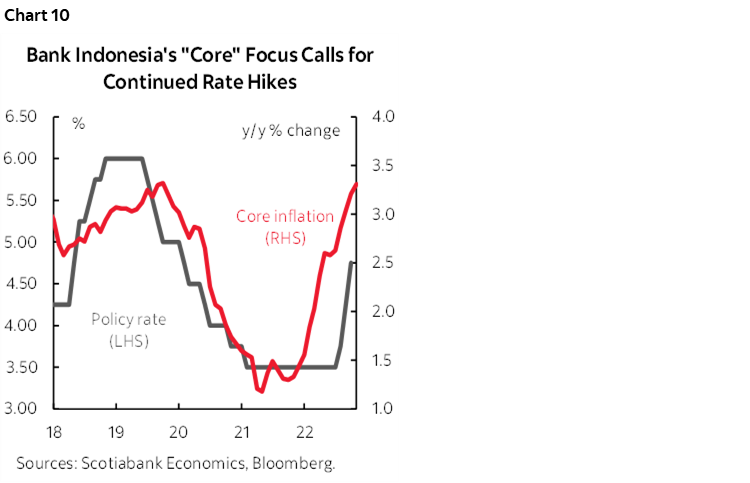
Bank Indonesia is expected to raise its 7-day reverse repo rate by 50bs on Thursday amid rising inflation (chart 10). The minority view in favour of a 25bps hike might win out if the central bank is less concerned about financial instability effects stemming from weakness in the currency in light of the fact that US CPI surprised lower and may motivate a milder rate hike by the Fed in December.
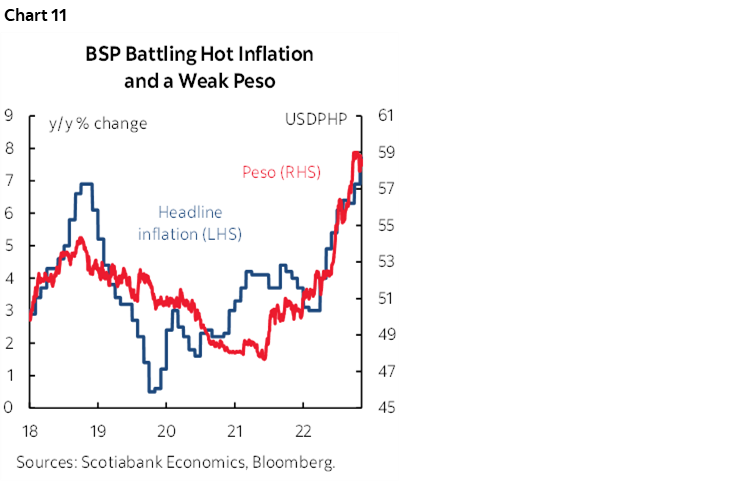
Bangko Sentral ng Pilipinas is expected to deliver another hike that could lift its overnight borrowing rate by 50–75bps on Thursday. The 50 camp appears to be betting against explicit guidance from Governor Medalla who said that the BSP intends to match the Fed's recent +75 bps move in an attempt to preserve interest rate differentials and mitigate currency weakening (chart 11).
ONTARIO FISCAL UPDATE
Ontario is scheduled to release its fall economic and fiscal update on Monday November 14 and what follows is Laura Gu’s preview.
We expect the hand-off from FY22’s $2.1 bn (0.2% of nominal GDP) surplus and continued revenue windfalls to drive modest near-term improvements in the bottom-line, providing a better starting point for the upcoming fiscal years while the province braces for a slowdown.
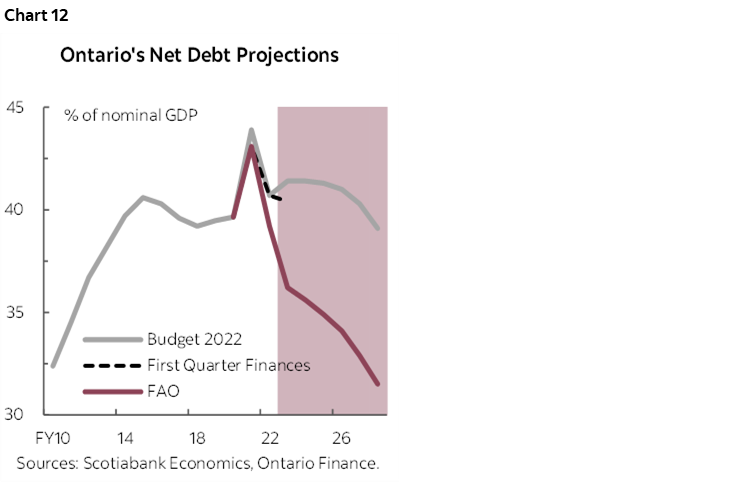
Recall that the province’s 2022 Budget projects deficits of -$19.9 bn (-1.9% of nominal GDP) in FY23, -$12.3 bn (-1.1%) in FY24, -$7.6 bn (-0.7%) in FY25, and a return to balance by FY28. The province’s First Quarter Finances reported a slight improvement in the FY23 deficit to -$18.8 bn (-1.8% of GDP). Recent forecasts by the FAO shows a much larger improvement—projecting a growing surplus starting this fiscal year—underpinned by higher nominal growth assumptions than our baseline forecasts (by 2 ppts for 2022). We don’t expect the fiscal path to be this tight given elevated recession risks and the government’s prudent practice of conservative forecasting and contingencies. With high uncertainty in the revenue outlook, we expect a cautious tone on new spending, potentially with some restrained pocketbook measures added in the near-term. Debt levels should decline as a share of nominal output to below the latest projection of 40.4% in FY23 and will likely follow a similar trajectory as planned in the Budget (chart 12), but from a lower starting point. We’ll be watching for any measures designed to blunt the impact of inflation on households given their potential impact on the BoC’s fight against inflation.
GLOBAL MACRO HIGHLIGHTS
The main additional highlights of the coming week’s developments are offered according to regions.
US—Strong Retail Sales the Highlight
The US holiday shopping season might be getting off to a robust start. More telling will be the spate of sales beginning on US Thanksgiving (November 24th) and Black Friday the day after through Cyber Monday. In the meantime, retail sales for October should get a powerful lift from auto sales and gas prices, but the uncertainty surrounds how core sales will perform. Vehicle sales jumped by 10% m/m SA and gasoline prices were up by an estimated 5% m/m SA. Combined, these two factors alone would give a 2.2 percentage point weighted boost to total retail sales that are reported in value terms. A moderate CPI report for October is also likely to boost the value of sales.
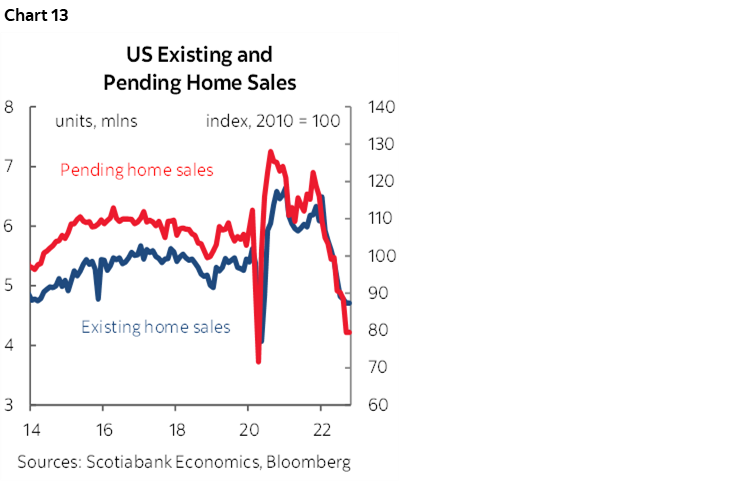
Other US releases will focus upon housing and industrial readings. Tuesday’s producer prices are expected to post another half-point m/m rise for October. Wednesday’s industrial output could benefit accordingly from higher prices but with slipping ISM-manufacturing’s production gauge weighing on the gain. The Empire (Tuesday) and Philly Fed (Thursday) measures will then start the long march toward the next ISM-manufacturing reading. Housing starts (Thursday) might follow permits lower and Friday’s existing home sales during October are practically guaranteed to follow the leading indicator of pending home sales lower (chart 13).
Canada—GDP Tracking
Canada will be mostly focused upon CPI, but GDP tracking will be informed by a sprinkling of other readings. Manufacturing sales are expected to drop given flash guidance that pointed to a 0.5% m/m decline in September; volumes and details are pending. Wholesale trade probably also fell given flash guidance for a 0.2% m/m decline. Canada updates existing home sales for October on Tuesday following a string of seven monthly declines. Housing starts in October (Wednesday) will probably remain strong but reverse the surge to about 300k at an annualized rate that had been driven by September’s rise in multiple housing units especially in Ontario.
LatAm—High Inflation, Slowing Growth
I just loved a chart in the Bank of Canada’s recent Monetary Policy Report that made it look like inflation in Canada was trivial by comparison to elsewhere. I guess that’s true but including the scale-busting readings from Argentina and Turkey forces the point. Argentina will update its October reading on Tuesday and it’s unlikely to be much of an improvement from the prior month’s 83% y/y pace. Not a typo.
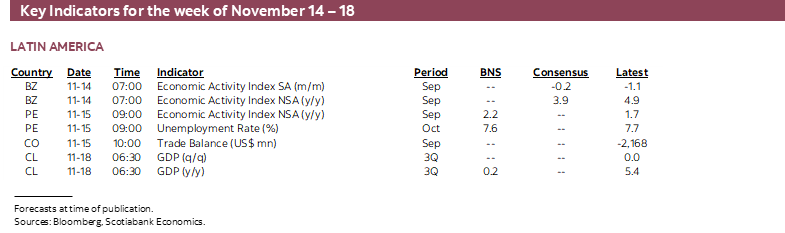
Colombia will update Q3 GDP on Tuesday and our Bogota-based economists Sergio Olarte and Jackeline Pirájan Diaz expects growth to decelerated toward 5.3% y/y from 12.6% the prior quarter.
Chilean Q3 GDP (Friday) is expected to land at 0.2% y/y from 5.4% the prior quarter as estimated by our Santiago-based economist Jorge Selaive.
UK Jobs, Wages and CPI
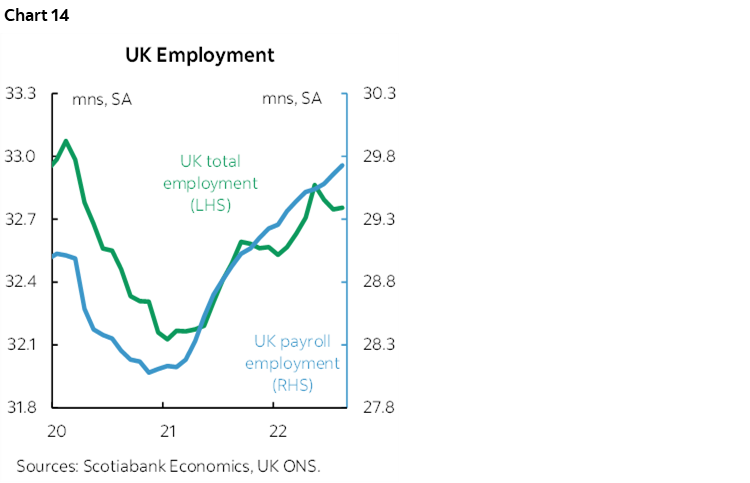
Two employment reports sit between now and the BoE’s next meeting on December 15th, with the first due on Tuesday. The labour market in the UK has showed nascent signs of cooling but has remained relatively tight even amidst the backdrop of slowing economic activity and volatile financial conditions. August’s +8k gain in jobs did little to offset the –117k lost over the two months prior (chart 14). Overall employment has yet to recover to pre-pandemic levels, where part of the ~300k shortfall can be attributed to the UKs shrinking labour market–labour supply challenges have been one of the main drivers of the record low 3.5% unemployment rate. Looking under the hood, wage growth accelerated for four consecutive months to 5.6% y/y, payroll employees increased by nearly double the +35k expectation last month, and job vacancies sit only marginally off their record highs.
UK CPI for October (Wednesday) is expected to drift a little higher from the 10.1% y/y reading in September and could land closer to 11%. Somewhat lower petrol prices in October could weigh on the month-over-month reading.
Australian Jobs and Wages
Australia’s labour market has undergone a healthy recovery, but recent data may be pointing to a shift in dynamics. First, the facts for a still-tight labour market:
- +280k jobs created YTD, with only one-in-nine months realizing job losses
- ~+600k more jobs compared to pre-pandemic levels
- The participation rate and unemployment rate are sitting a tenth of a percent off their record high (low) respectively at 66.6% and 3.5%.
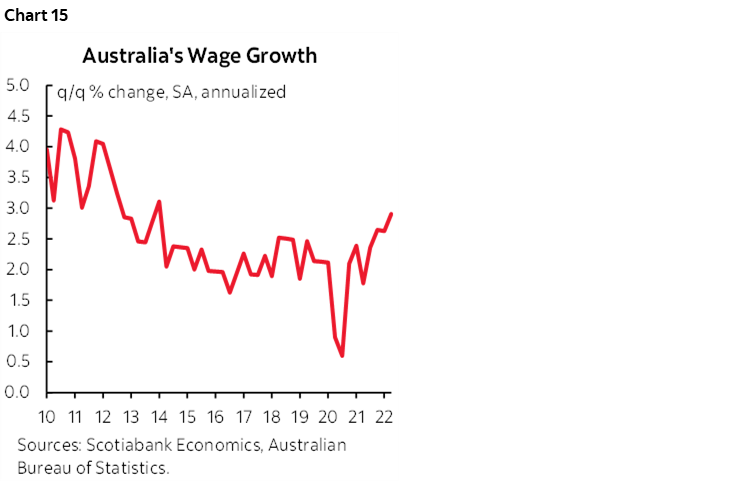
- There are rising, albeit modest, wage pressures at 2.9 % q/q SAAR, which is above the 2.2% q/q SAAR for the five-year period preceding the pandemic.
- Elevated job vacancies pointing to labour demand that is still outpacing supply.
Could the Australian labour market be facing a turning point? Evidence exists, but a trend hasn’t been established as to conclusively bet on a reversal. For one, the last three months of job growth have been effectively flat, leading to stalled growth in hours worked. Another engine of labour force participation, migration, is expected to ramp up in the short-term which could lead to an increase in the unemployment rate. This doesn’t bode well against a backdrop of potentially reversing labour demand via declining job vacancies and advertisements. The labour market, by most metrics, is indeed still tight, but should recent evidence manifest as labour slack trends, the RBA will account for that in their data dependant policy setting stance that was set forward last meeting.
Most important of all may be whether Q3 wage growth accelerates again on Tuesday (chart 15). Recall that when New Zealand’s Q3 wage growth figures accelerated they drove higher short-term rates in both NZ and Australia given the connections to inflation.
Other
GDP readings will also be updated by select countries beginning with Japan (Monday), where the economy is expected to slow to just over 1.0% q/q SAAR. A slowdown is likely attributed to carry over effects from strong Q2 GDP growth (3.2% q/q SAAR) and overall global growth headwinds. Russia’s economy (Wednesday) likely slid another 4.8% y/y after contracting over 4.0% in the preceding quarter. Norway and Chile release Q3 GDP updates on Friday.
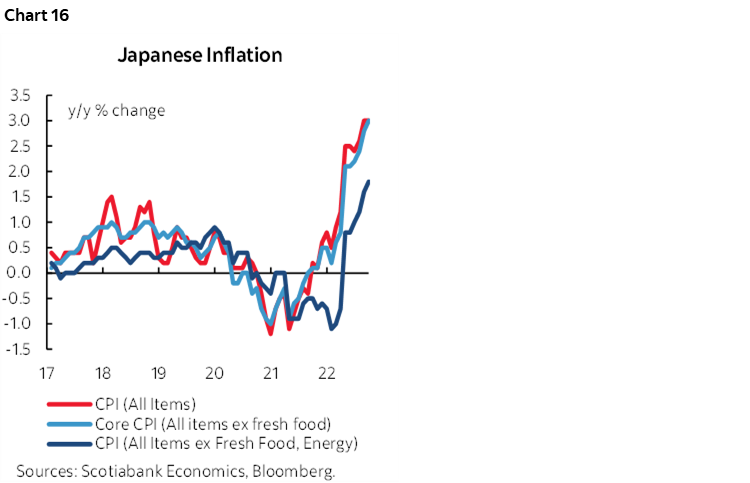
India’s CPI inflation rate (Monday) is expected edge down to 6.8% y/y from the 7.4% y/y September peak. Inflation should slow back into the RBI’s 4.0 +/– 2.0% by Q1-2023 which should allow the bank to downshift the size of policy rate hikes. Sweden (Tuesday) has yet to see inflation peak, with their preferred underlying inflation measure reaching 9.7% y/y in September, with upside risk in the near-term. Japan inflation (Thursday) probably won’t show any signs of respite. Headline and core inflation (excl. food), both increased to 3.0% y/y in September, the highest since 2014 (chart 16). The yen hasn’t gained much ground since peaking at 150 levels (currently ~145), which has invited higher levels of import-driven inflation.
Remaining global developments will be fairly light. China kicks off with a trio of releases for October to start informing Q4 GDP growth (fixed asset investment, retail sales, and industrial production) on Tuesday. The following day brings an update of September economic activity out of Peru. UK retail activity (Friday) rounds out the week.

DISCLAIMER
This report has been prepared by Scotiabank Economics as a resource for the clients of Scotiabank. Opinions, estimates and projections contained herein are our own as of the date hereof and are subject to change without notice. The information and opinions contained herein have been compiled or arrived at from sources believed reliable but no representation or warranty, express or implied, is made as to their accuracy or completeness. Neither Scotiabank nor any of its officers, directors, partners, employees or affiliates accepts any liability whatsoever for any direct or consequential loss arising from any use of this report or its contents.
These reports are provided to you for informational purposes only. This report is not, and is not constructed as, an offer to sell or solicitation of any offer to buy any financial instrument, nor shall this report be construed as an opinion as to whether you should enter into any swap or trading strategy involving a swap or any other transaction. The information contained in this report is not intended to be, and does not constitute, a recommendation of a swap or trading strategy involving a swap within the meaning of U.S. Commodity Futures Trading Commission Regulation 23.434 and Appendix A thereto. This material is not intended to be individually tailored to your needs or characteristics and should not be viewed as a “call to action” or suggestion that you enter into a swap or trading strategy involving a swap or any other transaction. Scotiabank may engage in transactions in a manner inconsistent with the views discussed this report and may have positions, or be in the process of acquiring or disposing of positions, referred to in this report.
Scotiabank, its affiliates and any of their respective officers, directors and employees may from time to time take positions in currencies, act as managers, co-managers or underwriters of a public offering or act as principals or agents, deal in, own or act as market makers or advisors, brokers or commercial and/or investment bankers in relation to securities or related derivatives. As a result of these actions, Scotiabank may receive remuneration. All Scotiabank products and services are subject to the terms of applicable agreements and local regulations. Officers, directors and employees of Scotiabank and its affiliates may serve as directors of corporations.
Any securities discussed in this report may not be suitable for all investors. Scotiabank recommends that investors independently evaluate any issuer and security discussed in this report, and consult with any advisors they deem necessary prior to making any investment.
This report and all information, opinions and conclusions contained in it are protected by copyright. This information may not be reproduced without the prior express written consent of Scotiabank.
™ Trademark of The Bank of Nova Scotia. Used under license, where applicable.
Scotiabank, together with “Global Banking and Markets”, is a marketing name for the global corporate and investment banking and capital markets businesses of The Bank of Nova Scotia and certain of its affiliates in the countries where they operate, including; Scotiabank Europe plc; Scotiabank (Ireland) Designated Activity Company; Scotiabank Inverlat S.A., Institución de Banca Múltiple, Grupo Financiero Scotiabank Inverlat, Scotia Inverlat Casa de Bolsa, S.A. de C.V., Grupo Financiero Scotiabank Inverlat, Scotia Inverlat Derivados S.A. de C.V. – all members of the Scotiabank group and authorized users of the Scotiabank mark. The Bank of Nova Scotia is incorporated in Canada with limited liability and is authorised and regulated by the Office of the Superintendent of Financial Institutions Canada. The Bank of Nova Scotia is authorized by the UK Prudential Regulation Authority and is subject to regulation by the UK Financial Conduct Authority and limited regulation by the UK Prudential Regulation Authority. Details about the extent of The Bank of Nova Scotia's regulation by the UK Prudential Regulation Authority are available from us on request. Scotiabank Europe plc is authorized by the UK Prudential Regulation Authority and regulated by the UK Financial Conduct Authority and the UK Prudential Regulation Authority.
Scotiabank Inverlat, S.A., Scotia Inverlat Casa de Bolsa, S.A. de C.V, Grupo Financiero Scotiabank Inverlat, and Scotia Inverlat Derivados, S.A. de C.V., are each authorized and regulated by the Mexican financial authorities.
Not all products and services are offered in all jurisdictions. Services described are available in jurisdictions where permitted by law.