Next Week's Risk Dashboard
- BoC: Why Hike? Why Not?!!
- The Q2 US bank earnings season
- US CPI: watch the twin core measures
- RBNZ, Peru and BoK expected to hold
- A dovish week for China data
- UK job markets still on a tear?
- Other global macro
Chart of the Week
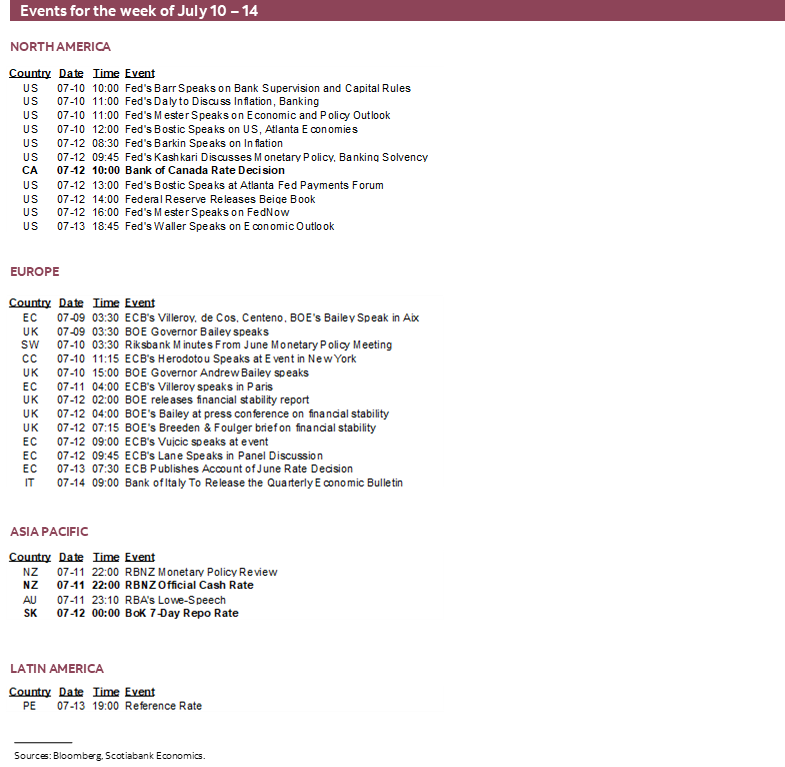
The week’s three main developments will include US CPI on Tuesday, the Bank of Canada’s policy decision on Wednesday and the start of the US bank earnings season on Friday. Other central banks are expected to be on hold (RBNZ, Peru, BoK) while global macro indicator risks will be primarily slanted toward the Chinese and UK economies.
BANK OF CANADA—WHY HIKE? WHY NOT?!!
The world’s largest outdoor rodeo has kicked off with the Calgary Stampede that will continue through July 16th. I’ve been and had a blast, except maybe for the bacon beer as some good things in life should perhaps never be mixed. Anyway, one who can’t be accused of attending his first rodeo is Bank of Canada Governor Macklem as he grapples with his team’s next decision. He’s been through a lot during his career and has a good team to help navigate through today’s differences. C’mon Tiff, wear the cowboy hat in the presser!
Indeed the Bank of Canada comes back with another policy decision on Wednesday. This time it will be armed to the eye teeth with new forecasts in the July Monetary Policy Report and a full set of communications including a press conference held by Governor Macklem and Senior Deputy Governor Rogers.
I expect the BoC to hike by another 25bps at this meeting, but it’s going to be another potentially close call. Markets have pushed toward 70% odds of a hike at this meeting. There is greater unanimity among private forecasters this time than the last time around. Sixteen out of twenty-four forecasts expect a hike including all six of the nation’s largest bank economics groups. Sounds good, right? Keep in mind that this is a central bank that enjoys surprising and has done so on multiple occasions.
There are many reasons for why the Bank of Canada has come off the sidelines and reintroduced additional tightening and why they are likely to hike again this week.
Controlling Markets
It wasn’t long ago that markets were pricing BoC rate cuts to have been delivered by now. Note the plural reference. This easing of financial conditions was premature and the BoC had to lean against it in the face of the previously cited arguments. They have succeeded in doing so as markets have cried Uncle and are no longer pricing cuts this year or for much of next year for that matter.
Now the challenge is consistency. To not hike this coming week when a hike is mostly priced could risk inviting renewed easing of financial conditions and set the BoC’s efforts to tighten policy back to where they were before the June hike. It would be taken as a sign that the BoC is wavering once more. They have the rest of the summer to waver in my opinion, since the next decision isn’t due until September 6th by which point they’ll have a lot more data to inform future moves. Waver now, and the BoC will be a sitting duck for the next eight weeks until the next decision and I don’t think they want to go on summer vacation in such fashion.
Growth Has Vastly Exceeded Forecasts
The BoC had introduced a conditional pause after hiking in January and conditioned the pause on its tracking of growth and inflation coming in line with their views. That condition became seriously violated as everyone’s forecasts for Canadian GDP growth have been plainly awful so far this year.
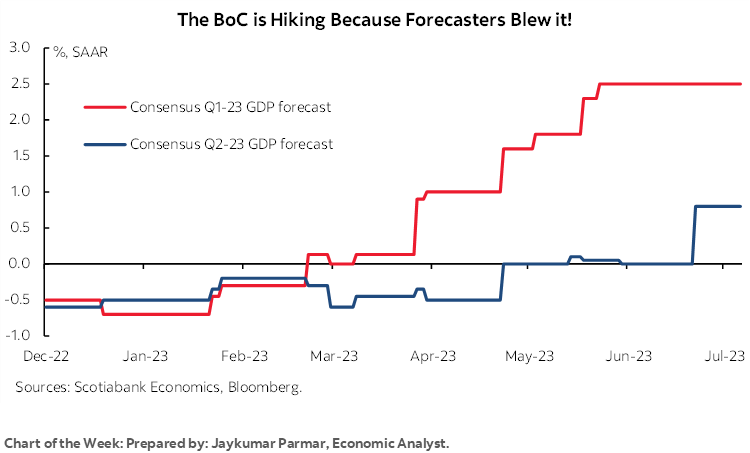
To buttress this point, note that the BoC’s January MPR had forecast Q1 GDP growth of just 0.5% and then they revised that up to 2.3% in the April MPR before actual Q1 GDP was released on May 31st. Actual Q1 GDP growth turned out to be a whopping 3.1%. Consensus and Scotiabank Economics also seriously underestimated Q1 GDP growth with forecasters in late 2022 expecting Q1 GDP to contract and then slowly chasing growth higher and still ultimately underestimating momentum. Chart 1 plots the evolution of consensus forecasts for 2023Q1 GDP growth and how the median forecast swung from a contraction to 2.5% until just before the actual 3.1% figure was released.
Q2 has been repeating the same forecast errors. The BoC only publishes quarterly growth two quarters at a time and so the first attempt at forecasting 2023Q2 growth was in the April MPR when they forecast 1%. The evolution of the median consensus forecast for Q2 GDP growth is also shown in chart 1 and it has swung from a contraction until very recently toward a small gain. Many were forecasting back-to-back contractions over H1 for a technical recession. Instead, after 3.1% growth in Q1, we’re now Q2 growth in the range of 1 ½% to 2% for another multi-percentage point forecast error.
These are large forecast misses by everyone as the economy has proven to be much more resilient than anticipated. That offers a signal that perhaps the economy can handle—indeed requires—more tightening than traditional forecast models that are based upon history have been able to predict. This means that the economy is deeper into excess demand conditions than expected which then further delays progress toward building disinflationary slack in the economy and with that lower inflation following long lags to output gap changes.
Sticky Inflation
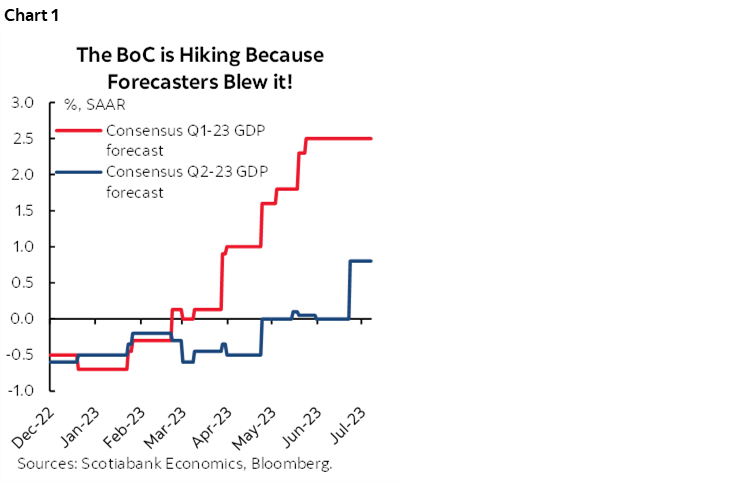
The key to assessing inflation risk is to evaluate trend changes in month-over-month measures of core inflation expressed at an annualized rate. This approach is free from year-ago base effects that will naturally drive inflation lower from last year’s peak rates of increase and the m/m rates enable us to evaluate underlying price pressures at the margin.
These measures have been volatile, including the jump higher in May followed by the weaker readings in June, but the trend has pointed toward stickier and hence more persistent underlying price pressures than many had anticipated to date (chart 2). In fact, the three-month moving average of the annualized m/m changes in trimmed mean and weighted median CPI has been stuck at 3.8% and hence this measure of underlying price pressures remains far above the BoC’s inflation target.
While we’re on the topic of inflation, would the reditnomics crowd kindly stop saying that the BoC is being fooled by the impact of its own rate hikes on mortgage interest in Canadian CPI and that if we take that out then they are on target so stop the hikes. Absolute rubbish. Mortgage interest isn’t even a factor in the trimmed mean and weighted median ‘core’ measures of inflation that they monitor as the way of operationalizing achievement of its 2% headline inflation target.
The Race Against the Clock
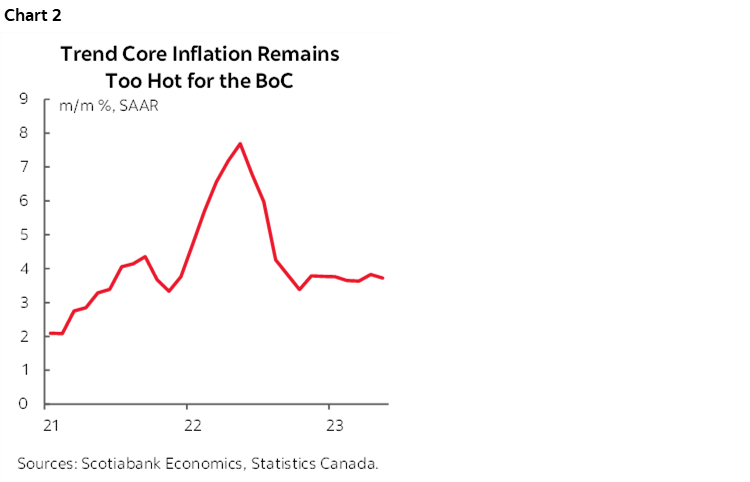
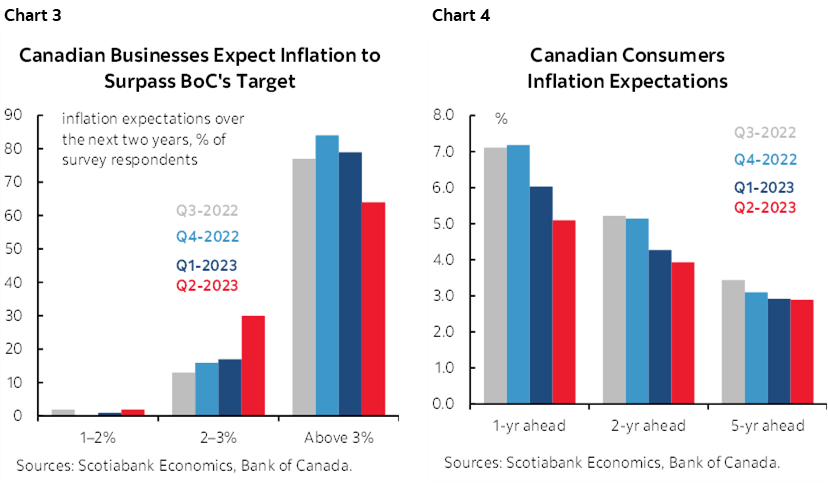
Given that inflation expectations are continuing to indicate little faith in the ability of the BoC to hit its 2% inflation target over the coming years (charts 3, 4), monetary policy is already in a race against the clock to convince businesses and households as they make decisions about potential wage gains, contracts, purchasing and investment. With each passing month that the economy remains resilient and inflation remains uncomfortably high, the BoC runs the risk of never getting control of inflation.
This is a key argument in the hike now versus promise higher for longer debate. To reset inflation expectations much lower requires more front-loaded action. To instead rely upon higher for longer policy rates without further hikes wouldn’t work because for starters no one believes central banks’ forward guidance. Fool me once, shame on you, twice, shame on me. We heard the BoC promise a protracted rate hold until about now or later, only to witness about five percentage points of hikes to date. Believe them when they promise they’ll hang out for longer in future as an alternative to tightening more now? Oh please.
Housing Imbalances Returning
Despite all the headlines about the very real pain that some leveraged households are experiencing, someone’s buying!
Housing markets have been sharply rebounding. I’ve been arguing for some time that consensus was much too bearish toward housing and that this year would bring stabilization but can’t pretend to have anticipated the magnitudes of the rebounds across so many markets this early in 2023.
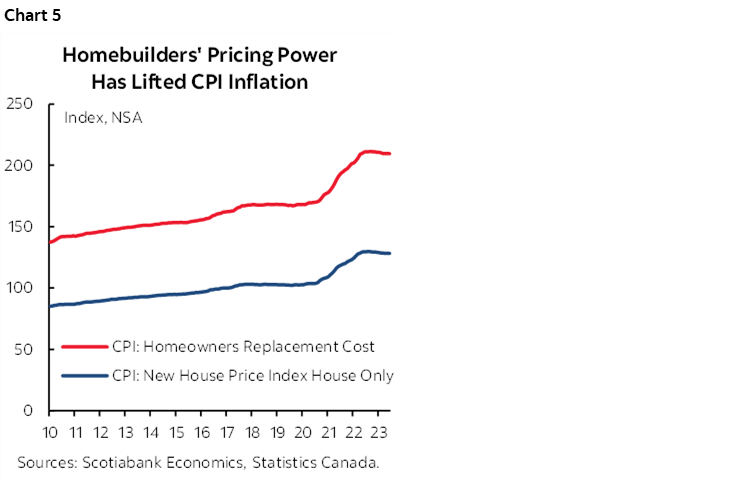
This raises two issues. For one, housing is returning as a driver of economic growth including through the need to build more and expand the housing stock as well as through increased demand for ancillary services (real estate agents, lawyers, lenders etc). This added upside risk to growth means upside risk to inflation for longer than anticipated and traditional macroeconometric models were not anticipating this housing rebound. Second, extrapolative house price expectations are returning as indicated by rising house price forecasts by consumers in the BoC’s recent consumer expectations survey. When expectations are combined with renewed momentum, they serve to complicate the BoC’s goal of returning to 2% inflation within a reasonable period of time. Third, builders have been able to secure more pricing power during the pandemic than over the prior decade and may continue to have greater pricing power as supply lags an infusion of demand from domestic buyers and immigration. Builder prices drive housing’s direct contribution to CPI (chart 5).
Insurance Risk
I’ve been saying for many weeks that upside risks to inflation have been returning and that the Bank of Canada should be open to taking out additional tightening as insurance risk against these upsides. Throughout the whole pandemic I’ve placed emphasis upon the importance of inflation risk as the primary driver of monetary policy actions and that balance of risk is pointed higher now than it was just a few months ago after the performance of the economy year-to-date. An insurance hiking motive is not, however, dominant over the other arguments for tightening. It’s not just an insurance hike if everything has been blowing forecasts for growth, jobs, housing and inflation out of the water!
The Fed Matters
The BoC is an independent central bank that conducts monetary policy in the best interests of the Canadian economy without considering anything that the Fed does. The Maple Leafs won the Stanley Cup last year. It’s -30’C in Toronto right now amid serious global cooling. Justin Bieber is Prime Minister.
Righto, the reality is that there is a limit to the extent to which the BoC can fall behind the Fed within an integrated North American economy and capital market. If the FOMC is intent upon delivering two more hikes as its dot plot shows for this year and therefore takes the Fed funds upper limit up to 5.75% and if the BoC had not hiked in June then the policy rate spread would risk mushrooming toward 125bps. The June BoC hike narrowed that possible differential to 100bps. In my opinion, an expected differential beyond 75bps would risk USDCAD spiralling back toward 1.40 which was toward the level that sparked concern at the BoC last Fall. Canada imports a lot, and while historically the BoC has looked through transitory exchange rate developments, an added upside risk to inflation when expectations are already unmoored would be unwelcome.
Jobs, Jobs, Jobs
Canada’s job market continues to defy the pundits. The latest 60k rise in employment continues to indicate resilient hiring behaviour (recap here).
A common argument is that jobs and the unemployment rate are lagging readings and so this has been informing a bearish narrative from some economists for some time now that jobs are just waiting to crater. It hasn’t happened yet. It might not. That’s because there are real reasons to believe this job cycle is different than in past rate hike cycles.
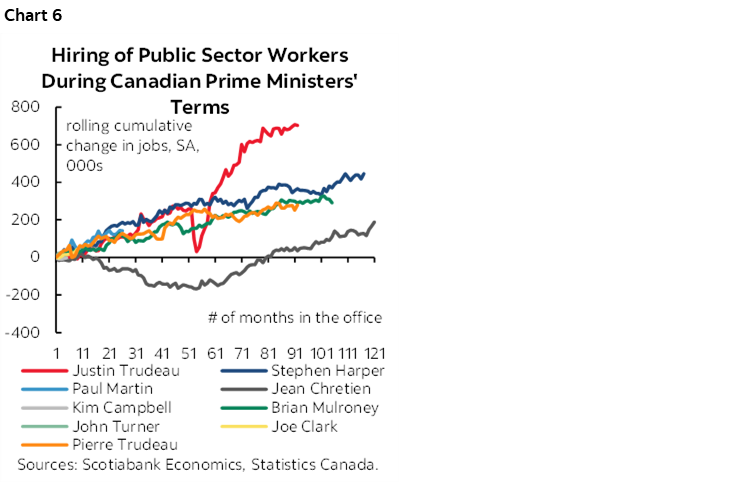
For one thing, governments have soaked up a lot of workers since the start of the pandemic. Out of 950,000 new jobs since February 2020, about 450k have been in the public sector including nearly 200k more civil servants. Since PM Trudeau was elected, governments in Canada have heaped on more public sector jobs at a faster pace than ever (chart 6). One effect is that this has contributed to unfilled job openings in the private sector that signals ongoing shortfalls relative to desired employment levels. Given that no government in Canada has an appetite for austerity as they continue to spend more year upon year, the second effect to all of this hiring is to create job security in a greater portion of the workforce which is why unions have felt secure enough to strike across the country.
For another, we’ve never had improving supply chains into a tightening cycle that give the ability to produce more. With such ability is a need to hire more given many companies are at or beyond capacity limits.
For another, worker productivity blows in Canada. The decline in output-per-hour-worked has meant that to achieve higher output now, perhaps companies have to hire 1.5 workers for every one worker they might have hired before the pandemic.
An additional possibility could be that higher immigration creates its own opportunity and with that more job growth whether to fill vacancies or expand employment outright.
Of course, in a tight job market like this one, employers might also be highly reticent to let go of anyone out of fear they’ll never get them back.
US INFLATION—TWIN CORE GAUGES WILL BE KEY
Wednesday’s US CPI report for June will probably be the final element of significant calendar-based domestic risk to pricing what the FOMC will deliver on July 26th. Other than CPI, there really isn’t a whole lot else on tap between now and the FOMC in the wake of the disappointing private nonfarm payrolls print but faster wage growth (recap here). The usual cautions will apply to interpreting core CPI given its different methodologies compared to the Fed’s preferred core PCE gauge whereby the weight on shelter is half what it is in CPI as one example.
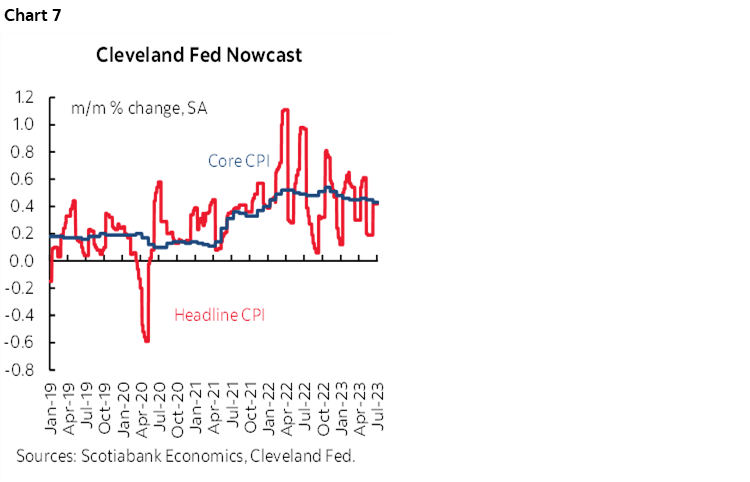
I’ve estimated a gain of 0.3% m/m in seasonally adjusted terms for both headline CPI and core CPI. In year-over-year terms, CPI is forecast to land at 3.1% y/y from 4% the prior month with core CPI at 5% y/y from 5.3% previously. These estimates are a touch lower than the Cleveland Fed’s ‘nowcasts’ (chart 7).
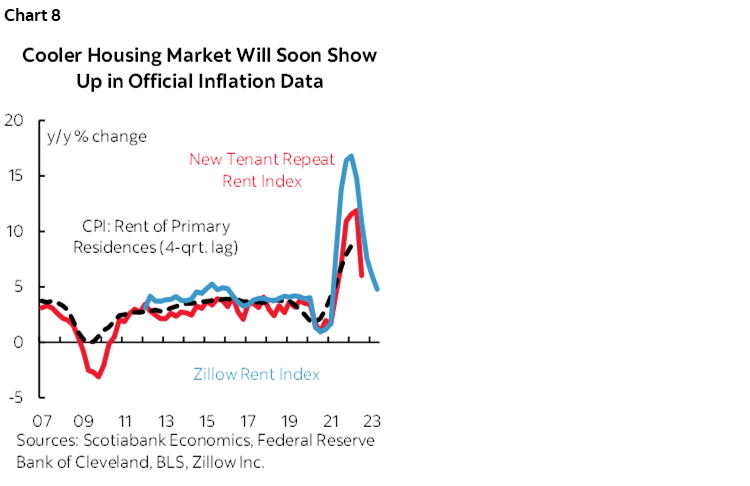
Drivers are expected to include ongoing pressure from rent inflation and owners’ equivalent rent. As this piece argued, rent inflation for new tenants leads BLS CPI rent inflation by about four quarters. The authors have not made available updates to their rent indices, but we can substitute the Zillow rent index as a proxy as shown in chart 8. The turning point in rent inflation should begin to drag CPI downward over 2023H2 but not just yet.
Furthermore, gasoline prices were little changed in June over May and should therefore offer no influence upon headline CPI relative to core CPI. Food price inflation has been ebbing and is also forecast to offer little influence to headline CPI versus core CPI.
Industry sources point toward new vehicle prices offering no statistically significant influence upon month-over-month CPI but used vehicle prices were up by an estimated 3½% m/m SA using the source that the BLS employs as opposed to alternatives like the Mannheim measure at auctions.
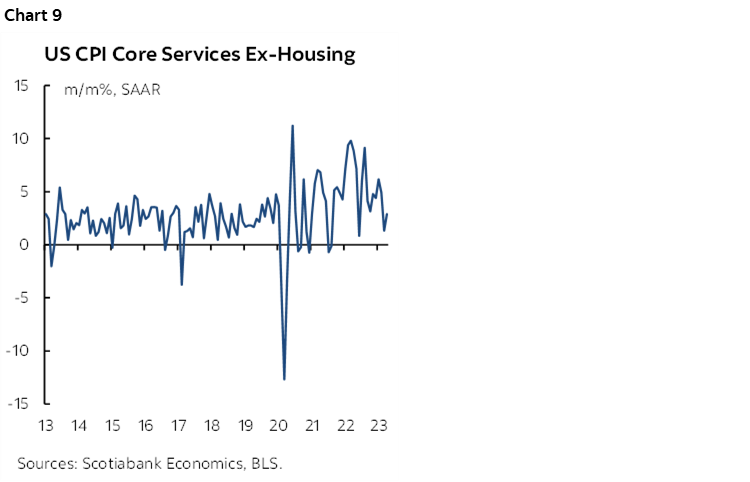
Key, however, will be the breadth to goods price inflation this time given that the last time around there was no goods price contribution to overall inflation when used vehicles were excluded. A further key will be core services CPI inflation ex-housing that has seen a sharp deceleration over the past couple of months (chart 9).
US BANK EARNINGS—TESTING NEWFOUND FREEDOM
The start of the Q2 US bank/financials earnings season arrives on Friday. Each of Wells Fargo, JP Morgan Chase, BlackRock, State Street and Citigroup will release earnings.
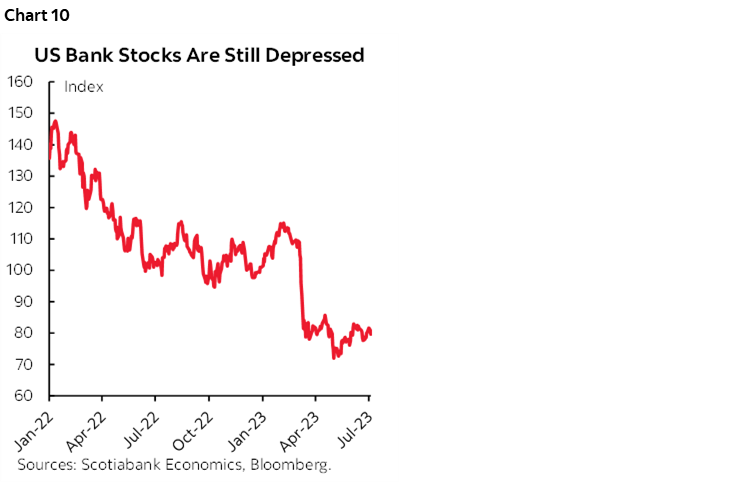
US bank stocks are still depressed in the wake of the problems that began to surface in March and particularly across regional banks including the failures of Silicon Valley Bank and Signature Bank in the US, and the absorption of Credit Suisse by UBS in Switzerland as shown in chart 10 that uses a cap-weighted index of 24 money center and regional banks. Key in this round will be how the opportunities that unfolded for some banks translated into their earnings plus how they manage the newfound freedom with respect to capital plans and payouts after passing the Federal Reserve’s stress tests that some criticize as inadequately testing for today’s shocks.
OTHER CENTRAL BANKS—TREADING WATER
Three other central banks will deliver updated policy decisions over the week with all three expected to be on pause.
RBNZ—Pausing in Recession
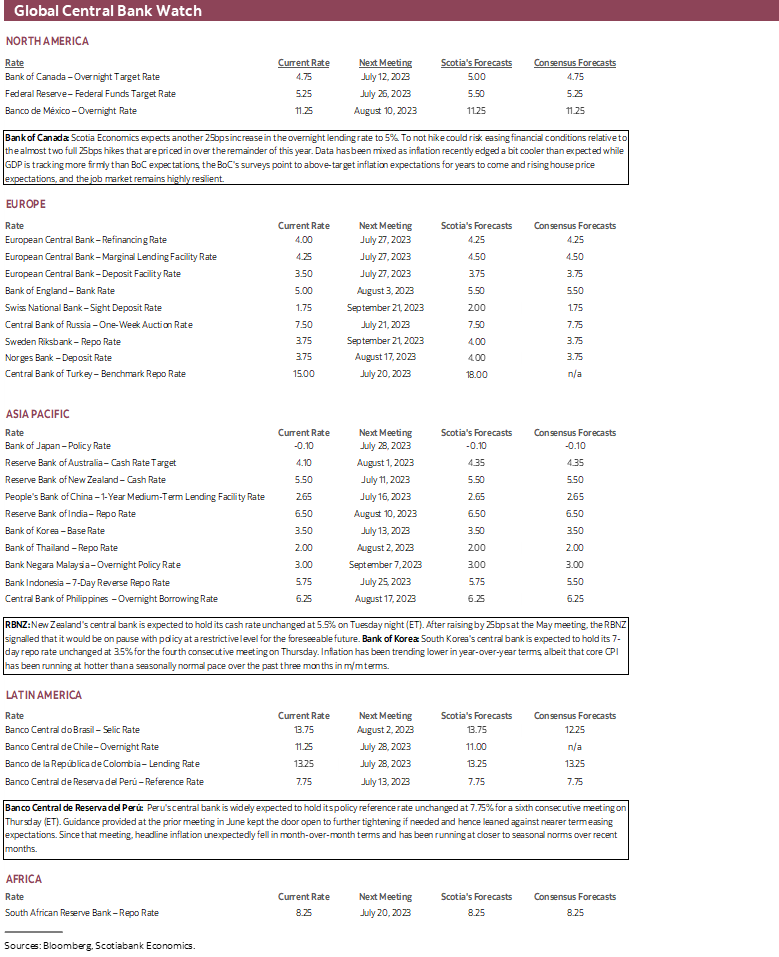
The Reserve Bank of New Zealand is widely expected to hold its target rate unchanged at 5.5% on Tuesday evening (ET). The consensus of economists is unanimous in favouring a hold and markets are assigning a very low probability of a hike.
The May statement balanced a case for hiking 25bps versus the case for a pause and landed in favour of a hike by a 5–2 vote margin. The case for a pause indicated that “monetary policy is having a sufficiently moderating effect on demand and inflation”. They emphasized lagging policy effects, how immigration’s net effects on spending are uncertain, and the expectation that inflation will continue to decline. The New Zealand economy has mildly contracted for two consecutive quarters, and so the economy is starting to open up disinflationary slack.
What settled the bias shone through in the concluding paragraph that was changed to “interest rates will need to remain at a restrictive level for the foreseeable future” from the prior April statement’s reference to how data will guide future moves and that “the extent of this moderation will determine the direction of future monetary policy.” The removal of a bias that was open to future tightening in favour of “remain” guidance signalling a pause was a significant indication that barring material surprises the RBNZ is at a minimum on hold to assess further data and developments and may be done hiking.
Bank of Korea—Extending the Pause
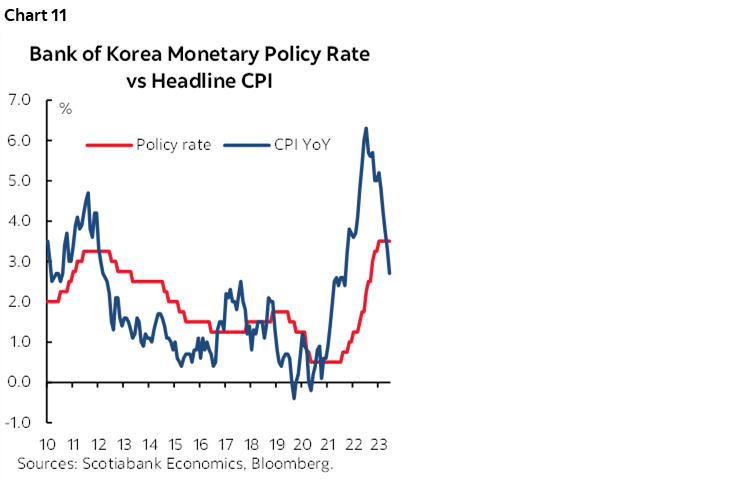
South Korea's central bank is widely expected to hold its 7-day repo rate unchanged at 3.5% for the fourth consecutive meeting on Thursday. Inflation has been trending lower in year-over-year terms, albeit that core CPI has been running at hotter than seasonally normal pace over the past three months in m/m terms (chart 11).
Peru’s Central Bank—Extending the Pause
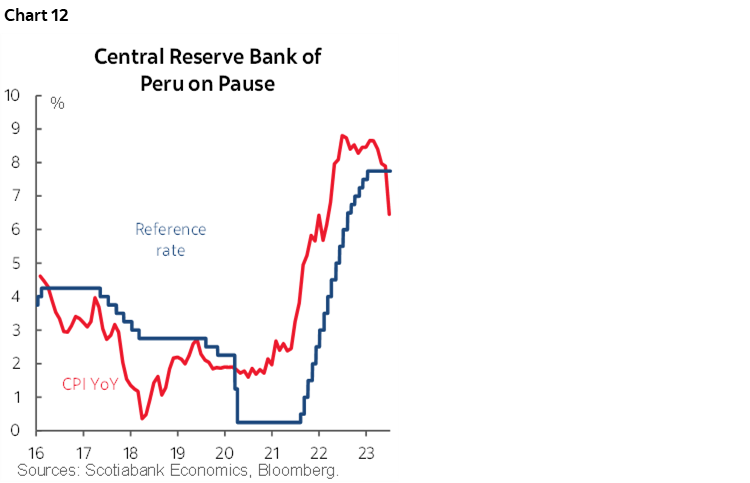
Peru's central bank is widely expected to hold its policy reference rate unchanged at 7.75% for a sixth consecutive meeting on Thursday evening (ET). Guidance provided at the prior meeting in June kept the door open to further tightening if needed and hence leaned against nearer term easing expectations. Since that meeting, headline inflation unexpectedly fell in month-over-month terms and has been running at closer to seasonal norms over recent months (chart 12). Like other central banks, it needs to sound tough in order to lean against market tendencies to prematurely price in easing expectations.
GLOBAL INDICATORS—CHINA AND THE UK IN THE SPOTLIGHT
The line-up of global macroeconomic indicators not already covered will focus primarily upon China and the UK.
This could be a big week for China. CPI (Sunday night ET) is expected to continue to hover around 0% y/y with core at about ½% y/y. Producer prices are expected to continue falling at around a 5% y/y pace and will be released at the same time as CPI. Absent price pressures, exports are expected to weaken further from the -7.5% y/y pace that was registered in May in USD terms while yuan-denominated exports contract by around -1% y/y (Thursday). It’s possible that we may also get aggregate financing and new yuan loan growth figures for June this week.
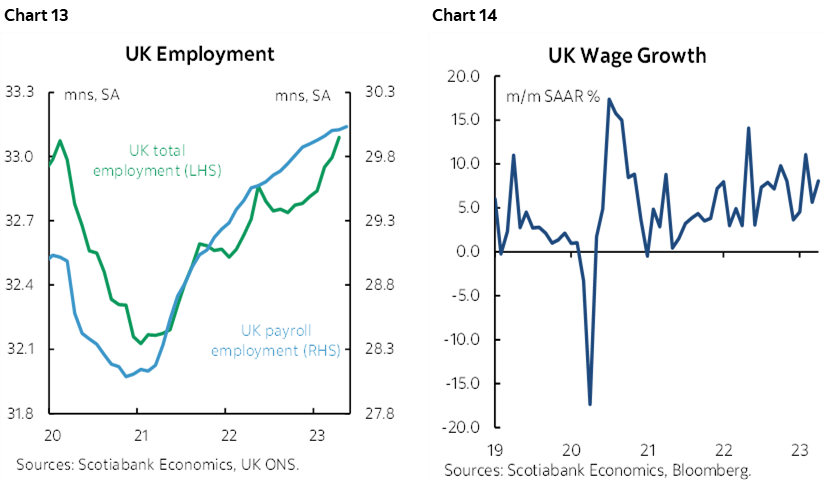
The state of the UK economy is slated for a wholesale update when May and June figures arrive starting on Tuesday. As elsewhere, UK job markets have been ripping including the 94k gain in total employment during April ahead of the May update and with employment hitting a new record high that has fully recovered from the pandemic (chart 13). Wage growth has been strong at over 7% y/y and with May figures poised to extend the pattern (chart 14). Such strong labour markets are part of why the Bank of England is expected to continue hiking with markets pricing about another 150bps of hikes into early next year. Thursday’s data on the service sector, industrial production and trade plus monthly GDP will inform growth risks at the margin with consensus expecting a round of soft readings.
Several other countries will also update CPI inflation figures for June. Norway kicks it off on Monday along with Colombia in the wake of a pair of soft reports from Mexico and Chile. Brazil follows upon Tuesday and then Argentina’s stratospheric inflation (114% y/y) will blow away all of them on Thursday; this is the only country that would do better with Erdogan running it. India (Wednesday) and Sweden (Friday) are also due out.
The Bank of Canada will dominate Canadian markets while the rest of the domestic calendar will be very light. Statistics Canada has already guided that Friday’s manufacturing sales climbed by 0.8% m/m in dollar terms during May which is open to revision. Friday also brings existing home sales for June after four consecutive monthly gains while regional data for June has been mixed as indicated by a solid gain in Calgary, flat sales in Vancouver, and a decline in Toronto—all in seasonally adjusted terms.
CPI and US bank earnings will dominate the US market tone over the coming week with little else on the docket. Other price data will include producer prices during June on Thursday that are expected to post a mild headline and core gain, plus inflation expectations in the University of Michigan’s consumer sentiment reading on Friday. Regional anecdotes in Wednesday’s Beige Book from the Federal Reserve and weekly jobless claims and mortgage applications will complete the line-up along with a a whole line-up of Fed speakers in the wake of jobs and CPI.
DISCLAIMER
This report has been prepared by Scotiabank Economics as a resource for the clients of Scotiabank. Opinions, estimates and projections contained herein are our own as of the date hereof and are subject to change without notice. The information and opinions contained herein have been compiled or arrived at from sources believed reliable but no representation or warranty, express or implied, is made as to their accuracy or completeness. Neither Scotiabank nor any of its officers, directors, partners, employees or affiliates accepts any liability whatsoever for any direct or consequential loss arising from any use of this report or its contents.
These reports are provided to you for informational purposes only. This report is not, and is not constructed as, an offer to sell or solicitation of any offer to buy any financial instrument, nor shall this report be construed as an opinion as to whether you should enter into any swap or trading strategy involving a swap or any other transaction. The information contained in this report is not intended to be, and does not constitute, a recommendation of a swap or trading strategy involving a swap within the meaning of U.S. Commodity Futures Trading Commission Regulation 23.434 and Appendix A thereto. This material is not intended to be individually tailored to your needs or characteristics and should not be viewed as a “call to action” or suggestion that you enter into a swap or trading strategy involving a swap or any other transaction. Scotiabank may engage in transactions in a manner inconsistent with the views discussed this report and may have positions, or be in the process of acquiring or disposing of positions, referred to in this report.
Scotiabank, its affiliates and any of their respective officers, directors and employees may from time to time take positions in currencies, act as managers, co-managers or underwriters of a public offering or act as principals or agents, deal in, own or act as market makers or advisors, brokers or commercial and/or investment bankers in relation to securities or related derivatives. As a result of these actions, Scotiabank may receive remuneration. All Scotiabank products and services are subject to the terms of applicable agreements and local regulations. Officers, directors and employees of Scotiabank and its affiliates may serve as directors of corporations.
Any securities discussed in this report may not be suitable for all investors. Scotiabank recommends that investors independently evaluate any issuer and security discussed in this report, and consult with any advisors they deem necessary prior to making any investment.
This report and all information, opinions and conclusions contained in it are protected by copyright. This information may not be reproduced without the prior express written consent of Scotiabank.
™ Trademark of The Bank of Nova Scotia. Used under license, where applicable.
Scotiabank, together with “Global Banking and Markets”, is a marketing name for the global corporate and investment banking and capital markets businesses of The Bank of Nova Scotia and certain of its affiliates in the countries where they operate, including; Scotiabank Europe plc; Scotiabank (Ireland) Designated Activity Company; Scotiabank Inverlat S.A., Institución de Banca Múltiple, Grupo Financiero Scotiabank Inverlat, Scotia Inverlat Casa de Bolsa, S.A. de C.V., Grupo Financiero Scotiabank Inverlat, Scotia Inverlat Derivados S.A. de C.V. – all members of the Scotiabank group and authorized users of the Scotiabank mark. The Bank of Nova Scotia is incorporated in Canada with limited liability and is authorised and regulated by the Office of the Superintendent of Financial Institutions Canada. The Bank of Nova Scotia is authorized by the UK Prudential Regulation Authority and is subject to regulation by the UK Financial Conduct Authority and limited regulation by the UK Prudential Regulation Authority. Details about the extent of The Bank of Nova Scotia's regulation by the UK Prudential Regulation Authority are available from us on request. Scotiabank Europe plc is authorized by the UK Prudential Regulation Authority and regulated by the UK Financial Conduct Authority and the UK Prudential Regulation Authority.
Scotiabank Inverlat, S.A., Scotia Inverlat Casa de Bolsa, S.A. de C.V, Grupo Financiero Scotiabank Inverlat, and Scotia Inverlat Derivados, S.A. de C.V., are each authorized and regulated by the Mexican financial authorities.
Not all products and services are offered in all jurisdictions. Services described are available in jurisdictions where permitted by law.