Next Week's Risk Dashboard
- Why global bonds are ignoring core inflation, lower risk to global growth
- US debt ceiling dysfunction will hang over markets for months
- BoJ’s sequel to the JGB massacre
- PBoC to ease?
- BoC pricing to be informed…
- …by what BoC surveys say about inflation expectations…
- …and Canadian inflation: soft headline, firmer core?
- US earnings season continues
- UK inflation, wages could influence BoE pricing
- Australia’s tight job market may keep driving wage pressures
- China’s economy probably contracted…
- …but shock could give way to a growth rebound
- US retail sales may have ended the year on a sour note
- Norges Bank winding down hikes
- Negara to hike, ringgit adds caution
- Bank Indonesia expected to hike again
- Turkey’s central bank seems to be done debasing
- Other Global macro readings
Chart of the Week
The question what is going on in bond markets dominates what is on the minds of institutional investors as a new year has already brought with it significant rallies across all of the major 10-year benchmarks outside of China while the dam threatens to burst open on JGBs. A complex set of fresh drivers—many of them having little to directly do with underlying fundamentals—is behind rallies and further developments over the coming week could lead to heightened volatility.
Key will be decisions by the Bank of Japan—that may further pry open the door on regime change—and the People’s Bank of China that may give each other high fives as one exits and the other enters easing mode. The potential implications to all asset classes could be profound if December’s shot across the bow by the BoJ drives further change in Governor Kuroda’s second last decision at the helm.
The path toward subsequent decisions by other central banks will be further informed by inflation and jobs reports out of the UK, Canada and Australia. Top shelf fundamentals will focus primarily upon China’s economy.
Yet the moves across yield curves that have been seen to date this year are mainly being driven by the following considerations that showcase how sensitive curves are to the vagaries of global policy developments beyond the fundamentals and as a big caution against interpreting movement in, say, 2s10s slopes as saying much about the economic outlook or inflation risk. While I had forecast lower US Treasury yields in Q1, for instance, the narrative has taken down a fair amount of new and unexpected information.
Debt Ceiling Dysfunction
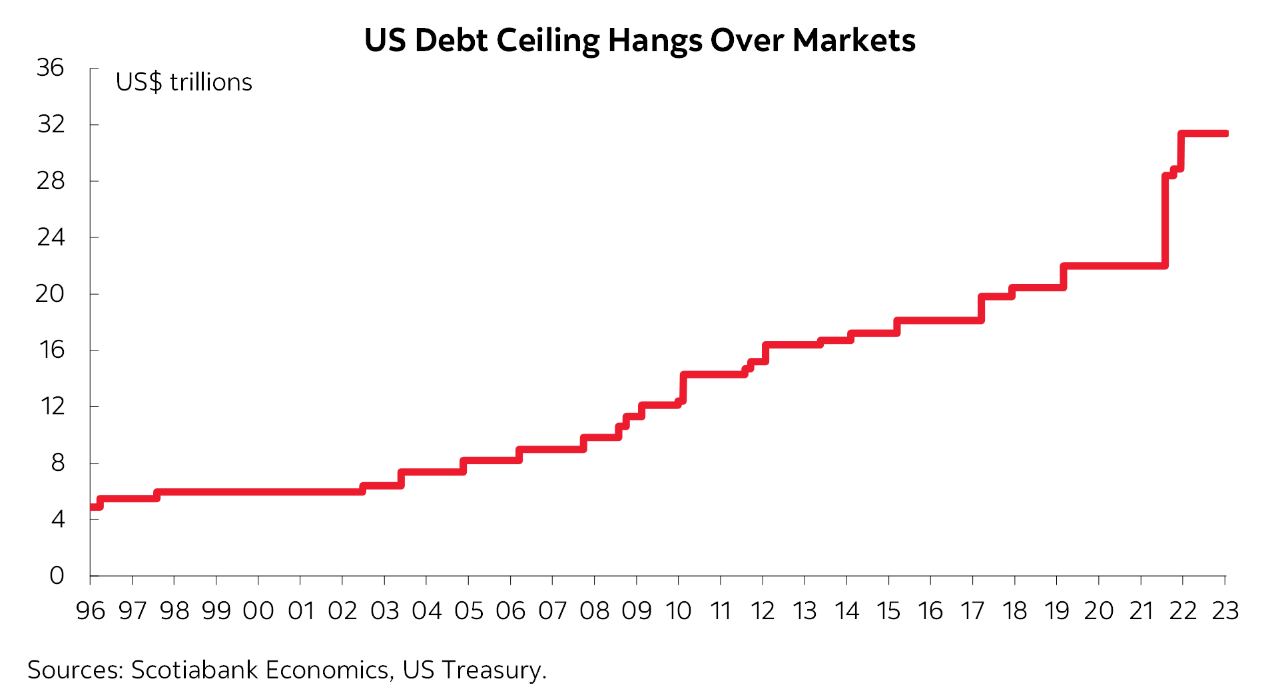
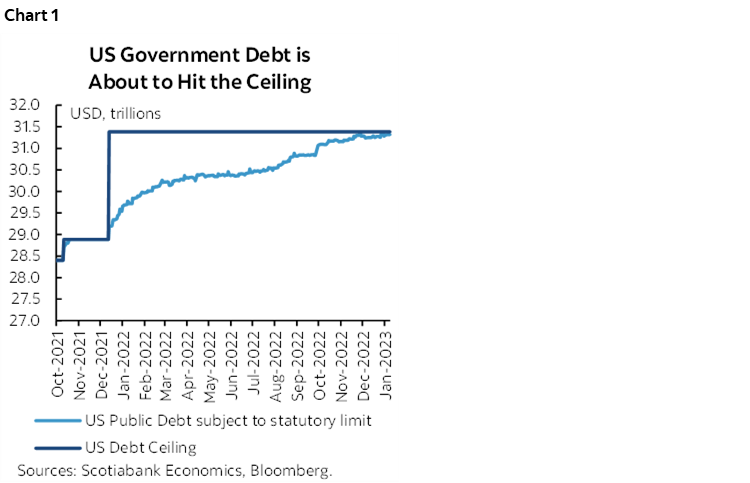
This week’s cover chart shows the history of the debt ceiling and its explosive growth and chart 1 shows that debt subject to this statutory limit is basically now at the whopping US$31.38 trillion limit for a roughly US$26 trillion economy. When at this limit, Treasury will only be able to roll over existing debt without adding to it notwithstanding issuance needs to fund spending.
The debt ceiling became more of a concern as the GOP took the House, prior to which the Democrats’ majority in the House had them using the Gephardt Rule to secure whatever financing was required. House Speak Kevin McCarthy’s take-no-hints deal to become speaker had him promising to be aggressive on the ceiling and hence toward significant spending cuts while agreeing to a lower recall bar on his performance. That promises a fight against the Biden administration’s refusal to cut spending.
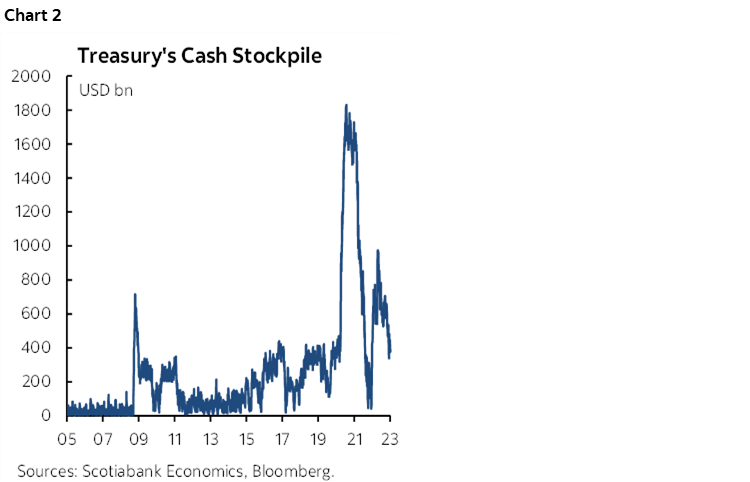
Treasury Secretary Yellen has guided that Treasury will be invoking emergency measures in order to avoid defaulting on the ability to service US government debts (here) and that the so-called ‘X-date’ for when such emergency measures become exhausted could arrive by June. Treasury’s cash position will only buy a limited amount of time before other considerations such as payments prioritization become likely (chart 2). The history of debt ceiling fights has tended to reveal brinksmanship with uncertainty pushing the deadline limits. This time may be set for one of the greatest fights with potential to bring financial market upheaval and government shutdowns among other considerations.
In the meantime, relative debt scarcity due to suspended issuance, safe haven seeking and high cash in overnight funding markets are contributing to rich curves.
Germany’s Change of Heart
Major moves lower across European bond yields occurred when German Chancellor Olaf Scholz threw his support for new joint financing instruments that would spread sovereign financing risk across the EU and lower risks facing individual highly indebted economies at least in the shorter term and namely across southern Europe. I’m always leery toward any sign that Europe is raising moral hazard risk across its most profligate regions, but markets might think about that at some later date.
ECB Soft on QT Before Even Starting
Yields have also pushed lower because, despite being a hawk, Austria’s central bank head Holzmann wavered on QT plans in public comments that advised caution on the path forward. If plans to unwind bond holdings within the Pandemic Emergency Purchase Program proceed more cautiously than previously assumed then it would mean less ECB supply being diverted back into private markets.
Selectively Interpreting Inflation
So far this year markets have only tended to consider softer headline inflation readings out of Europe and the US despite firmer core inflation and the fact that lower energy costs drove weaker CPI. A wave of global inflation readings this week may further inform this bias.
Ignoring the Fundamentals
What is not being considered in my view is that the outlook for the world economy may be getting a bit of a shot in the arm with new information over recent weeks. China’s outlook is worse in the near-term, but what it is doing may open the door to better growth ahead (see below). Lower energy prices in absolute terms and especially relative to what was feared ahead of winter may be easing the downside risks to Europe’s economies. Lower bond yields reflect an easing of financial conditions driven in part by the considerations above which may also help to set a floor to global growth. If the only thing that mattered to, say, 2s10s slopes was world growth then it might have been reasonable to expect steeper curves than at present.
The coming week will advance our understanding of factors influencing bond markets after it gets off to a relatively slow start with the US shut for Martin Luther King Jr Day on Monday.
CENTRAL BANKS—BoJ VERSUS PBOC
Six central banks deliver policy decisions over the coming week because, well, they figure markets have had it too easy for a few weeks without having to listen to them. Of the six, two may be influential to global markets and the other four are regional in nature. Watch the Bank of Japan in particular since developments either this week or soon thereafter could have major influences upon world financial markets.
Bank of Japan—Another Shocker?
The Bank of Japan could top the list of the week’s possibly most influential decisions when it weighs in toward the end of the week. This meeting is the sequel to the JGB massacre on December 19th when the BoJ left its policy balance rate target unchanged and also left the mid-point of its 10-year yield target at 0% but widened the bands around 0% +/-25bps to +/- 50bps on that target. Markets immediately took the yield to the top end of that new range. Kuroda emphasized at the time that this was not a fundamental pivot or an effort to reduce stimulus but was instead aimed at addressing the deterioration of bond market functioning including yield curve distortions alongside impaired liquidity and trading conditions. One could quip about what took them so long after years of such distortions and so the sudden timing was somewhat curious.
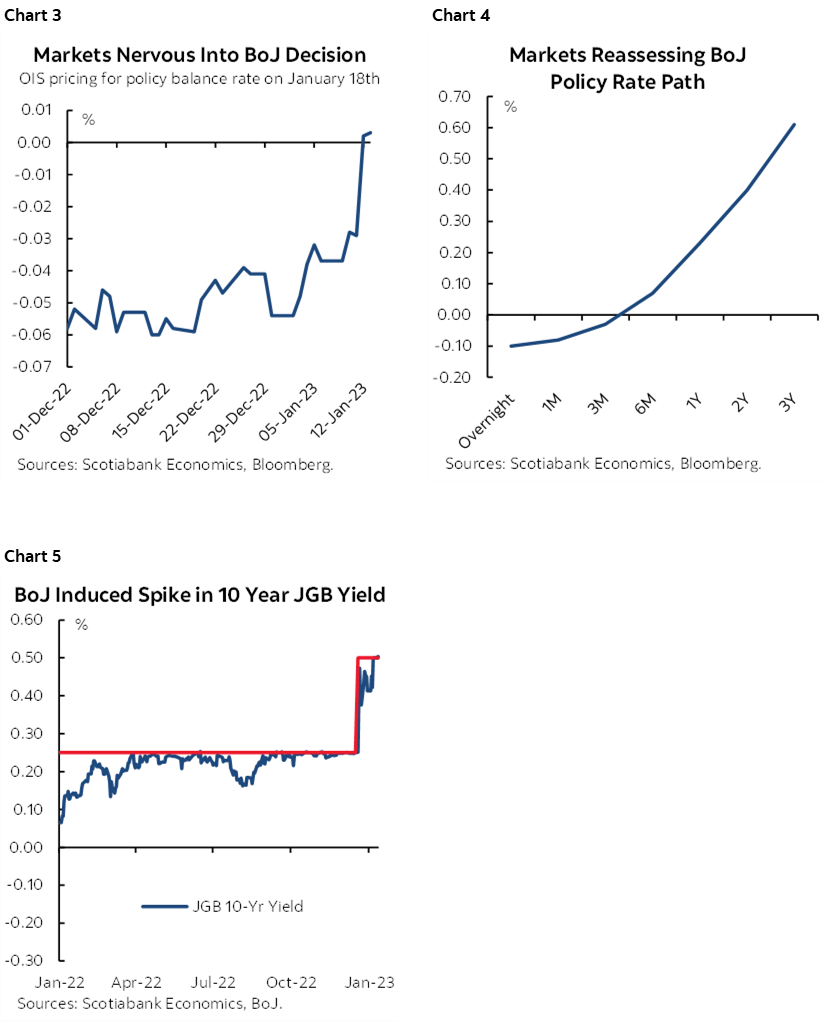
Markets are not necessarily believing him and think that Kuroda may be up to something else. There has been a slight bias toward betting that the policy rate may be raised by perhaps 10bps as soon as this meeting (chart 3) while markets price a moderate path toward rising rates in future (chart 4). The 10-year JGB yield has also recently flirted with rising above the 50bps ceiling by a few basis points in intraday trading (chart 5). That is due to speculation that the ceiling may be raised again or that the BoJ may entirely abandon yield curve control (YCC).
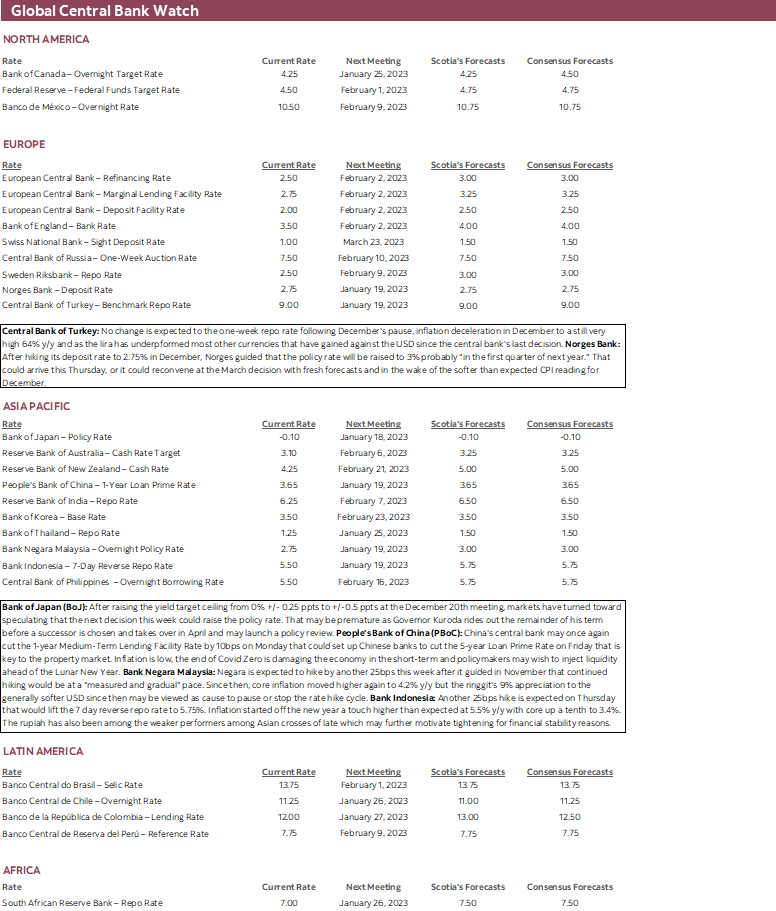
That’s probably highly premature as Governor Kuroda rides out the remainder of his term before a successor is chosen and takes over after Kuroda’s term is up on April 8th and may launch a policy review. Deputy Governor Hiroshi Nakaso is pegged as the leading candidate for the role. Speculation is nevertheless alive including in an article in the Yomiuri newspaper that indicated the BoJ is considering further policy changes.
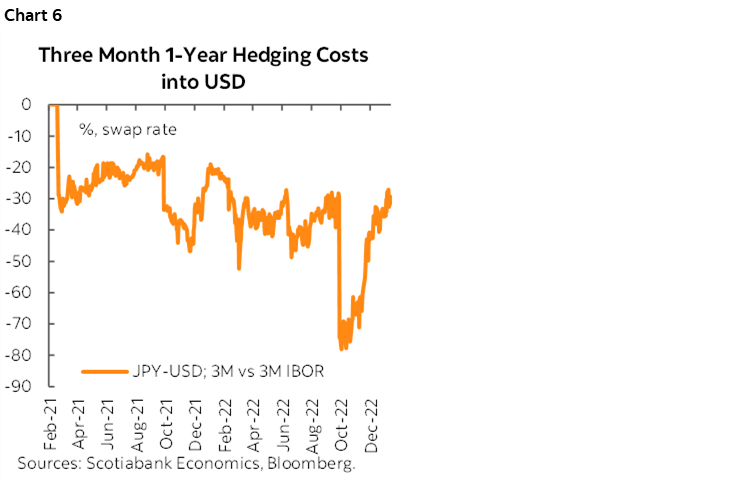
Needless to say that a move such as ending YCC would be a major shock to the global financial system and hence not just holders of JGBs. It could upend currency markets by weakening the USD in favour of the yen with ripple effects across other major crosses. This speculation is also probably among the drivers of lower Treasury yields as carry out of Japan into US Treasuries (and elsewhere) has become relatively more attractive. Chart 6 also demonstrates implications for hedging costs out of yen into USD given the volatility following the September meeting when Kuroda pushed back against talk of changes and then the path to the December meeting when he delivered change. If the Bank of Japan eases, let alone eliminates yield curve control, then it could drive further richness and flatteners across global bond markets. The CPI reading for December that arrives after the BoJ decisions could influence market expectations for the next meeting in March.
People's Bank of China—Easing Toward the Other Side
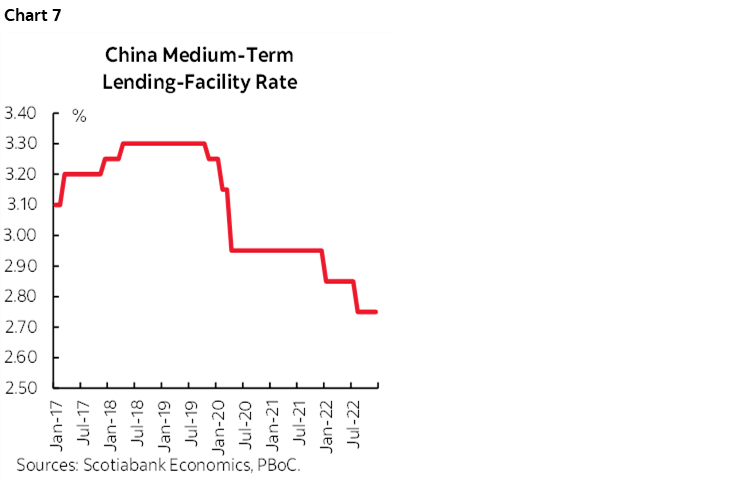
China's central bank may once again cut the 1-year Medium-Term Lending Facility Rate by 10bps on Monday that could set up Chinese banks to cut the 5-year Loan Prime Rate on Friday that is key to the property market (chart 7). Inflation is low, the end of Covid Zero is damaging the economy in the short-term and policymakers may wish to inject liquidity ahead of the Lunar New Year with travel back home having already begun in limited numbers compared to pre-pandemic periods.
Developments in China are key to the global outlook with spinoff effects upon inflation markets and commodities and hence countries that are relatively more influenced by commodity production such as several across my employer’s primary Americas footprint. Disruptions to labour markets and supply chains early this year through the abandonment of Covid Zero practices may drive greater herd immunity and position China’s economy on a stronger footing as the year progresses especially as it has relaxed its so-called ‘three red lines’ approach to property markets and property market financing in an effort to free up capital into the sector which is a key driver of household wealth. Stage 1 of the end of Covid Zero could pose inflation risk to the world economy and so could Stage 2 on the recovery side as China swings toward higher demand for commodities. Easing monetary policy now could reinforce this other recovery side of the picture through lagging effects of policy actions that are undertaken today.
Norges Bank—See Ya Again Sometime!
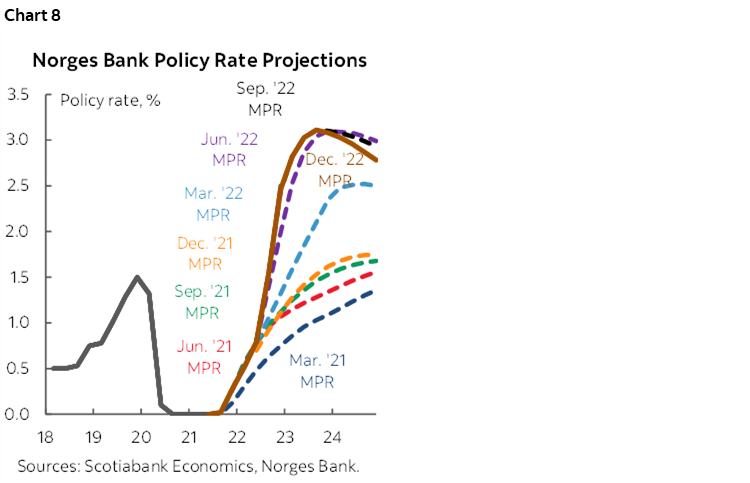
After hiking its deposit rate to 2.75% in December, Norges guided that the policy rate will be raised to 3% probably "in the first quarter of next year" while also revising its projection to reflect rate cuts later on (chart 8). That last hike could arrive this Thursday, or Norges could delay until the March decision with fresh forecasts and in the wake of the softer than expected CPI reading for December.
Bank Negara Malaysia—Could the Ringgit Soften Guidance?
Negara is expected to hike by another 25bps this week after it guided in November that continued hiking would be at a "measured and gradual" pace. Since then, core inflation moved higher again to 4.2% y/y but the ringgit's 9% appreciation to the generally softer USD since then may be viewed as cause to pause or stop the rate hike cycle. Another inflation report for December lands the day after Negara’s decision.
Bank Indonesia—Inflation Keeps Hikes on the Table
Another 25bps hike is expected on Thursday that would lift the 7-day reverse repo rate to 5.75%. Inflation started off the new year a touch higher than expected at 5.5% y/y with core up a tenth to 3.4%. The rupiah has also been among the weaker performers among Asian crosses of late which may further motivate tightening for financial stability reasons.
Central Bank of Turkey—Done Debasing?
I like tossing this one in just for ecotainment purposes given how wonky its behaviour has been at the direction of President Erdogan. No change is expected to the one-week repo rate following December's pause, inflation’s deceleration in December to a still very high 64% y/y and as the lira has underperformed most other currencies that have gained against the USD since the central bank's last decision.
EARNINGS—A MIXED START
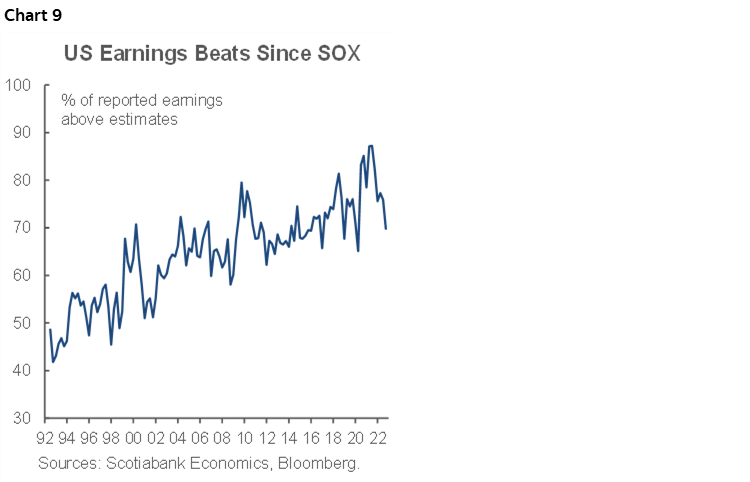
US earnings season continues this week. Twenty-six firms listed on the S&P will release with a continued focus upon financials as per the usual start to the season. It has been a rather mixed start so far on the heels of releases at the end of this past week, bearing in mind that the broad tone of earnings releases often tends to offer more beats than misses especially post-SOX legislation (chart 9). Higher inflation benefits nominal earnings and thus far US economic growth has proven to be fairly resilient.
Morgan Stanley and Goldman Sachs kick it off on Tuesday as two of the week’s bigger names. Netflix releases on Thursday. United Airlines (Tuesday) follows the recent earnings beat by Delta.
BoC SURVEYS TO INFORM PRESSURES ON INFLATION
The Bank of Canada releases its consumer and business surveys for 2022Q4 on Monday. They may influence BoC thinking around wage and price expectations in particular and on the path to the next week’s decisions.
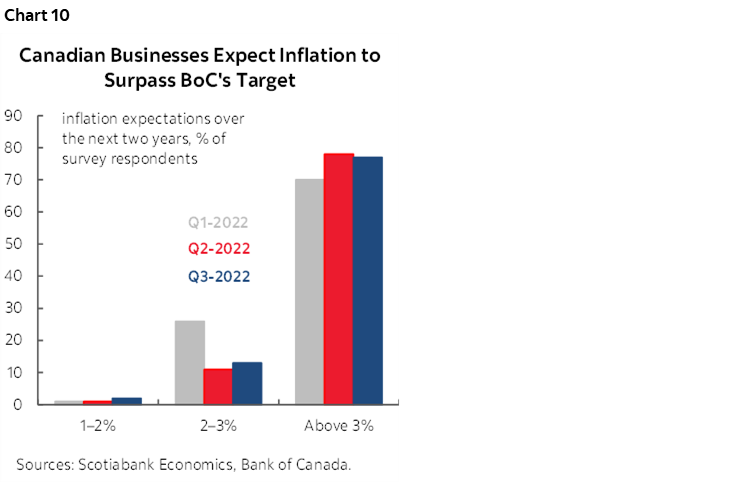
The Business Outlook Survey will be somewhat stale on arrival as the small sample was interviewed over roughly mid-November to early December and a lot has happened since then. Nevertheless, what businesses told the BoC in terms of expected inflationary pressures will be important in terms of how expectations influence BoC policy and given the vast majority of respondents who think the BoC won’t hit its 2% inflation target over the 2022–23 period (chart 10).
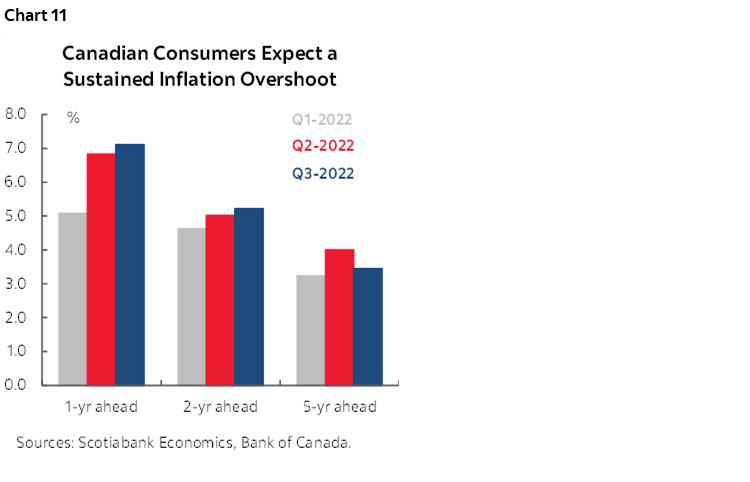
The BoC’s Canadian Survey of Consumer Expectations may be of an even older vintage as the prior year’s sample period was from November 11th –24th. Nevertheless, here too we should watch what happens to measures of expected price pressures given the pattern to data whereby consumers expect persistent inflation above the BoC’s 2% target throughout the next five years (chart 11).
Also watch these surveys for measures of wage expectations, capacity constraints, expected future sales growth, investment intentions, hiring plans and labour shortages.
CANADIAN INFLATION—SOFT HEADLINE, FIRMER CORE?
Canada updates CPI inflation on Tuesday as the last major report to land before the Bank of Canada goes into blackout ahead of the policy decision on January 25th.
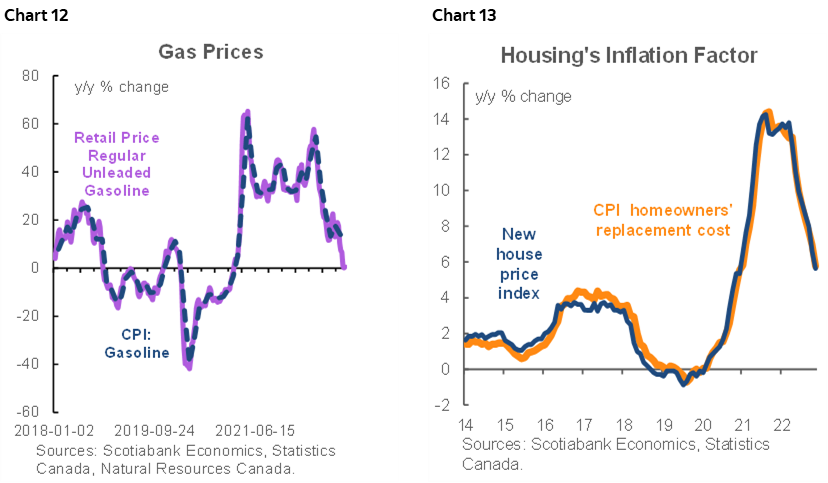
I’ve estimated that headline CPI will drop by 0.7% m/m NSA which would be even weaker than a typical month of December. Prices often weaken in December as discounting of seasonal winter products kicks in and retailers begin to clear out inventories for late shoppers. Gas prices also fell by about 15% m/m in seasonally unadjusted terms and should subtract about 0.6% m/m from CPI inflation (chart 12). Food and electricity prices might add a touch of upside and vehicles are not expected to be a material influence on net between new and used prices. Housing is likely to continue to soften but the way Canada captures it in CPI carries a much lower weight than in US CPI because Canada uses replacement costs drawn from builder prices rather than owners’ equivalent rent (chart 13).
Still, -0.7% m/m NSA would be weaker than seasonally normal and so applying a seasonal adjustment factor to this estimate would reveal a 0.4% m/m SA decline. CPI would decelerate from 6.8% y/y in November to about 6.2% in December for the softest y/y reading since February. Traditional core CPI (ex-food and energy) is likely to prove firmer than headline and I’ve guesstimated a mild up-tick in m/m terms and a slight cooling from the prior month’s 5.4% y/y reading.
Because of these CPI estimates, I’ve been arguing that there may be more post-data downside than upside market risk relative to OIS contract pricing for most of a quarter-point hike. I still lean toward favouring a 25bps hike especially after absurdly strong job gains, but markets may be more certain toward this than they might be post-CPI. That’s because at least so far this year markets have been behaving in somewhat superficial fashion and have not really shown much of a tendency to scratch beneath the surface in terms of inflation estimates; witness Europe, where firmer core readings were ignored by fixed income markets that showed a whippier reaction to softer headline readings as they began rolling out from December 30th through last week. There was a similar reaction to US CPI that ignored nearly 4% m/m annualized core inflation.
A BIG WEEK FOR GLOBAL MACRO READINGS
Most major regions of the world economy will consider some combination of significant macro readings but the key gauges are likely to come from China in combination with updated assessments of job markets in the UK and Down Under as well as updated assessments of the health of consumer spending in the US, UK, Canada and Mexico.
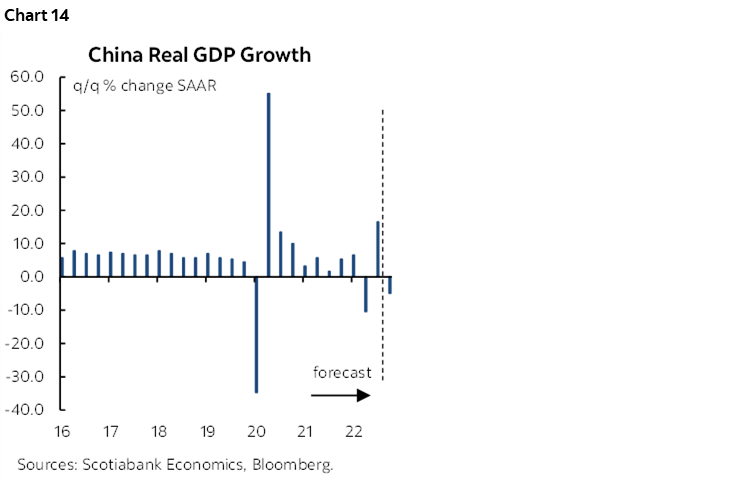
China’s economy probably contracted in Q4 as Covid Zero policies were met by protests and the eventual abandonment of the restrictions. Consensus expects GDP to contract by 1.2% q/q non-annualized when the figures arrive on Monday evening (eastern time). Chart 14. December readings for industrial production, retail sales, and the jobless rate will help us understand momentum into 2023 in terms of math effects that are baked into 2023Q1 GDP growth and they are expected to be weak.
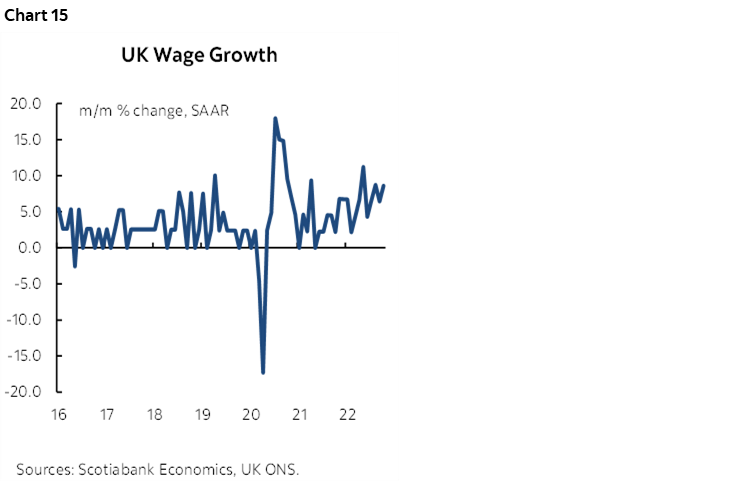
A batch of key UK readings could set the tone for the February 2nd Bank of England decision with markets presently priced for most of a 50bps Bank Rate hike. They follow a better-than-expected reading for GDP growth in November this past week. Inflation is likely to ease in year-over-year terms but remain unacceptably high (Wednesday). Total job growth in November and payrolls in December (Tuesday) will help to further understand whether the uptick in total employment in October was transitory. Wage gains have been accelerating (chart 15). Friday’s retail sales for December are expected to post a mild gain to end the holiday season.
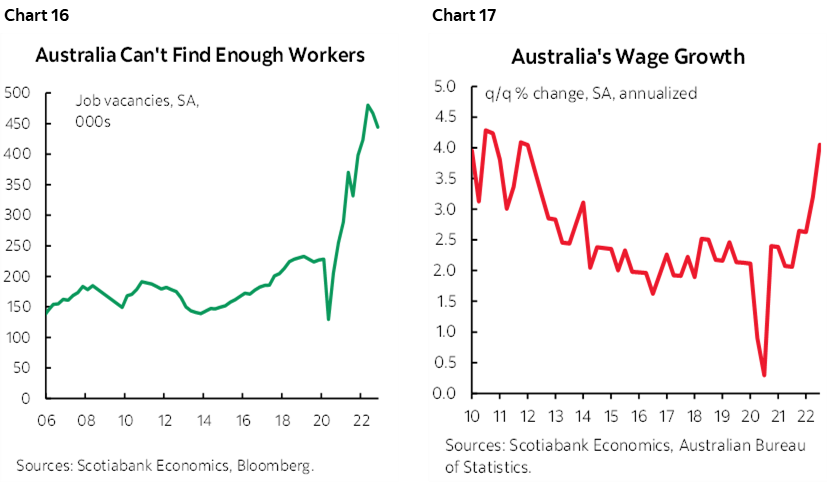
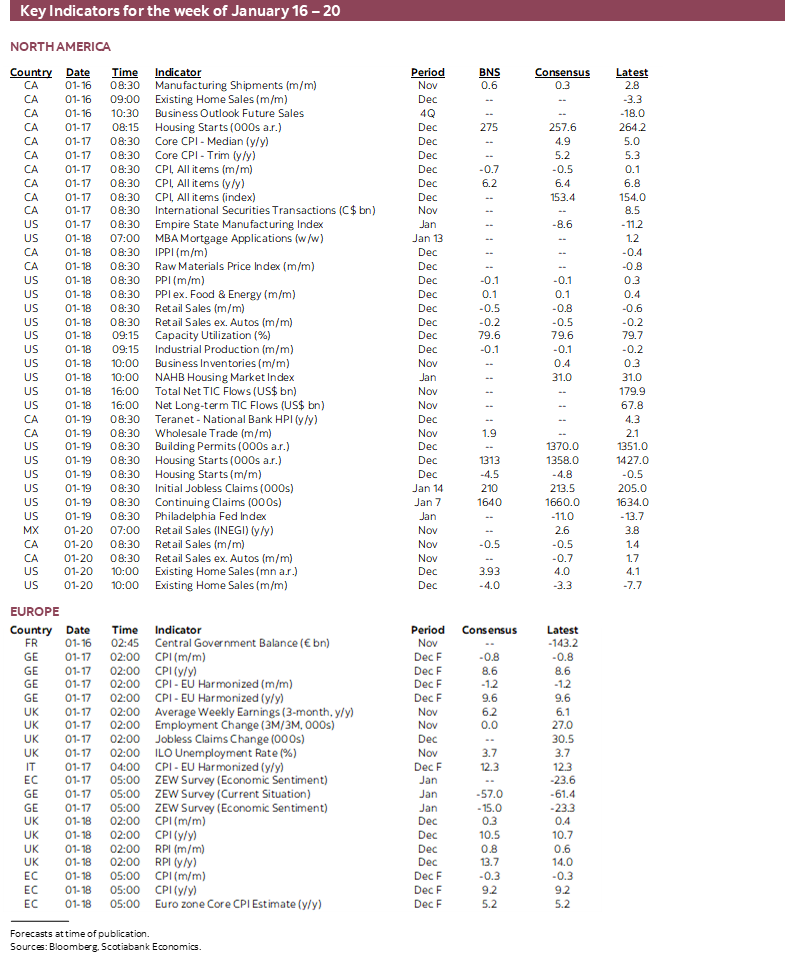
Australia updates job market conditions during December on Wednesday. Its job market has been on a tear and this has driven the unemployment rate toward rock-bottom levels while job vacancies remain very high (chart 16). While Q4 wage growth doesn’t land until February 21st, the accelerating trend is raising wage-price inflation concerns (chart 17).
Canada releases a handful of macro reports over the coming week in addition to the aforementioned BoC surveys and CPI. Manufacturing shipments during November (Monday) were previously guided by StatCan to have risen by 0.6% m/m but we’ll find out how much was driven by price effects versus volumes alongside other figures such as new orders and order backlogs. Existing home sales during December (Monday) will likely prove to extend the pattern of declines in eight of the eleven months so far in 2022. Housing starts during December (Tuesday) were probably range bound around 260k at an annualized rate given the trend in permits. Friday’s retail sales for November alongside advance guidance for December will offer a more complete picture of the holiday shopping season; StatCan already guided that sales were soft in November (-0.5% m/m) but how much of that was due to volumes and how the season ended may dominate attention.
US markets face a long line-up of releases primarily over the back half of the week, but if any influence markets, then the greatest odds of this surround retail sales during December on Wednesday. Lower gasoline prices and lower vehicle sales will probably drag the headline nominal reading lower, but key will be core sales excluding these two factors as a gauge of holiday shopping momentum especially after the 0.6% decline the prior month. Household sector readings will BE rounded out by an expected decline in existing home sales during December (Friday) given the pattern of pending home sales, plus expected softening in housing starts during December on Thursday. Industrial sector readings will include total production during December (Wednesday) that was probably soft given weakness in ISM-manufacturing, plus the start of the next round of regional manufacturing gauges when the Empire (Tuesday) and Philly (Thursday) measures arrive. Producer prices probably fell in December (Wednesday) due to lower energy prices. Weekly jobless claims will further inform the decline over the prior two weeks (Thursday) and there will be more Fed-speak to consider.
Other European releases will help to fill in the blanks with greater detail on Eurozone inflation during December (Wednesday) plus ZEW investor sentiment readings in January (Tuesday) that serve as one of the key monthly gauges of sentiment alongside PMIs, IFO business confidence and consumer confidence readings.
LatAm releases will be light and only include Mexican retail sales during November (Friday), Peru’s unemployment rate at the start of the week, and Colombia’s retail sales and industrial production (Tuesday) and trade figures (Thursday).
DISCLAIMER
This report has been prepared by Scotiabank Economics as a resource for the clients of Scotiabank. Opinions, estimates and projections contained herein are our own as of the date hereof and are subject to change without notice. The information and opinions contained herein have been compiled or arrived at from sources believed reliable but no representation or warranty, express or implied, is made as to their accuracy or completeness. Neither Scotiabank nor any of its officers, directors, partners, employees or affiliates accepts any liability whatsoever for any direct or consequential loss arising from any use of this report or its contents.
These reports are provided to you for informational purposes only. This report is not, and is not constructed as, an offer to sell or solicitation of any offer to buy any financial instrument, nor shall this report be construed as an opinion as to whether you should enter into any swap or trading strategy involving a swap or any other transaction. The information contained in this report is not intended to be, and does not constitute, a recommendation of a swap or trading strategy involving a swap within the meaning of U.S. Commodity Futures Trading Commission Regulation 23.434 and Appendix A thereto. This material is not intended to be individually tailored to your needs or characteristics and should not be viewed as a “call to action” or suggestion that you enter into a swap or trading strategy involving a swap or any other transaction. Scotiabank may engage in transactions in a manner inconsistent with the views discussed this report and may have positions, or be in the process of acquiring or disposing of positions, referred to in this report.
Scotiabank, its affiliates and any of their respective officers, directors and employees may from time to time take positions in currencies, act as managers, co-managers or underwriters of a public offering or act as principals or agents, deal in, own or act as market makers or advisors, brokers or commercial and/or investment bankers in relation to securities or related derivatives. As a result of these actions, Scotiabank may receive remuneration. All Scotiabank products and services are subject to the terms of applicable agreements and local regulations. Officers, directors and employees of Scotiabank and its affiliates may serve as directors of corporations.
Any securities discussed in this report may not be suitable for all investors. Scotiabank recommends that investors independently evaluate any issuer and security discussed in this report, and consult with any advisors they deem necessary prior to making any investment.
This report and all information, opinions and conclusions contained in it are protected by copyright. This information may not be reproduced without the prior express written consent of Scotiabank.
™ Trademark of The Bank of Nova Scotia. Used under license, where applicable.
Scotiabank, together with “Global Banking and Markets”, is a marketing name for the global corporate and investment banking and capital markets businesses of The Bank of Nova Scotia and certain of its affiliates in the countries where they operate, including; Scotiabank Europe plc; Scotiabank (Ireland) Designated Activity Company; Scotiabank Inverlat S.A., Institución de Banca Múltiple, Grupo Financiero Scotiabank Inverlat, Scotia Inverlat Casa de Bolsa, S.A. de C.V., Grupo Financiero Scotiabank Inverlat, Scotia Inverlat Derivados S.A. de C.V. – all members of the Scotiabank group and authorized users of the Scotiabank mark. The Bank of Nova Scotia is incorporated in Canada with limited liability and is authorised and regulated by the Office of the Superintendent of Financial Institutions Canada. The Bank of Nova Scotia is authorized by the UK Prudential Regulation Authority and is subject to regulation by the UK Financial Conduct Authority and limited regulation by the UK Prudential Regulation Authority. Details about the extent of The Bank of Nova Scotia's regulation by the UK Prudential Regulation Authority are available from us on request. Scotiabank Europe plc is authorized by the UK Prudential Regulation Authority and regulated by the UK Financial Conduct Authority and the UK Prudential Regulation Authority.
Scotiabank Inverlat, S.A., Scotia Inverlat Casa de Bolsa, S.A. de C.V, Grupo Financiero Scotiabank Inverlat, and Scotia Inverlat Derivados, S.A. de C.V., are each authorized and regulated by the Mexican financial authorities.
Not all products and services are offered in all jurisdictions. Services described are available in jurisdictions where permitted by law.