Risk Dashboard
Week of August 8th – 12th:
• Inflation’s long and short games
• Assessing supply chains
• US CPI could reinforce nonfarm’s hawkish Fed effects
• China’s inflation is still being driven by pork prices
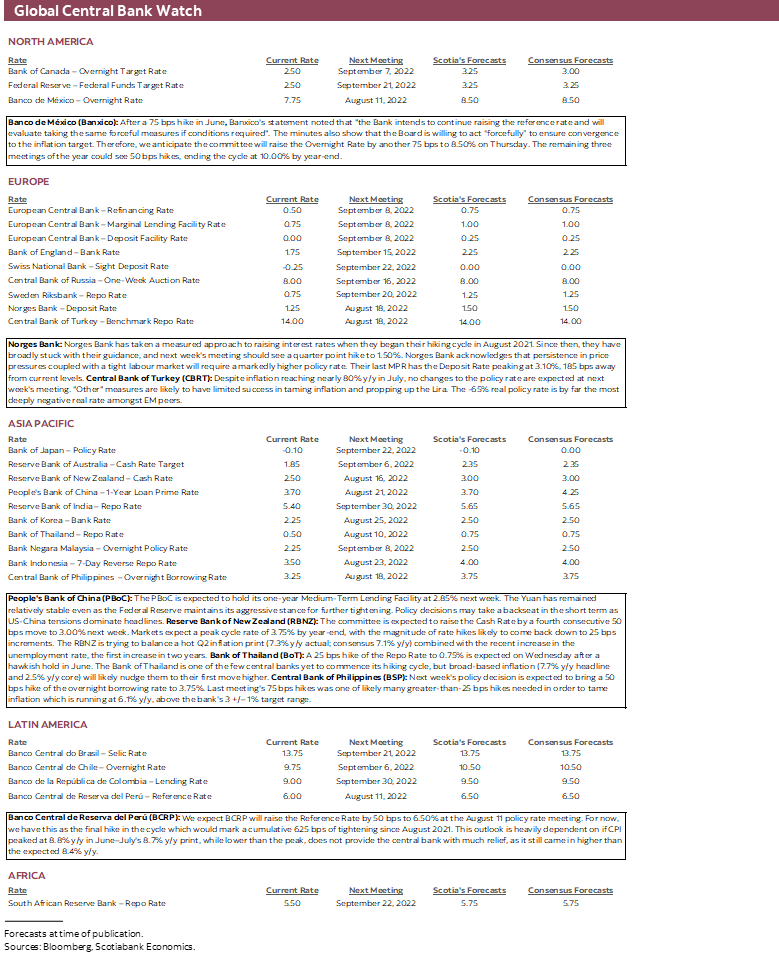
• Banxico to follow the Fed
• Peru’s central bank: one more and done?
• Indian inflation likely eased on lower oil
• BoT likely to commence its tightening cycle
• South Korea’s strong job market
• Other CPI: Brazil, Chile, Mexico, Norway, Sweden
Week of August 15th – 19th:
• FOMC minutes to re-emphasize what markets missed
• Canadian CPI still running hot
• PBoC likely to stay on hold with the yuan under pressure
• UK CPI inflation will only go up from here
• Japanese inflation drivers are already ebbing
• Australian jobs still resilient?
• UK jobs a bright spot in a bleak outlook
• RBNZ: another 50 with refreshed guidance
• Philippines’ central bank likely to deliver another out-sized hike
• Norges Bank still hiking before refreshing forward guidance
• Turkey’s central bank is the poster child of what not to do
• Other macro
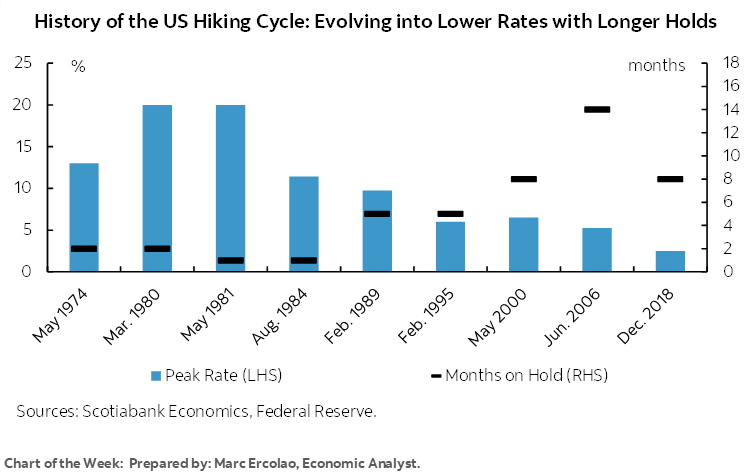
Chart of the Week
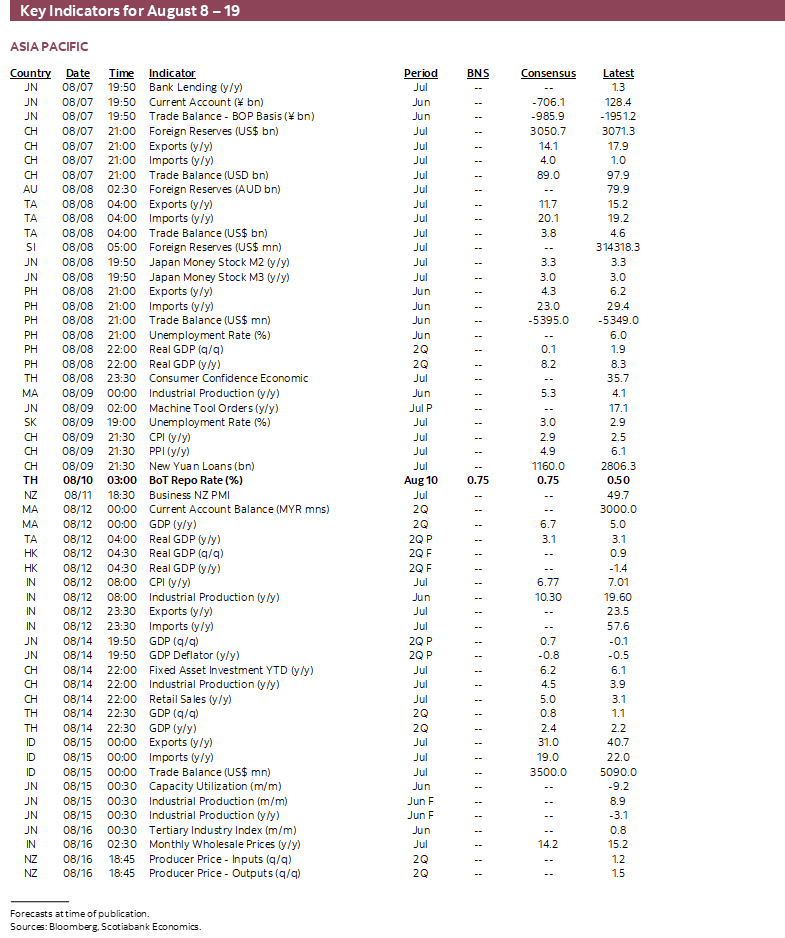
The dominant focus over the next couple of weeks is going to be upon a round of inflation reports from the US, Canada, UK, China, India, Mexico, Japan, Mexico, Chile, Brazil, Norway and Sweden. There will also be a round of decisions by several regional central banks and possibly guidance from the Fed and PBoC. Data risk will otherwise be modest and geopolitical developments may be a wildcard.
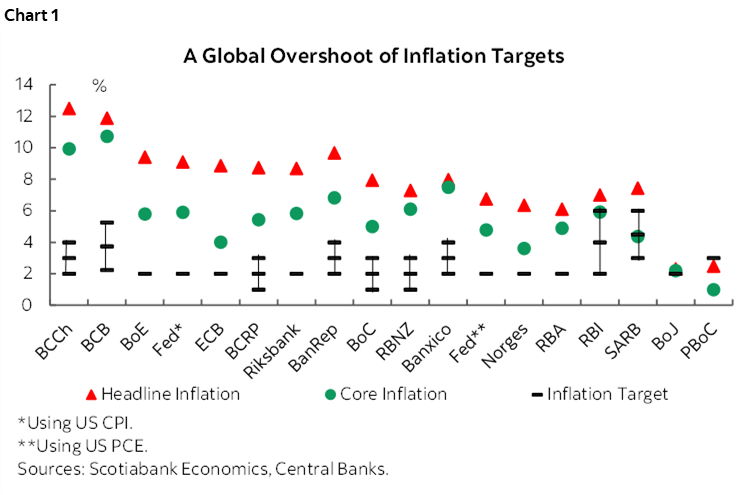
Central banks are unlikely to be inclined to flag material progress with inflation still massively higher than targets across much of the world (chart 1).
Fortunately, major central banks can take to the sidelines to assess fresh developments as they generally take a breather before returning in September. An exception could be any guidance offered through the Fed’s Jackson Hole gathering on August 25th–27th under the banner of “Reassessing constraints on the economy and policy.” As usual, the agenda and attendees won’t be known until the event’s first evening.
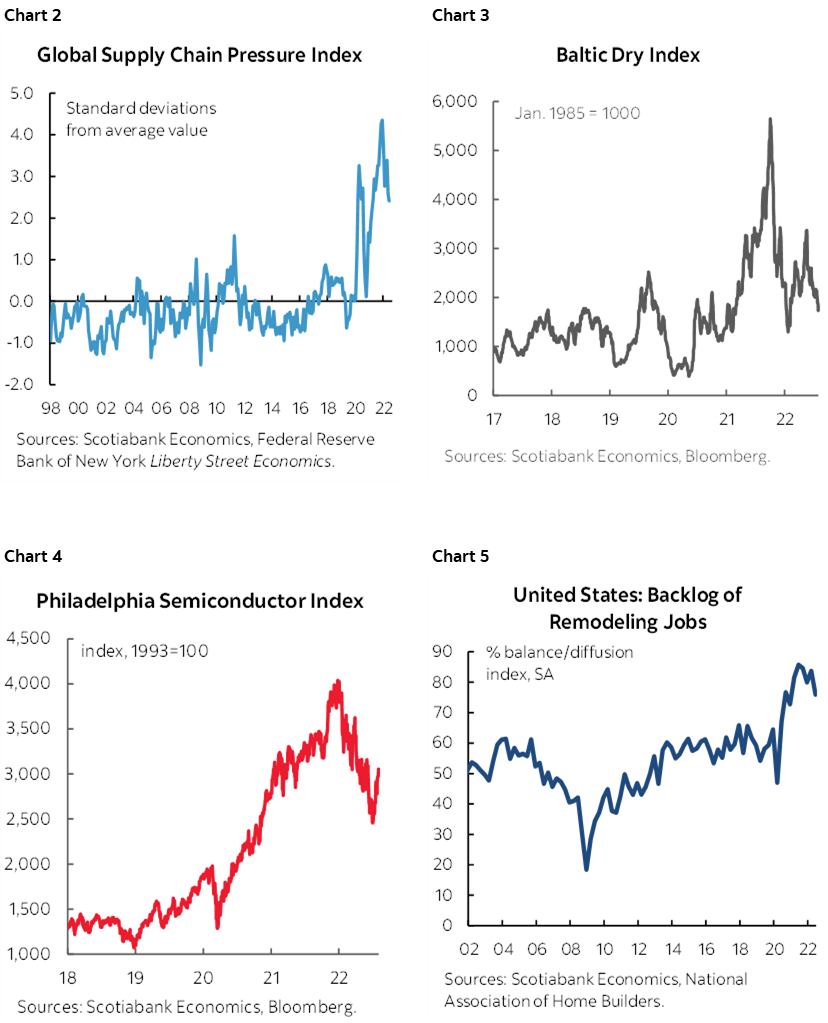
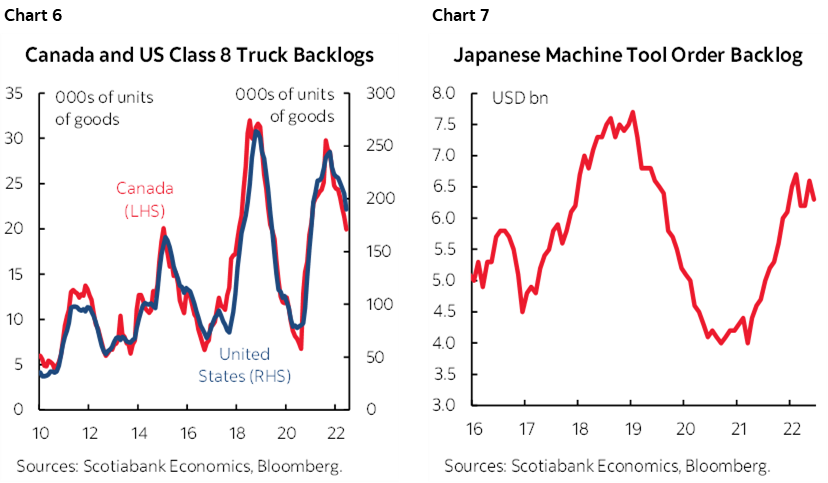
One feature of that discussion is likely to involve reassessing supply chain pressures amid very tentative evidence of easing but still high constraints such as in ocean transit times (here) and in charts 2–7. While impetuous financial markets seek salvation in every bit of short-term data wiggle and are accordingly swinging all over the map in classic August fashion, central banks should resist the temptation to over-react to further possible improvements in either supply chains or hard inflation readings. Perhaps the biggest reason is that regardless of incremental progress toward lessening severe supply chain constraints we could be at a very nascent stage in terms of how businesses are fundamentally re-evaluating and redesigning supply chains in the wake of successive shocks.
Those shocks started with Trump’s trade wars against, well, basically everyone, and transitioned toward generally less open immigration policies across several economies like the US and into the pandemic and then the war in Ukraine. C-suites the world over are now left grappling with a series of blows to the past model that outsourced to lowest cost jurisdictions for manufacturing facilities or service centers with relatively little concern about border frictions to one in which operational risk has escalated. If serial border frictions are here to stay—and it’s not hard to imagine so—then the very viability of industries and individual firms could rest upon how they adapt.
That could mean internalizing more supply chains, growing more of their own in-house transportation networks and infrastructure, integrating both vertically and horizontally, bringing chains closer to home, stocking permanently higher inventory levels in a reversal of just-in-time management to varying degrees depending upon the speed of turnover and changes in tastes, and targeting higher economies of scale to be able to spread the higher costs that stem from all of this across a larger base. Many of these approaches add costs and the firms and industries with some pricing power could be better positioned to pass this onto consumers in long-wave fashion. I’m afraid the world has changed in a very fundamental manner within a rather short period of time starting with the US election and Brexit in 2016. Central banks need to change and face the reality that the inflation threat could be with us for a very long time to come and not be overly sensitive to shorter term developments. That could well mean considerably higher neutral policy rates as the goalposts shift.
In addition to this narrative, another reason not to prematurely declare victory is that renewed deterioration in supply chains could well occur as factors like Europe’s looming energy crisis this winter take hold and disrupt multiple industries that will either be unable to have adequate power or will pay dearly for it which means you and I will, not to mention any twists the pandemic or geopolitical risks may have in store for us. Another reason is that ongoing pass-through of lagging price pressures from prior damage to supply chains could unfold. Last, for now, and depending upon the economy, there may not be enough progress toward opening up slack in order to push inflation lower after central banks over-stimulated demand.
INFLATION’S SHORT GAME
Another wave of global inflation readings lies ahead and this time will offer updates for the month of July. I’ll rattle off expectations for the readings that are nearest and dearest first of all and then follow with the rest.
US CPI—Another Hot One
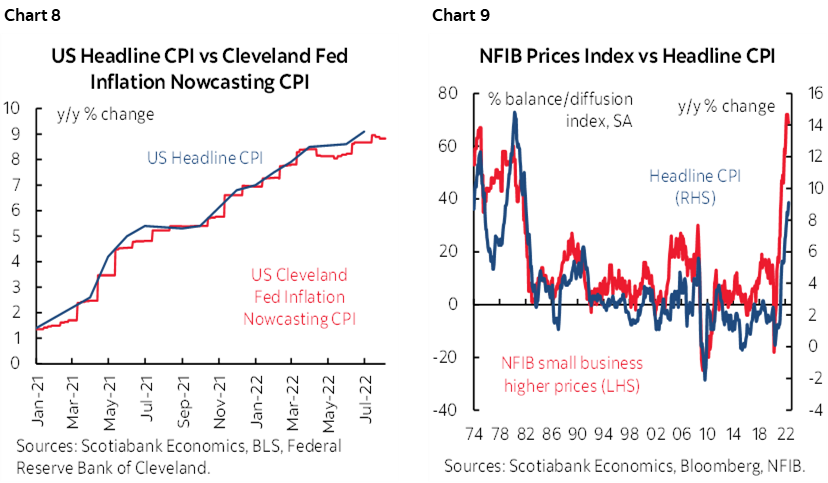
US CPI will be updated on Wednesday August 10th. I’ve gone with 8.9% y/y (9.1% prior) and 0.4% m/m SA for headline CPI. For CPI ex-food-and-energy I’ve gone with 6.1% y/y led by a 0.6% m/m SA gain. If that view proves to be correct, then annualized month-over-month core CPI will land close to 7½% which would be in line with the recent three-month moving average and indicate that inflationary pressures remain hot.
The Cleveland Fed’s inflation ‘nowcast’ points toward inflation running a tenth or two beneath 9% y/y and it has been slightly underestimating actual CPI inflation for several months (chart 8). Further, while some PMIs have been indicating lessening price pressures, small businesses are not (chart 9).
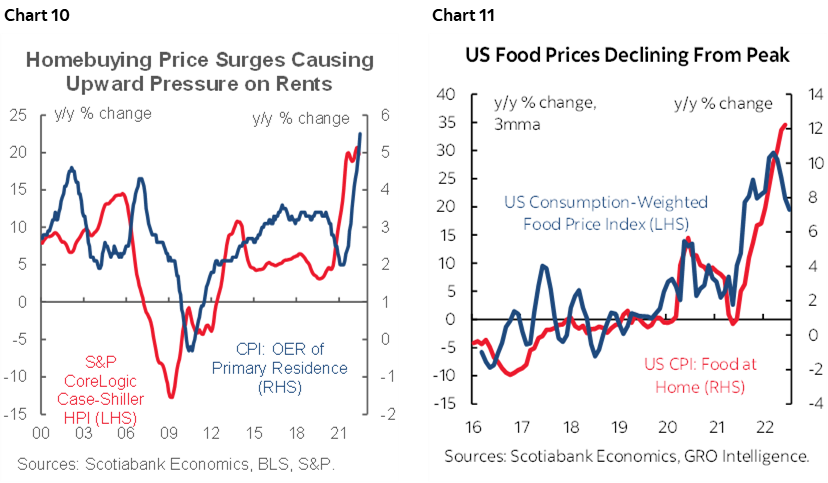
Other drivers are somewhat mixed. Year-ago base effects will shift toward dragging the year-over-year headline and core rates down by about a half percentage point or slightly less in both cases. July is typically a modest month for seasonality. House prices will probably keep owners’ equivalent rent on the hot side (chart 10). All-grades retail gasoline prices fell by over 7% m/m NSA and about half that in seasonally adjusted terms. Henry hub natural gas prices fell by about 5% m/m NSA but the tiny weight on piped gas of under 1% should mean minimal drag. Used vehicle prices seem to have fallen and are estimated to knock about 0.1% m/m off overall inflation while new vehicle prices seemed to be fairly flat. Food-at-home and food-away-from-home are assumed to combine for another gain of around 1% m/m but pressures may be abating (chart 11). There is also likely to be an ongoing reopening effect upon prices as pent-up services demand continues to get unleashed.
Having said all of that, it’s August and it’s one print. There will be another CPI print on September 13th before the next FOMC decisions on September 21st but only one more reading on the Fed’s preferred PCE inflation estimates before then. After the full recovery in nonfarm payrolls that beat expectations amid accelerating wage growth (recap here) there will be another update on September 2nd. The FOMC’s nimble decisions tend to go down to the frail and rather brittle wire these days and there may well be plenty of other developments between now and then to inform the stance and revised Summary of Economic Projections including the dot plot at the September meeting.
In any event, the absurdity of calling play-by-plays around individual data points downplays what should be the greater focus upon longer-lived drivers of inflation that should set a much higher bar against back pedalling than markets have been pricing through premature cuts starting next Spring. I’d rather see the Fed overdo it in order to ensure that inflation winds down without boomeranging back upon us; for markets to counsel otherwise could be tantamount to thinking you know more than your doctor and stopping your course of antibiotics midway!
Canadian CPI—Housing’s Waning Influence
Canada’s inflation figures for July are set to be updated the week after the US on Tuesday, August 16th. Here I’ve gone with 7.8% y/y (8.1% prior) and 0.4% m/m SA. CPI ex-food-and-energy is forecast to pick up to 5.8% y/y (5.3% prior) through a 0.7% m/m SA rise. Central tendency measures are expected to climb over 5% y/y on average and note that all three of them have generally converged around 5% including June readings for common component at 4.6%, weighted median CPI at 4.9% and trimmed mean CPI at 5.5%. Common component’s upward revisions have been particularly eye catching of late.
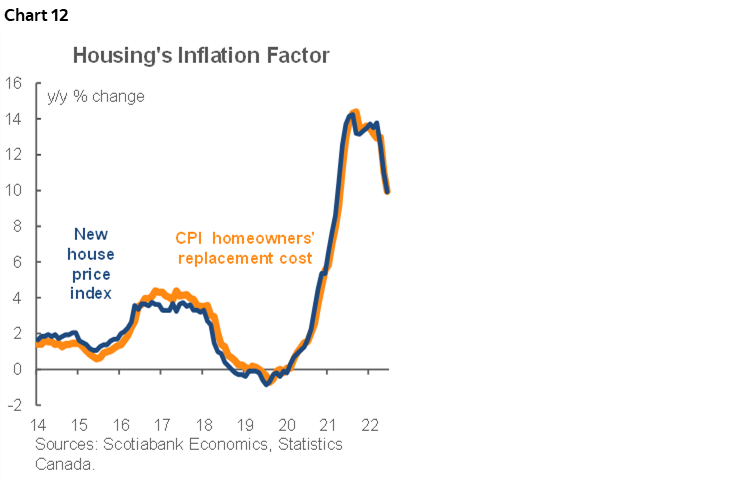
The drivers are somewhat similar to the US call. One difference is the way in which Statistics Canada captures housing in CPI by using the house-only component of the new house price index (ie: ex-land) as a driver of replacement cost within shelter costs, versus OER in the US. This driver is waning in Canada (chart 12). Further, base effect shifts will drop the year-over-year rate toward 7.4% from 8.1% y/y. Light July seasonality may add some upward pressure on the month-over-month rate especially given the Canadian convention to poll for seasonally unadjusted estimates. Lower gasoline prices are estimated to subtract about 0.4% in weight terms from month-over-month pressures. A mild acceleration in food prices is estimated after the prior month’s sudden deceleration with an added kicker perhaps from a weaker C$ on average in July versus June. Used and new vehicle prices should add a small amount but a 26% m/m plunge in Alberta hub natural gas prices could more than offset that even at a small 0.8% weight. Like the US, a reopening effect on broader price pressures is expected to continue.
China—Pork’s First- and Second-Round Effects
Unlike other parts of the world that are dealing with hot headline and core readings, China has only seen an acceleration in headline CPI. That is likely to continue with July updates on Tuesday August 9th that could at least temporarily take headline inflation closer to the state’s 3% goal while leaving core inflation at around one-third of that pace.
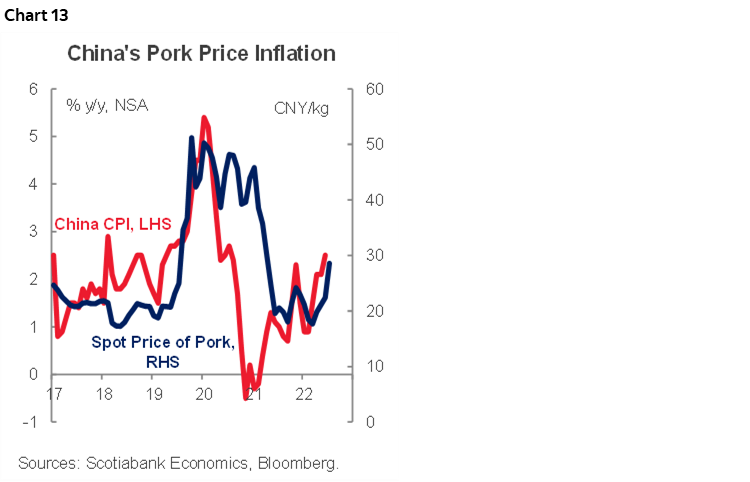
Given a roughly one-fifth share of the total CPI basket, soaring pork prices are likely to keep overall food price inflation under upward pressure for now (chart 13). When this has happened in the past it can tend to invoke second-round disinflationary effects as the cost of the food staple crowds out spending on other items. If that happens again then it may add to the case for easier policy albeit a perhaps missed opportunity in the face of risks surrounding the yuan-dollar and Fed connections.
UK—Fear of What Lies Ahead
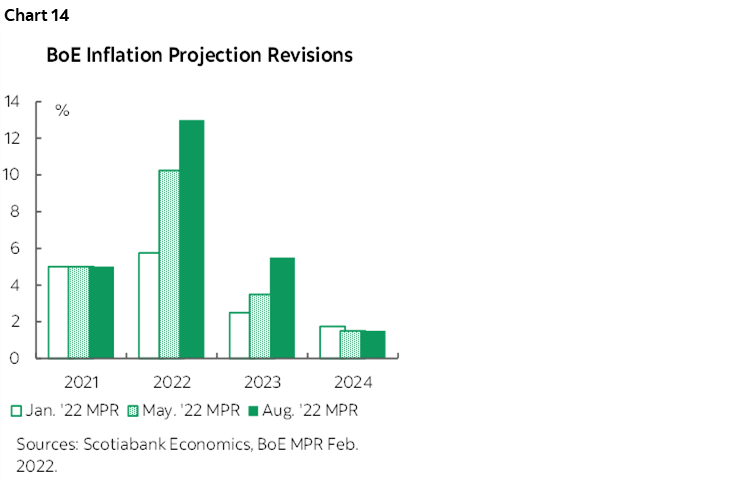
UK inflation readings will be updated on Wednesday, August 17th. It will just be a placeholder around the recent roughly 9½% y/y pace along a path of expected further upward pressure that the Bank of England has already taken into account by revising inflation forecasts higher (chart 14).
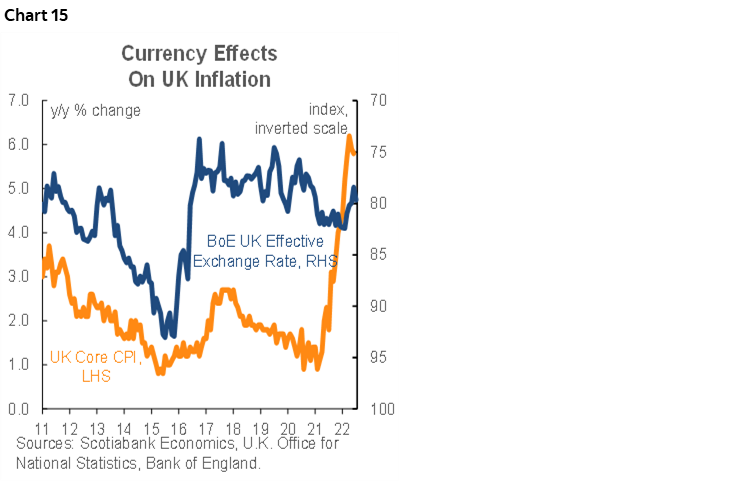
Ofgem, the UK energy regulator, has recently guided that they will shift toward adjusting energy price caps affecting millions of UK consumers on a quarterly basis instead of biannually. The next price cap update will occur at the end of August (here) and the advisory contained a warning from Ofgem that “customers face a very challenging winter ahead.” UK analyst estimates point toward expectations for a rough doubling of monthly energy bills from the cap set last April by this Winter. In addition, sterling’s softening is likely to add further upward pressure upon inflation (chart 15). Markets are pricing Bank Rate at over 125bps higher than the present 1.75% level by next summer as such inflationary forces are bound to have the BoE continue to look through its forecast recession beginning in Q4 and adhering to its inflation mandate.
Japan—Rising Inflation? Meh
Japanese CPI inflation for July on August 18th could start to top out and face downside pressure. Much of the run-up to date has been driven by oil prices and a weaker yen, both of which have softened of late (chart 16). WTI in USD terms has fallen from a recent peak of US$122/barrel in early June toward the upper-80s now while the yen bottomed at about 139 to the dollar in mid-July and has modestly strengthened since then. This prior run-up erroneously led some market participants to argue the BoJ would have to adopt some form of tightening measure and perhaps its 10-year JGB yield target was vulnerable.
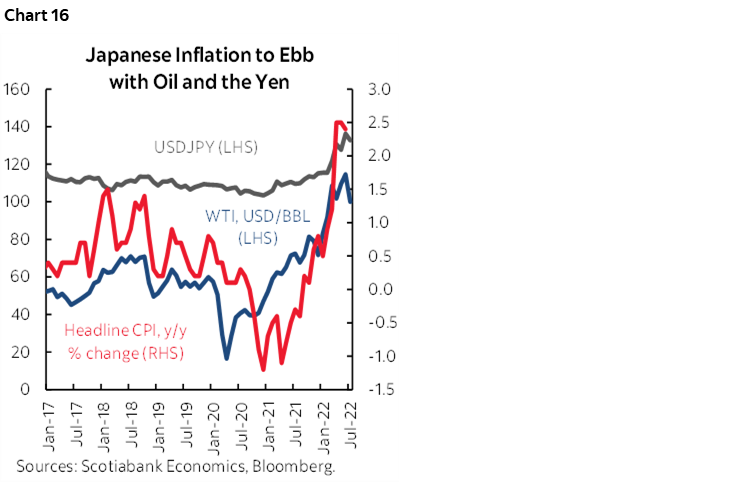
The problem with that narrative was always that this isn’t the kind of inflation that the Bank of Japan wants. It is inclined to view the effects of inflation derived from higher oil prices and a weaker yen as transitory and hence unlikely to deliver the medium- to longer-run goal of 2% inflation. The Bank of Japan has estimated (here, especially pages 20–21) that a one standard deviation move in the yen (roughly 4%) adds about 0.1–0.2% to inflation over 2–8 quarters before subsiding. Further, the same paper estimated that a one standard deviation in oil prices of roughly 15% would add 0.1–0.3 percentage points to inflation inside of a year before subsiding. Japan has been experiencing a relative price shock as a commodity importer with a weakening currency but these influences may be waning and the second-round effects in the context of soft wage gains could be more disinflationary in Japan than elsewhere.
India—CPI Could Ebb on Lower Oil
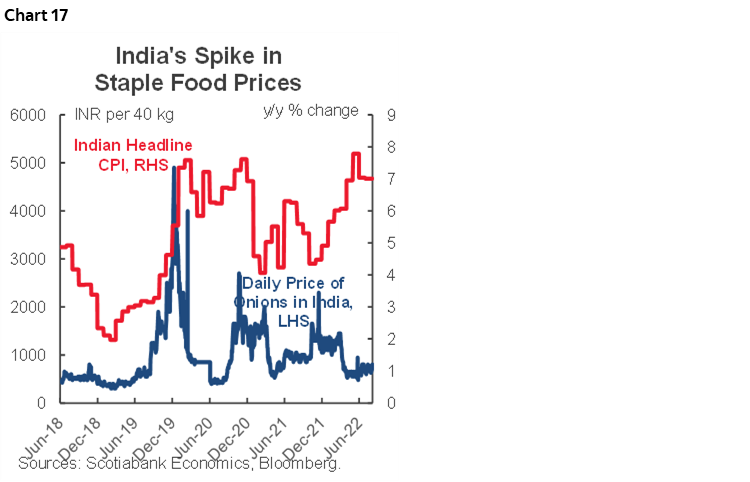
India updates inflation readings for July on Friday August 12th. Forecasting Indian inflation is to a significant degree a matter of forecasting movements in two key commodities: oil and food’s nearly one-half weight that includes volatile swings in onion prices. Both have been hot contributions as fuel and lighting prices have been rising by over 10% y/y and food has been up by nearly 8%. Oil prices are slipping of late and that could help drive inflation back under 7% y/y. It’s too early to look ahead to seasonal pressures from the influence of monsoons on onion prices as a staple in the Indian diet that can swing inflation numbers around fairly quickly (chart 17).
Still, with core inflation over 6% y/y the Reserve Bank of India has remained on a tightening path including a cumulative repo rate hike of 140bps since having started tightening in Q2 including its latest 50bps hike.
Others
Inflation updates will also be delivered over the week of August 8th – 12th by Chile (Monday) that is expected to inch higher toward 13% y/y, Brazil (Tuesday) that could see the headline rate dip back beneath 11% y/y, Mexico (Tuesday) that may cross above 8% y/y, Norway (Wednesday) that is likely to see firmer upward pressure on underlying CPI, Sweden (Friday) and Indonesia (Friday).
CENTRAL BANK ROUND-UP
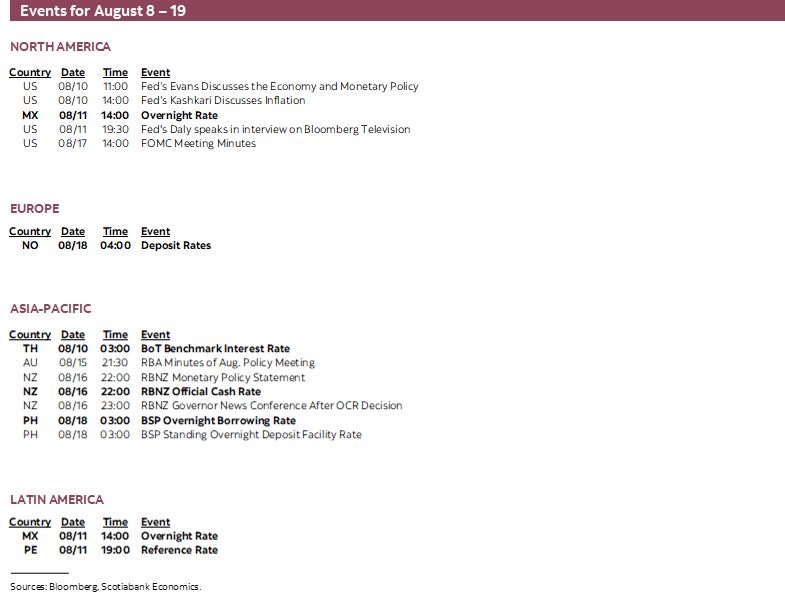
Unless the People’s Bank of China has a trick up its sleeve—which is unlikely—then all of the central bank decisions that are on tap for the coming two weeks will offer localized market risk. Another exception may be any unlikely surprises in the minutes to the July FOMC meeting.
Here are the expected outcomes in chronological order:
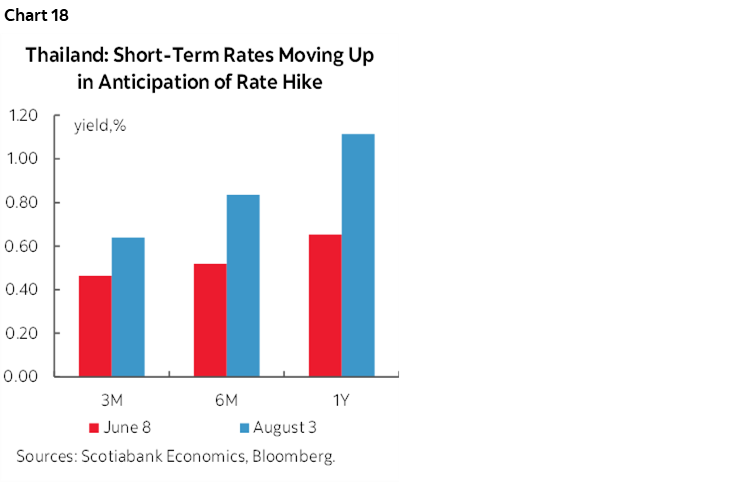
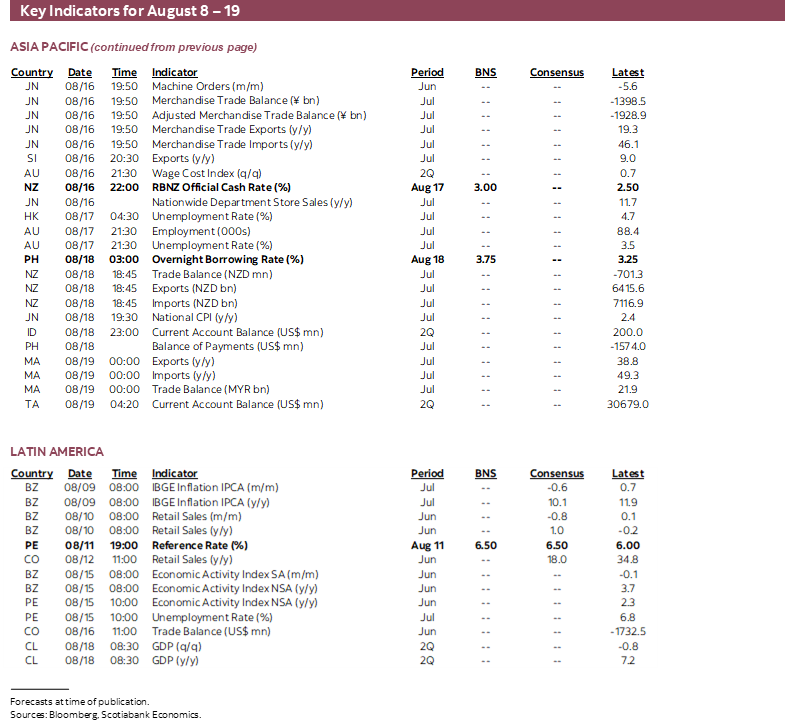
- Bank of Thailand (August 10th): Most expect a quarter-point hike in the BoT’s benchmark rate as its first tepid foray into tightening territory following the close 4–3 hold vote at the June meeting that was accompanied by guidance that “a very accommodative monetary policy will be less needed going forward.” Markets have been adjusting accordingly (chart 18). Core CPI inflation has accelerated by a full percentage point in the past three months to 3% with broadening drivers. Headline inflation has surged to 7.6% y/y and hence far above the 1–3% target range.
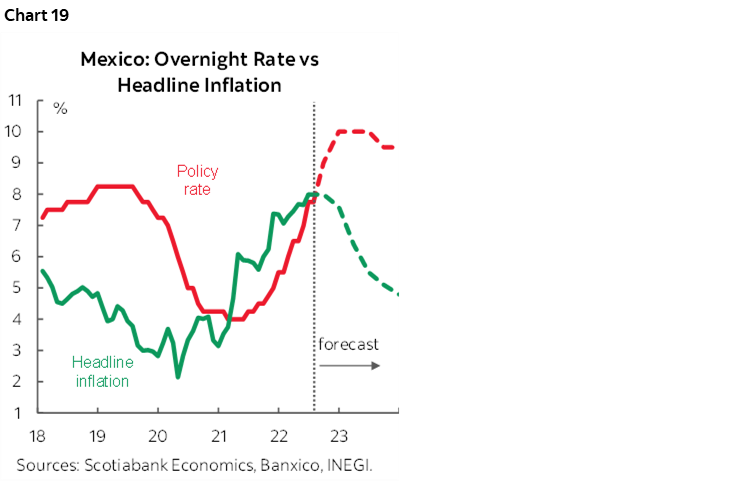
- Banxico (August 11th): Most expect another 75bps increase in the overnight rate with further upside ahead (chart 19). Banxico Deputy Governor Heath laid out the script ahead of the Fed’s hawkish pivot when he said in March “When the Fed increases we’ve always increased at the same pace or more, but never less, so I don’t really see the case for it to be different now.”
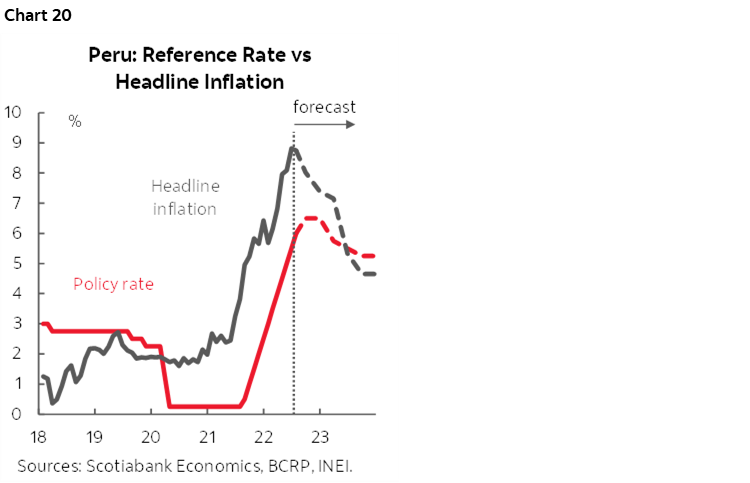
- Peru (August 11th): Another 50bps hike to the reference rate is expected which would mean a cumulative rate increase of 625bps since the tightening cycle began one year ago. Guidance will be key as some believe the hiking cycle could be winding up whereas there are continued upside surprises to inflation at 8.7% y/y with core CPI still climbing at 5.4% (chart 20).
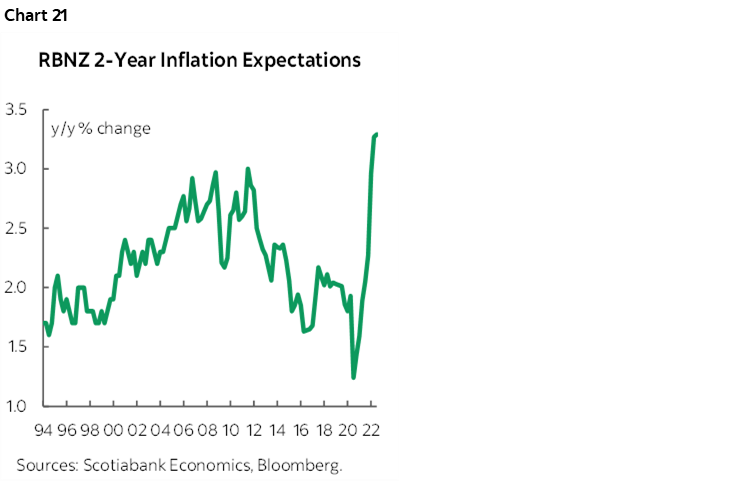
- RBNZ (August 16th): Another 50bps hike is expected that would continue the accelerated pace that kicked in back in April after the central bank started tightening in quarter-point increments last August. A fresh Monetary Policy Statement will be issued with updated forward guidance that may further inform the difference between the prior forward guidance in May that pointed to a peak policy rate of about 4% next year relative to market pricing that is close to that. Since then, headline inflation accelerated by a bit faster than expected to 7.3% y/y in Q2 and 2-year ahead inflation expectations have remained above-target (chart 21).
- FOMC Minutes (August 17th): Minutes to the FOMC meeting on July 26th–27th may take the opportunity to further reinforce the narrative that markets misinterpreted what the Committee was conveying and could therefore have a generally hawkish tone. A recap of that meeting is available here. Recall that markets reacted in dovish fashion by choosing what they wished to hear and in my opinion missing the main messages like how Powell said “I think you can think of the destination as still broadly in line with the June SEP” that showed a peak fed funds upper limit of 3.75% which was above market pricing at the time and still slightly remains so now.
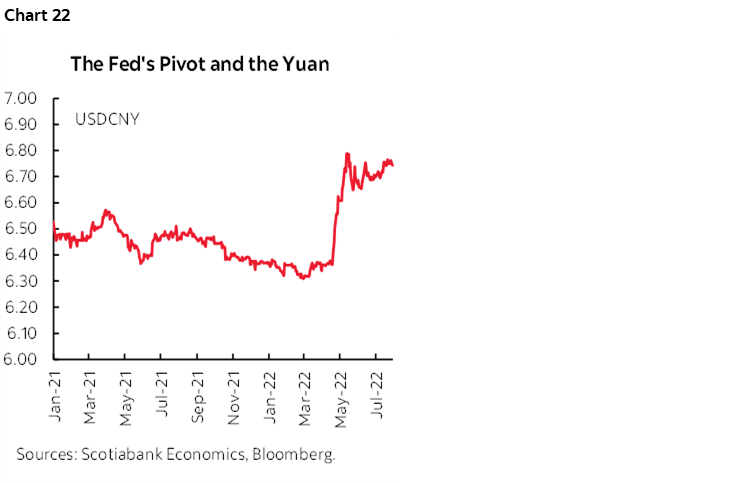
- PBoC (date TBD): Some time between August 12th and August 16th the People’s Bank of China will set its one-year Medium-Term Lending Facility Rate. No change is expected to the 2.85% level. While there remains a case for easing given core inflation is at about one-third of the 3% headline target, growth is disappointing, property market struggles and Covid Zero policies have been damaging and foreign export markets are softening, the opportunity may have passed as the Fed’s more hawkish pivot has driven dollar strength that has caught the yuan in its hold (chart 22). Managed adjustments to the yuan are occurring to moderate its weakening. Cuts at this point may feed greater financial instability via capital outflows.
- Philippines (August 18th): Bangko Sentral ng Pilipinas is expected to hike by another 50–75bps after starting a hiking cycle with 25bps hikes in May and June. Since then, inflation accelerated to 6.4% y/y. While the central bank may have been leaning toward another 25–50bps at this coming meeting, its guidance had lowballed the 75bps hike they delivered in July.
- Norges Bank (August 18th): Norges Bank is likely to hike by another 25bps in keeping with the forward guidance offered within the June 23rd Monetary Policy Report but ahead of a refresh in the September forecasts (chart 23). Staff recently updated their estimates of the real neutral rate to between -0.5% and +0.5% which attached to a 2% inflation target implies a nominal neutral rate of 1.5–2.5% (here). At 1.25% heading into the August decision, monetary policy remains too stimulative and is a considerable distance from turning restrictive. Market pricing for the policy rate sees a peak of about 2¼% next year. As inflation continues to climb with underlying CPI running at 3.6% y/y and headline at 6.3%, such a peak that far out may be conservative.

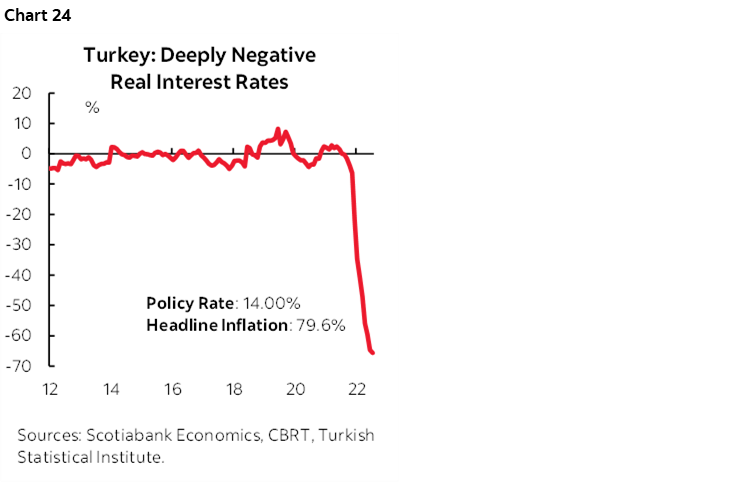
- Turkey (August 18th): Whatever Erdogan says should happen to the 14% one-week repo rate is what it is likely to be and to the detriment of society. No change is likely at this meeting, but the policy rate is far too low for a country with Turkey’s characteristics. Erdogan’s rather unorthodox stance drove the policy rate 500bps lower last year and cratered the lira. It has depreciated by another 25% or so in about the past month largely on relative central bank shifts as everyone else tightens while Turkey sleeps. High interest rates don’t cause inflation (his contention) as evidenced by soaring inflation in the wake of the cuts and the currency’s collapse. CPI is up 80% y/y and facing further upward pressure as monetary policy has thoroughly failed the nation amid a plunging real cost of borrowing (chart 24).
OTHER MACRO
Inflation, supply chains and some central banks will dominate attention alongside off-calendar developments while the rest of the global macro line-up is expected to be fairly light.
Beyond CPI, the US calendar during the first of the two weeks covered here will also face a likely drop in labour productivity and large rise in unit labour costs during Q2 (Tuesday), likely moderation of producer price increases during July (Thursday), another update to weekly jobless claims (Thursday) and the University of Michigan’s consumer sentiment release for August (Friday) with emphasis upon inflation expectations given Chair Powell’s focus upon the gauge. The second week will bring out industrial activity readings such as the Empire manufacturing gauge for August (Monday), industrial production during July (Tuesday) and the Philly Fed’s manufacturing release for August (Thursday). Also watch a pair of housing updates including housing starts (Tuesday) and existing home sales (Thursday).
Canada faces a dead empty calendar for the week of August 8th – 12th and the following week will primarily focus upon CPI as noted above. That week is likely to reveal around a 1% m/m drop in manufacturing shipments during June (Monday). On that same day there will be another bleak existing home sales report for July given advance readings from several major cities. The following day’s housing starts might remain resilience of building permits are any guide. The week will close with retail sales for June on Friday August 19th with preliminary guidance pointing to a small nominal gain and a drop in inflation-adjusted terms.
Job updates out of South Korea (Aug. 9), United Kingdom (Aug 16), and Australia (Aug 17) will likely have regional impacts as policy makers assess labour market conditions against tighter economic conditions.
- The South Korean labour market has been sitting at the sub 3.0% unemployment rate level for the past five months, a sign of labour market resilience. The participation rate is still sitting at a historic high of 64.1% while over 600k jobs in excess of pre-pandemic levels have been created.
- Labour market figures out of the UK will likely attract the most eyes after the BoE hiked rates in record increments and are looking increasingly pessimistic about the economic outlook, flagging a recession to begin in Q4-2022. Despite this, the labour market has held up remarkably well, with unemployment holding near historic lows at 3.8% and another +31k payrolls added for the month of June. For now, the labour market still remains extremely tight with ample job vacancies, but it is worth noting that the BOE expects unemployment levels to climb to 6.3% by 2025.
- Australia’s job market continues to push deeper into full employment, with another upside surprise in June employment (+88k) alongside a participation rate that nudged further into record territory at 66.8% and a record low unemployment rate at 3.5%. At this point, the RBA has the green light from the labour market to continue its aggressive rate hiking cycle.
Q2 GDP will be updated by the UK (August 12th), as well as Philippines, Taiwan and Malaysia over the week. The following week will bring Q2 GDP figures from Colombia, Chile and Norway.
DISCLAIMER
This report has been prepared by Scotiabank Economics as a resource for the clients of Scotiabank. Opinions, estimates and projections contained herein are our own as of the date hereof and are subject to change without notice. The information and opinions contained herein have been compiled or arrived at from sources believed reliable but no representation or warranty, express or implied, is made as to their accuracy or completeness. Neither Scotiabank nor any of its officers, directors, partners, employees or affiliates accepts any liability whatsoever for any direct or consequential loss arising from any use of this report or its contents.
These reports are provided to you for informational purposes only. This report is not, and is not constructed as, an offer to sell or solicitation of any offer to buy any financial instrument, nor shall this report be construed as an opinion as to whether you should enter into any swap or trading strategy involving a swap or any other transaction. The information contained in this report is not intended to be, and does not constitute, a recommendation of a swap or trading strategy involving a swap within the meaning of U.S. Commodity Futures Trading Commission Regulation 23.434 and Appendix A thereto. This material is not intended to be individually tailored to your needs or characteristics and should not be viewed as a “call to action” or suggestion that you enter into a swap or trading strategy involving a swap or any other transaction. Scotiabank may engage in transactions in a manner inconsistent with the views discussed this report and may have positions, or be in the process of acquiring or disposing of positions, referred to in this report.
Scotiabank, its affiliates and any of their respective officers, directors and employees may from time to time take positions in currencies, act as managers, co-managers or underwriters of a public offering or act as principals or agents, deal in, own or act as market makers or advisors, brokers or commercial and/or investment bankers in relation to securities or related derivatives. As a result of these actions, Scotiabank may receive remuneration. All Scotiabank products and services are subject to the terms of applicable agreements and local regulations. Officers, directors and employees of Scotiabank and its affiliates may serve as directors of corporations.
Any securities discussed in this report may not be suitable for all investors. Scotiabank recommends that investors independently evaluate any issuer and security discussed in this report, and consult with any advisors they deem necessary prior to making any investment.
This report and all information, opinions and conclusions contained in it are protected by copyright. This information may not be reproduced without the prior express written consent of Scotiabank.
™ Trademark of The Bank of Nova Scotia. Used under license, where applicable.
Scotiabank, together with “Global Banking and Markets”, is a marketing name for the global corporate and investment banking and capital markets businesses of The Bank of Nova Scotia and certain of its affiliates in the countries where they operate, including; Scotiabank Europe plc; Scotiabank (Ireland) Designated Activity Company; Scotiabank Inverlat S.A., Institución de Banca Múltiple, Grupo Financiero Scotiabank Inverlat, Scotia Inverlat Casa de Bolsa, S.A. de C.V., Grupo Financiero Scotiabank Inverlat, Scotia Inverlat Derivados S.A. de C.V. – all members of the Scotiabank group and authorized users of the Scotiabank mark. The Bank of Nova Scotia is incorporated in Canada with limited liability and is authorised and regulated by the Office of the Superintendent of Financial Institutions Canada. The Bank of Nova Scotia is authorized by the UK Prudential Regulation Authority and is subject to regulation by the UK Financial Conduct Authority and limited regulation by the UK Prudential Regulation Authority. Details about the extent of The Bank of Nova Scotia's regulation by the UK Prudential Regulation Authority are available from us on request. Scotiabank Europe plc is authorized by the UK Prudential Regulation Authority and regulated by the UK Financial Conduct Authority and the UK Prudential Regulation Authority.
Scotiabank Inverlat, S.A., Scotia Inverlat Casa de Bolsa, S.A. de C.V, Grupo Financiero Scotiabank Inverlat, and Scotia Inverlat Derivados, S.A. de C.V., are each authorized and regulated by the Mexican financial authorities.
Not all products and services are offered in all jurisdictions. Services described are available in jurisdictions where permitted by law.