- Canada’s economy has stalled for two quarters...
- ...but resilience is avoiding recession despite Mother Nature and striking workers...
- ...as transitory shocks continue to cloud an understanding of underlying growth
- GDP is the least important indicator on the path to October’s BoC decision...
- ...as trend inflation risk remains pointed higher
- Canada GDP, m/m % change, July, SA:
- Actual: 0.0
- Scotia: 0.2
- Consensus: 0.1
- August ‘flash’: 0.1% m/m
Canada remains mired in a combination of softening underlying growth and transitory shocks all of which is clouding our understanding of what’s truly going on in the economy. The outcome is a roughly flat economy in Q2 and so far in Q3.
The Canada two-year yield fell by about 4–5bps in the aftermath primarily on the back of the GDP figures with a small assist from softer than expected core PCE inflation in the US (+0.1% m/m, consensus 0.2%). USDCAD shook off the net effects of Canadian GDP and US core PCE with only minor moves in the currency.
Bank of Canada pricing moved a couple of basis points lower for the October 26th decision but terminal rate pricing over coming months is retaining pricing for a quarter point hike.
THE BANK OF CANADA’S FOCUS REMAINS ON INFLATION MYRIAD DRIVERS
The BoC targets inflation, of course, and not GDP. The BoC probably wishes to see a protracted period of weakness in GDP that would open up material excess capacity as input into its beloved output gap framework for forecasting inflation that in my opinion is of exceptionally little use to forecasting the kind of inflation drivers we face today. Even if we stick to this output gap framework, it’s notable that Canada has not yet seriously started to open up excess capacity in the economy.
In any event, GDP is probably the least significant release on the path to the October MPR meeting and beyond. After the BoC’s preferred core inflation readings both landed at 5.4% m/m SAAR in August, keys will be the September figures on October 17th, next Friday’s jobs and wages, and the BoC’s twin surveys of consumer and business attitudes including inflation expectations on October 16th. I’ll come back to the path for inflation risk beyond these prints in a moment.
DETAILS—TRANSITORY SHOCKS CONTINUE TO WEIGH ON THE DATA
GDP was flat in July and in line with Statcan’s preliminary guidance on September 1st, while August grew by 0.1% m/m in today’s ‘flash’ estimate that excludes meaningful details. I thought August might have been stronger, but maybe that just got pushed out to September given very light guidance on the drivers in August.
Using monthly GDP accounts, Q3 GDP is tentatively tracking little changed at 0.2% q/q SAAR following 0.1% in Q2 over Q1 (chart 1). This uses Q2, July’s print, August’s initial estimate and the assumption that September will be flat which is only made in order to focus the math upon known effects to this point without imposing judgement one way or the other on what may happen in September.
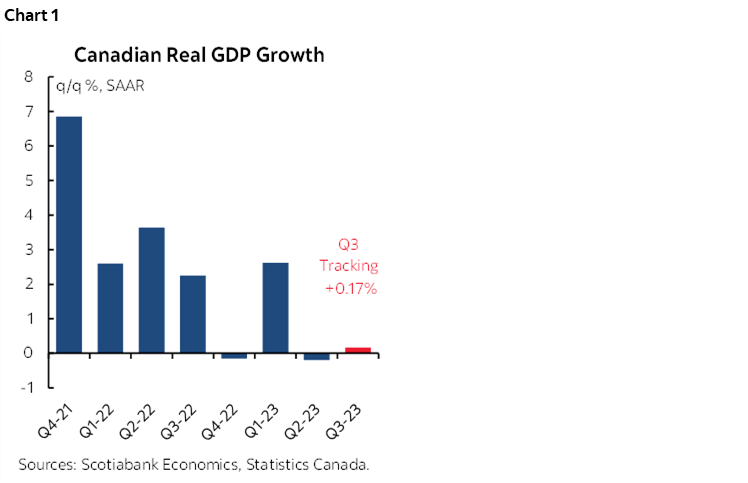
That makes for two consecutive quarters of flatness. The ‘nowcast’ for quarterly GDP that Scotiabank Economics runs is tracking about 0.5% q/q SAAR in Q3.
There are two cautions here. The quickest one to address is that the economy continues to skirt tail bets that it would slip into recession over Q2-Q3 that some of my competitors have been claiming. Recession avoidance is true just barely for GDP as not even one contraction has been registered thus far, and in any event, a recession call requires more than just back-to-back contractions in GDP. In fact, it’s a sign of resilience that the economy has yet to contract despite everything that mother nature and striking workers have thrown at it.
The economy remains stuck in the effects of serial shocks that are at least as important as the effects of monetary policy tightening. Absent such transitory shocks in a very unusual summer there would have been mild growth.
Chart 2 shows a breakdown of GDP growth by sector. For instance, Statcan flagged that manufacturing was the biggest weighted drag on GDP growth in July. They noted that lower inventory formation was a weight and that among the considerations were the effects of the BC port strike that limited product availability, especially sectors like chemical manufacturing.
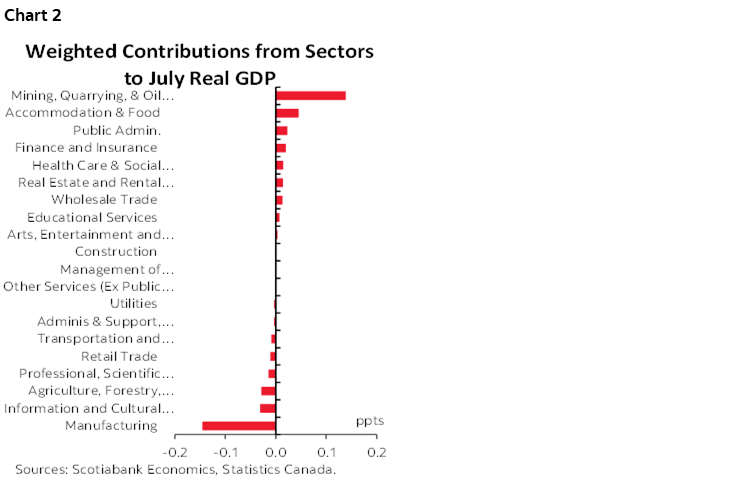
For another, July's port strike wasn't even the dominant weight against transportation sector GDP. It was a drag, but Statcan noted that:
"Air transportation (-2.1%) was the largest contributor to the sector's decline in July, contracting for the second consecutive month. Bad weather in the eastern United States over the Canada Day long weekend caused multiple delays and flight cancellations on both sides of the border."
They went on to note that “Water transportation contracted 3.4% in July as the closure of more than 30 British Columbia ports, including Canada's busiest—the Port of Vancouver—impacted the amount of trade that could move by ships. Significant declines in both imports from and exports to countries other than the United States impacted the sector, in particular a decrease in goods coming from China."
Even August was impacted as Statcan noted oil and gas extraction was a dampener as that sector pulled off the July rebound from wildfires that disrupted activity in June.
Overall we're trapped in the serial shocks story and some of them will persist, such as turmoil in the auto sector. It's just too difficult to weed them out of everything that's going on and these shocks are driving extremely noisy data given wildfires, wetness/weather effects, and strikes aplenty. I remain cautiously optimistic that the economy can still squeeze out modest growth over the duration of the year.
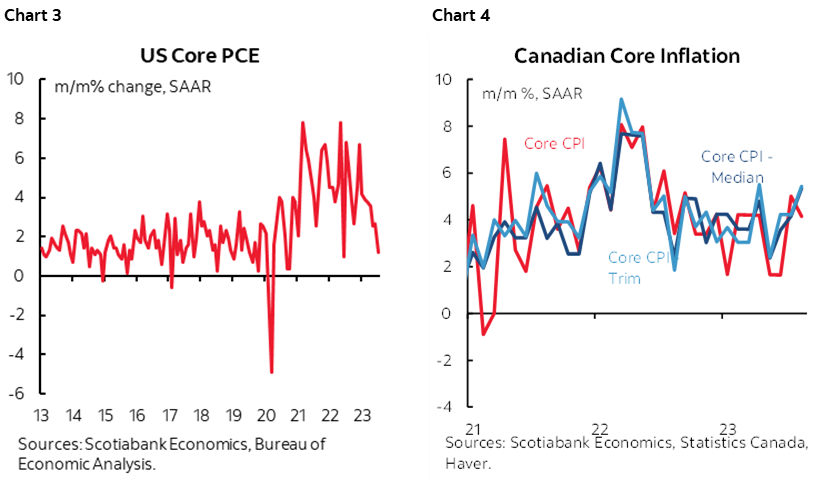
As for the drivers of inflation, they are an awful lot more complicated than simple GDP. Unlike the US (chart 3), Canada has yet to enter a soft patch for core inflation (chart 4). Wages are exploding while productivity is collapsing which is the worst combination of effects in terms of inflation risk. Collective bargaining is much more important in Canada than the US, given that about one-in-three Canadian workers are unionized (versus one-in-ten in the US) and going through aggressive negotiations seeking wage gains far above the BoC’s inflation target in the years to come. Inflation expectations remain way above the BoC’s 2% target. Immigration is far too high relative to the country’s ability to absorb such flows into lean stocks of available housing and other goods and services demanded upon arrival into a new country. Energy prices are skyrocketing as a back-door income lift to Canada’s economy and I think food will join in over the winter months, raising pressure not only on headline inflation but also pass through effects into core prices. Fiscal policy is priming the pump once again and with more ahead into Fall updates and Winter budgets. Retailers’ inventories are lean. CAD is undervalued.
On balance, while we need to be cautious in both directions with respect to reading the GDP tea leaves, I continue to believe that the drivers of inflation combined with elevated inflation expectations put the BoC behind the fight. We have seen periods of time in our country’s history when the BoC tightened and maintained a tight stance even as GDP.
DISCLAIMER
This report has been prepared by Scotiabank Economics as a resource for the clients of Scotiabank. Opinions, estimates and projections contained herein are our own as of the date hereof and are subject to change without notice. The information and opinions contained herein have been compiled or arrived at from sources believed reliable but no representation or warranty, express or implied, is made as to their accuracy or completeness. Neither Scotiabank nor any of its officers, directors, partners, employees or affiliates accepts any liability whatsoever for any direct or consequential loss arising from any use of this report or its contents.
These reports are provided to you for informational purposes only. This report is not, and is not constructed as, an offer to sell or solicitation of any offer to buy any financial instrument, nor shall this report be construed as an opinion as to whether you should enter into any swap or trading strategy involving a swap or any other transaction. The information contained in this report is not intended to be, and does not constitute, a recommendation of a swap or trading strategy involving a swap within the meaning of U.S. Commodity Futures Trading Commission Regulation 23.434 and Appendix A thereto. This material is not intended to be individually tailored to your needs or characteristics and should not be viewed as a “call to action” or suggestion that you enter into a swap or trading strategy involving a swap or any other transaction. Scotiabank may engage in transactions in a manner inconsistent with the views discussed this report and may have positions, or be in the process of acquiring or disposing of positions, referred to in this report.
Scotiabank, its affiliates and any of their respective officers, directors and employees may from time to time take positions in currencies, act as managers, co-managers or underwriters of a public offering or act as principals or agents, deal in, own or act as market makers or advisors, brokers or commercial and/or investment bankers in relation to securities or related derivatives. As a result of these actions, Scotiabank may receive remuneration. All Scotiabank products and services are subject to the terms of applicable agreements and local regulations. Officers, directors and employees of Scotiabank and its affiliates may serve as directors of corporations.
Any securities discussed in this report may not be suitable for all investors. Scotiabank recommends that investors independently evaluate any issuer and security discussed in this report, and consult with any advisors they deem necessary prior to making any investment.
This report and all information, opinions and conclusions contained in it are protected by copyright. This information may not be reproduced without the prior express written consent of Scotiabank.
™ Trademark of The Bank of Nova Scotia. Used under license, where applicable.
Scotiabank, together with “Global Banking and Markets”, is a marketing name for the global corporate and investment banking and capital markets businesses of The Bank of Nova Scotia and certain of its affiliates in the countries where they operate, including; Scotiabank Europe plc; Scotiabank (Ireland) Designated Activity Company; Scotiabank Inverlat S.A., Institución de Banca Múltiple, Grupo Financiero Scotiabank Inverlat, Scotia Inverlat Casa de Bolsa, S.A. de C.V., Grupo Financiero Scotiabank Inverlat, Scotia Inverlat Derivados S.A. de C.V. – all members of the Scotiabank group and authorized users of the Scotiabank mark. The Bank of Nova Scotia is incorporated in Canada with limited liability and is authorised and regulated by the Office of the Superintendent of Financial Institutions Canada. The Bank of Nova Scotia is authorized by the UK Prudential Regulation Authority and is subject to regulation by the UK Financial Conduct Authority and limited regulation by the UK Prudential Regulation Authority. Details about the extent of The Bank of Nova Scotia's regulation by the UK Prudential Regulation Authority are available from us on request. Scotiabank Europe plc is authorized by the UK Prudential Regulation Authority and regulated by the UK Financial Conduct Authority and the UK Prudential Regulation Authority.
Scotiabank Inverlat, S.A., Scotia Inverlat Casa de Bolsa, S.A. de C.V, Grupo Financiero Scotiabank Inverlat, and Scotia Inverlat Derivados, S.A. de C.V., are each authorized and regulated by the Mexican financial authorities.
Not all products and services are offered in all jurisdictions. Services described are available in jurisdictions where permitted by law.