- Underlying inflation climbed to 5½% m/m SAAR
- Price increases are marked by high breadth
- The BoC’s preferred measures are not being driven by gas, mortgage interest
- The BoC is unlikely to be done raising its policy rate
- Canadian CPI m/m % NSA / y/y %, August:
- Actual: 0.4 / 4.0
- Scotia: 0.4 / 4.0
- Consensus: 0.2 / 3.8
- Prior: 0.6 / 3.3
- Trimmed mean CPI: 3.9 (3.6 prior)
- Weighted median CPI: 4.1 (3.9 prior revised up from 3.7)
Inflation’s cooling, they say. It’s only gasoline and mortgage interest costs that are driving it, they say. The government’s (rather unclear) ‘plan’ is working, they say. The Bank of Canada is obviously done raising rates, they say.
All of which is complete, utter, rubbish.
Another ripping inflation report put an exclamation point behind rebutting each of these claims. The Bank of Canada has a severe credibility problem on its hands amid the high risk that further tightening may yet be required. I’ll come back to this later in the note.
First the numbers and details and then I’ll offer BoC opinions.
DETAILS SHOW BROADLY BASED AND ACCELERATING PRESSURES
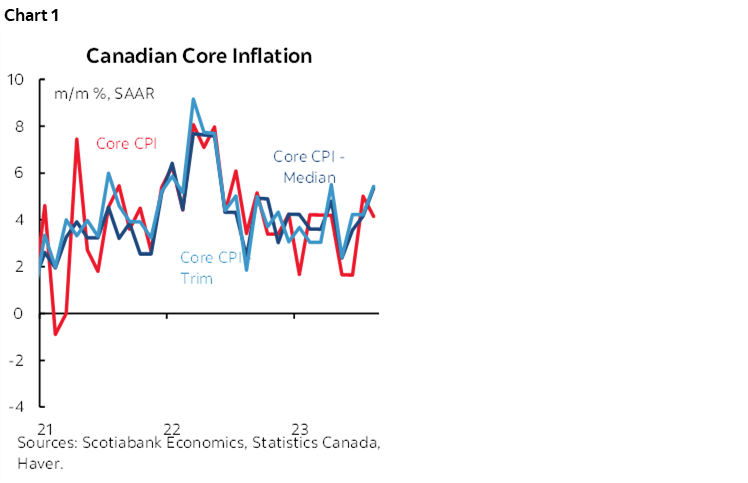
Key here is that the higher frequency evidence of underlying inflationary pressures continued to take off last month particularly in terms of the BoC’s most preferred measures (chart 1). Weighted median and trimmed mean CPI both accelerated to 5.4% m/m at a seasonally adjusted and annualized rate. That took the three-month moving averages up to 4.4% m/m SAAR for weighted median (from 3.4%) and 4.6% for trimmed mean (from 3.6%). Even traditional, simple core (ex-food and energy) accelerated to 4.1% m/m SAAR.
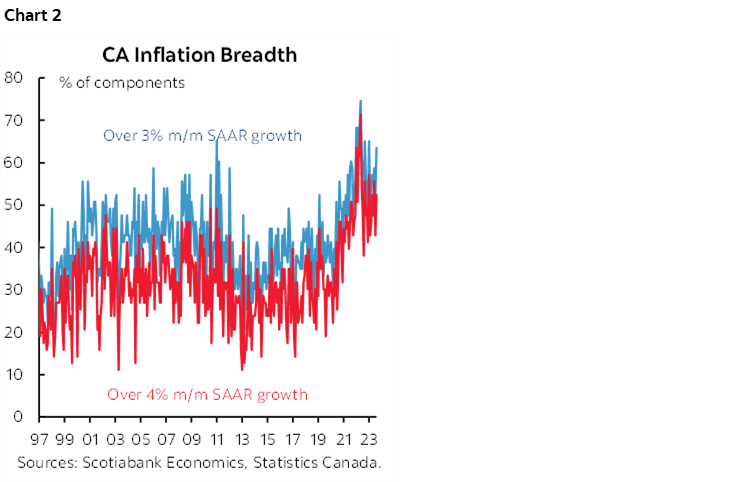
The breadth of the price pressures is astounding and it picked up in August. 52% of the CPI basket is up by 4% m/m SAAR or more (from 43% prior) and 64% is up by 3% or more (from 52% prior). See chart 2. The breadth of gains is stuck at high altitudes.
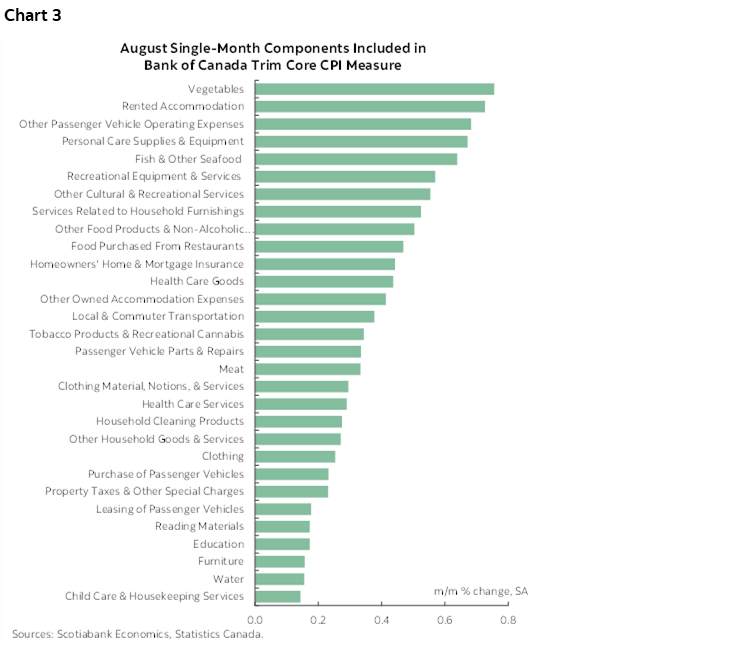
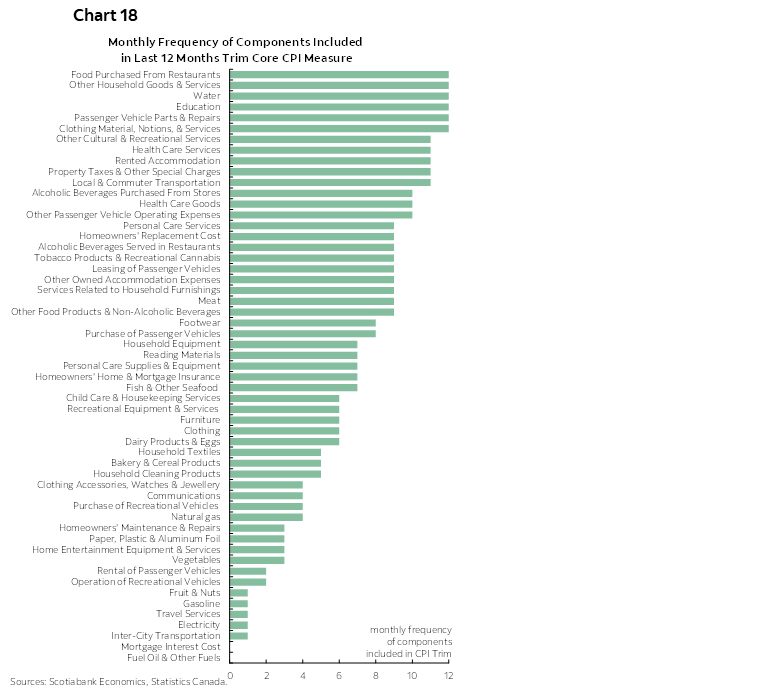
This underlying core inflation is not being driven by gasoline and mortgage interest costs. Gasoline has appeared in the trimmed mean measure of CPI only once in the past twelve monthly baskets that go into the compounded y/y rate and was excluded from the measure in the latest month. Mortgage interest expense has been excluded from the trimmed mean CPI basket for fifteen straight months including this latest one. Chart 3 shows what was included in the trimmed mean basket for just the month of August.
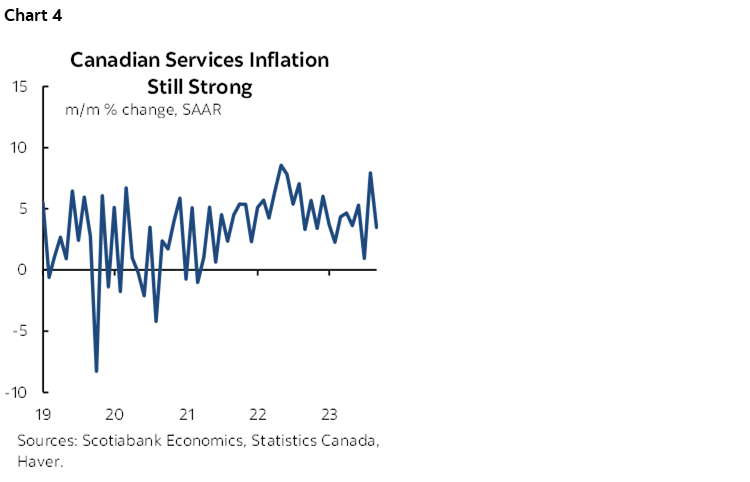
Services inflation remains hot but not as hot as in July (chart 4). After rising by 7.9% m/m SAAR in July it was up by another 3.5% m/m SAAR in August which was stronger than might have been expected given the magnitude of the prior month’s rise. Obviously this services inflation has nothing directly to do with supply chains affecting underlying goods inflation such as strikes.
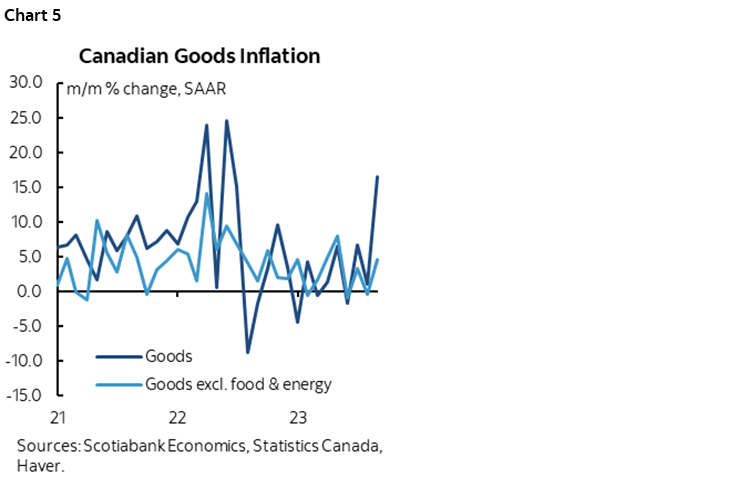
Goods inflation soared to 16.4% m/m SAAR in August from +1% in July. Core goods CPI —excluding food and energy— was up by 4.6% m/m SAAR from a dip of –0.4% in July (chart 5).
Why did core goods inflation pick up so much? This point will be debated among economists and it is unlikely there will be agreement toward any one silver bullet explanation.
- It’s possible that underlying supply and demand pressures are still acutely pointed toward driving higher core goods prices.
- It’s possible that the BC port strike and ongoing wildfire effects impaired product availability and so prices served a rationing role.
- It’s possible that August—being a typical point at which summer offerings give way to Fall at retailers across multiple product lines in Canada—saw greater than usual seasonal effects in rolling out these new products. As a case in point, go to a major retailer and notice the Christmas decorations and snowblowers that have been on the floor for weeks and with this seasonal rollover we’re getting price hikes that are reflecting lagging price pressures since the prior season. The gains may be seasonally unusual, in other words.
- It’s also possible that we’re paying the lagging price for chronic C$ weakness on imported price pressures.
- There could be ongoing passthrough of a lot of pressures from energy to wages that is posing second– round effects and beyond.
- It’s additionally possible that lagging effects of surging immigration are driving prices higher since some of the first things one does upon arrival is to a) find shelter, and b) buy things to go in your home.
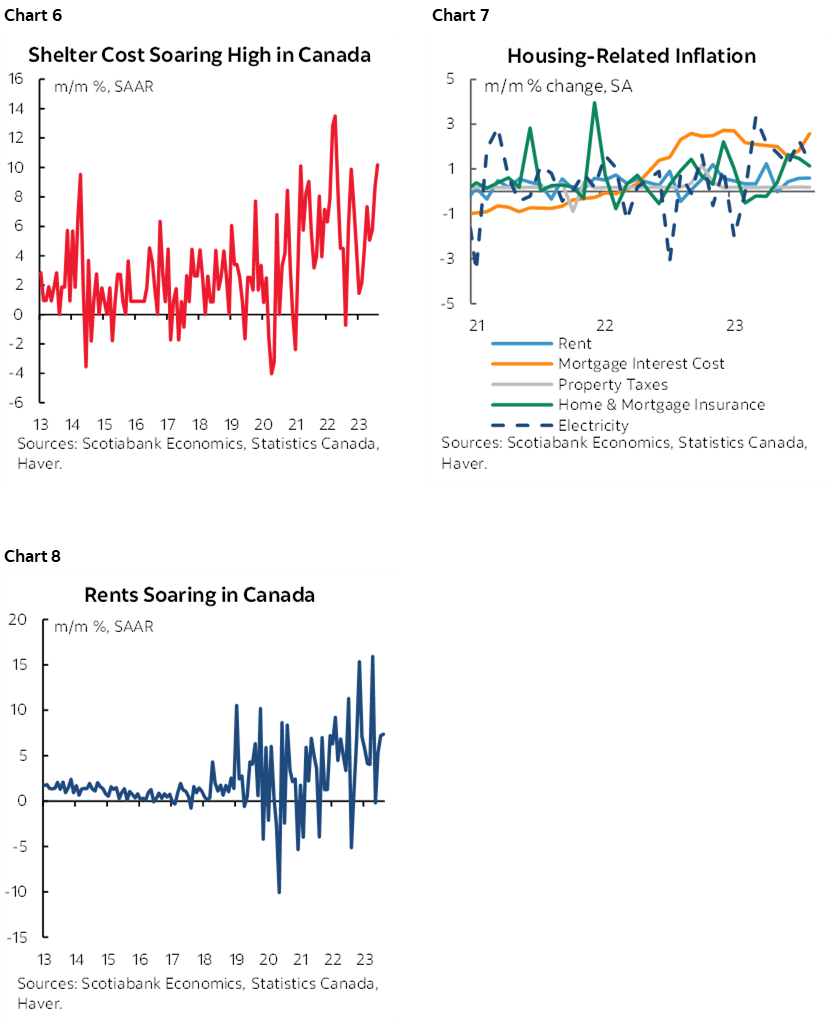
Indeed, shelter inflation is intense. Chart 6 shows total shelter cost at 10% m/m SAAR as the all-in measure of shelter costs is very hot. Home energy costs were a major driver with natural gas up 1.6% m/m SA and fuel oil up 11.3% m/m SA, both nonannualized. Chart 7 shows that there are multiple drivers of this pressure from rent (chart 8) to mortgage interest (that is excluded from the core gauges), to electricity prices.
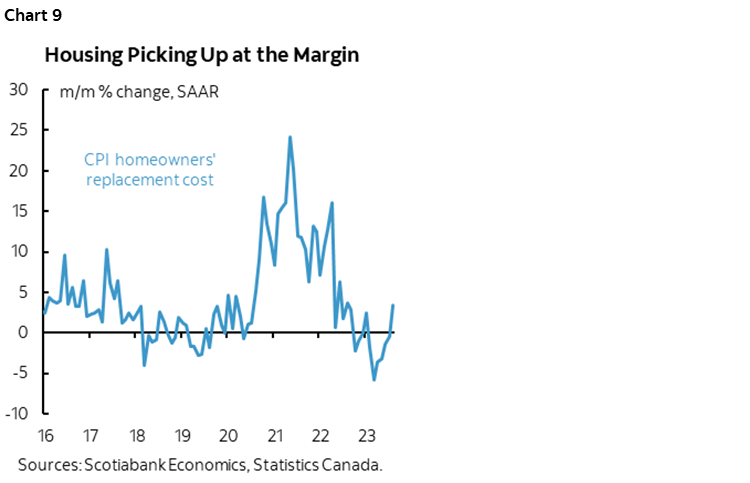
Housing’s direct contributions to CPI also appear to be at an inflection point. Recall that Canada captures housing using the house-only component of builder prices (ie: ex-land) which drives homeowners’ replacement cost (chart 9). From prior declines, the builder segment has swung toward pushing through higher prices. They have pricing power in an environment in which the housing stock must expand in order to meet the needs of rapidly rising immigration and they are unlikely to be able to come anywhere close to keeping up.
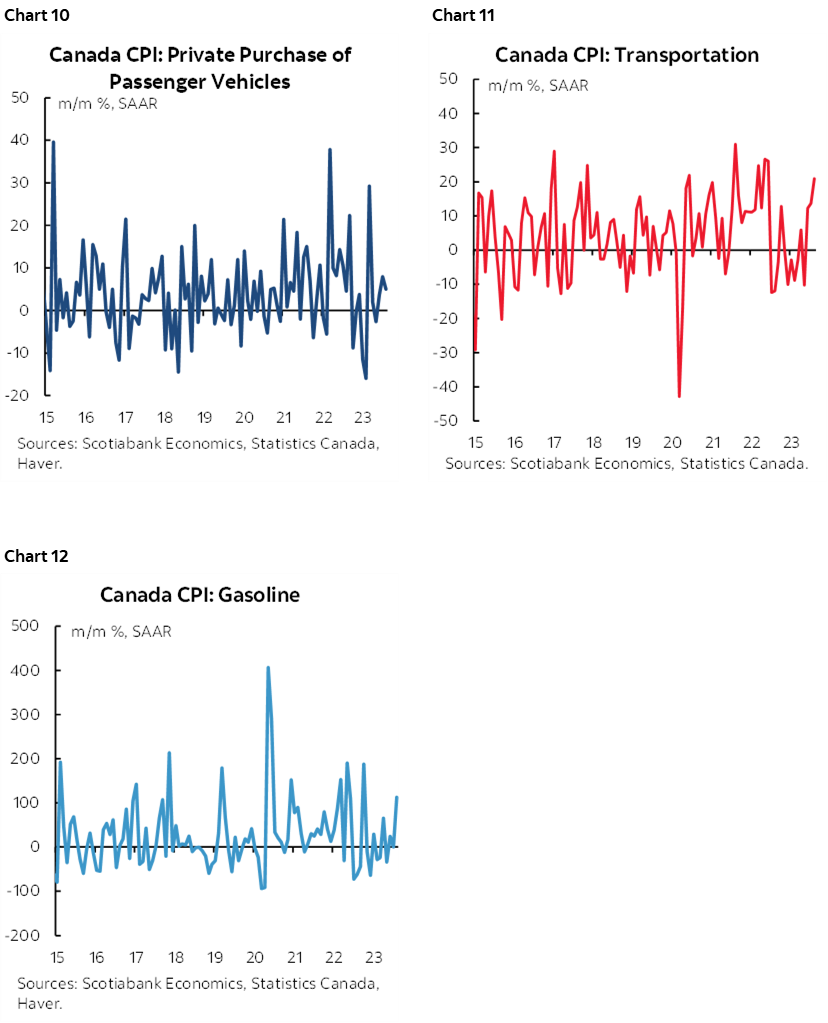
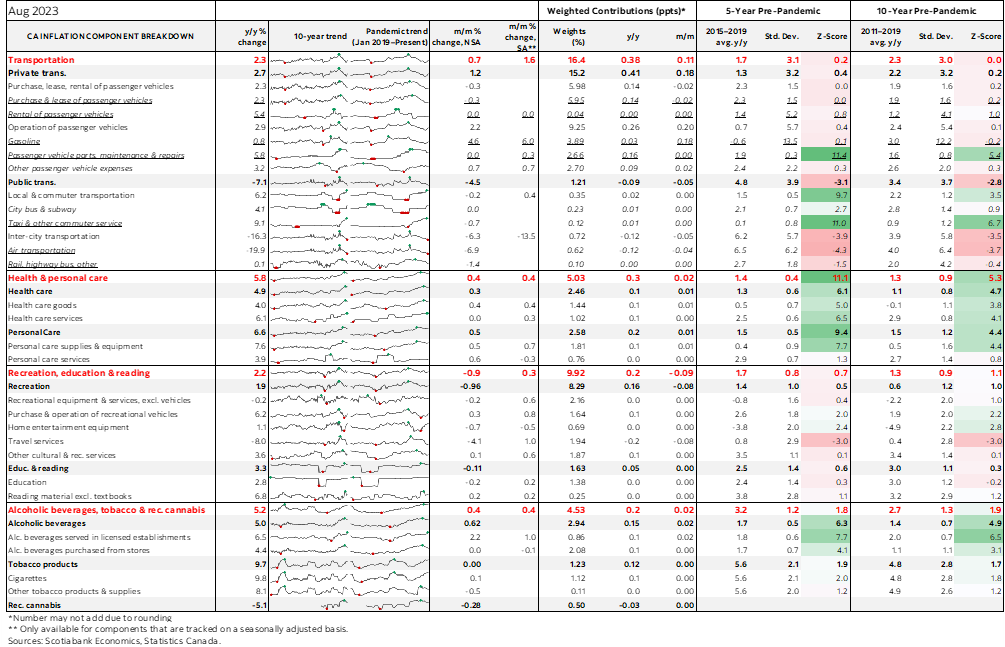
Auto prices also accelerated and may be reflecting greater than normal seasonal influences reflecting lagging cost pressures since prior new model years (chart 10). That drove transportation CPI sharply higher (chart 11) as gasoline prices took off (chart 12).
Food price inflation remains much cooler than prior peaks (chart 13). Ottawa’s assault on grocers is not only bas public policy, it is also poorly timed. There are many other drivers of inflation they should be focused upon and several of them are being driven by public policy in the present and long in the making.

Charts 14 and 15 show the breakdown of the y/y changes in prices in unweighted and weighted contribution terms respectively. Charts 16 and 17 do likewise for m/m price changes.
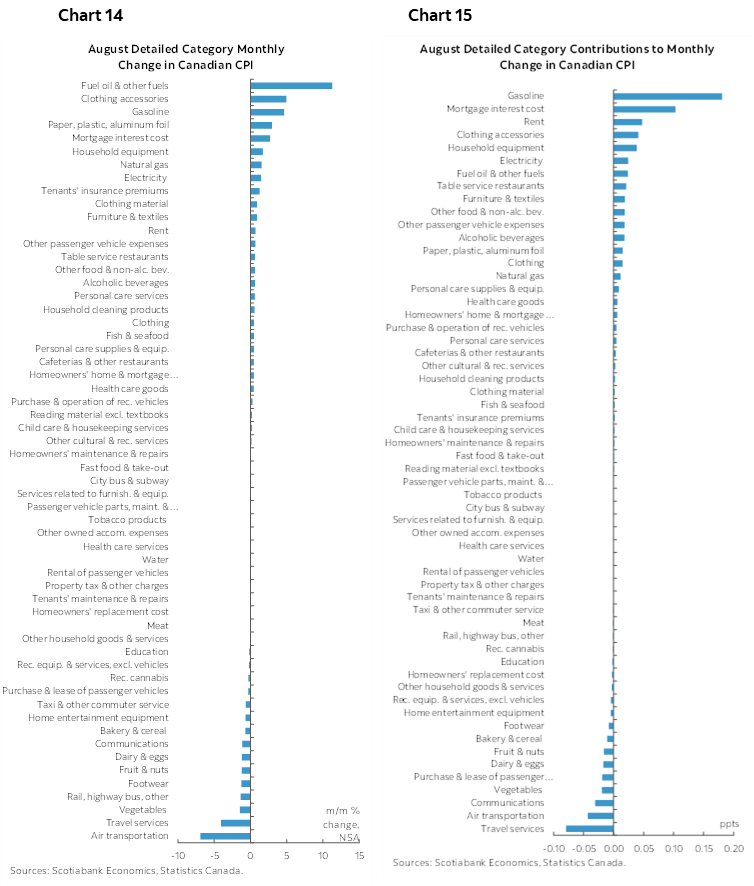
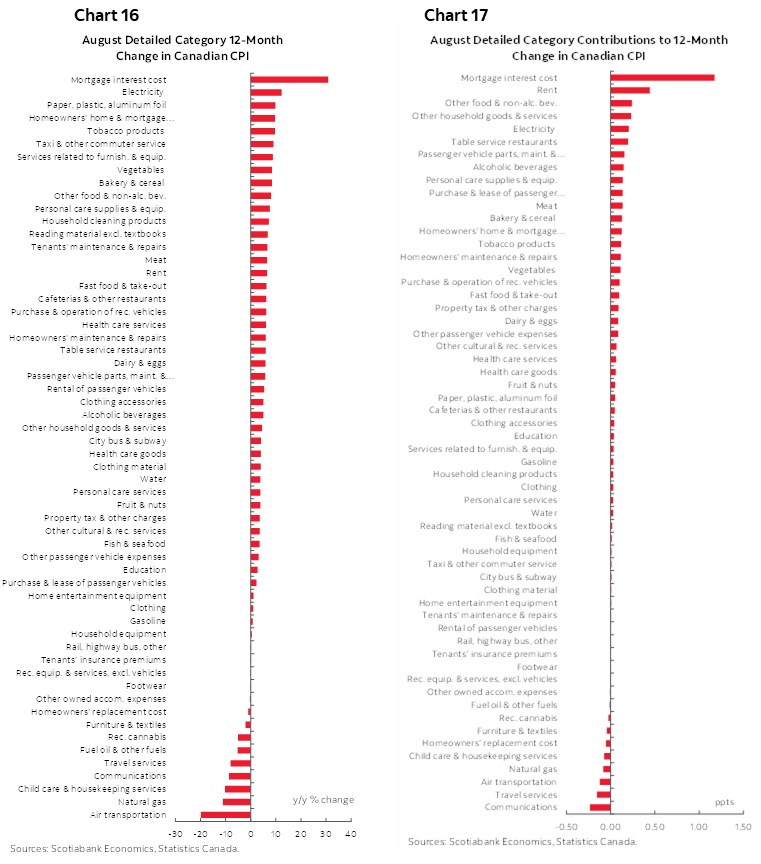
Chart 18 shows the frequency by which various components have been included in the trimmed mean measure of CPI inflation to further emphasize the point about how mortgage interest has never been included and gasoline has only been included once in the past twelve months and not this month.
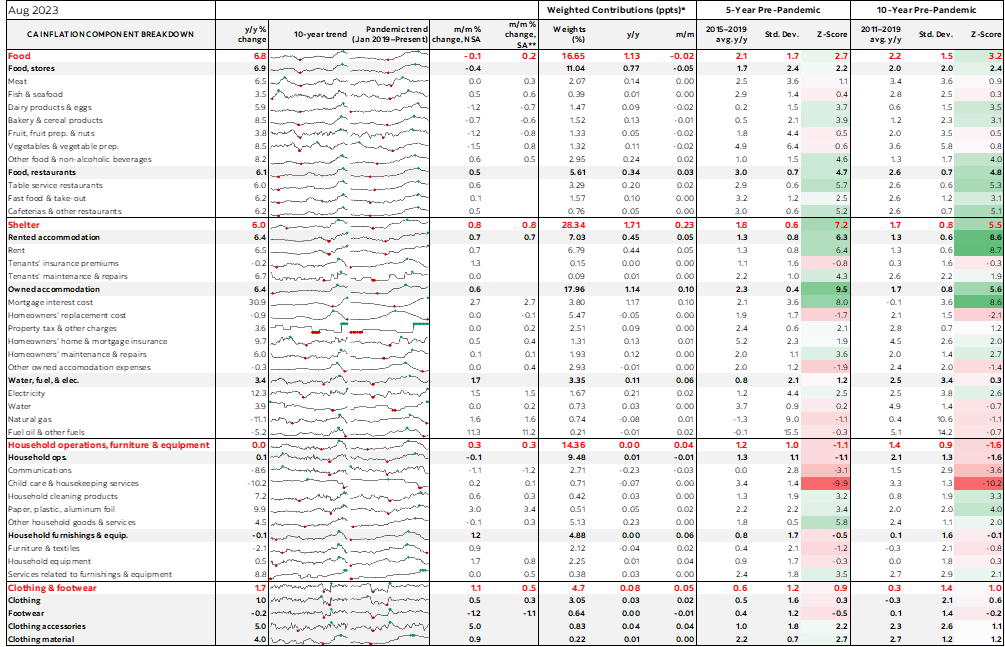
Please also see the accompanying detailed table that further breaks down the CPI basket including micro charts and z-score measures of price changes relative to history.
BANK OF CANADA NOT DONE YET
So what do you do if you are Governor Macklem?
Pending further data, this definitely ups the odds of a rate hike at the October meeting. Barring major developments by then I would forecast a hike but I don’t want to pre-commit to that view just yet given that there is a lot of ground to cover between now and the decision on October 25th. We’ll get another CPI inflation report plus another batch of data on jobs and wages and another round of BoC’s surveys of consumers and businesses including measures of inflation expectations. Other domestic data and developments plus external influences will also be considered.
But if the BoC had to make a decision today, then I would say hike. A counter to this is to ride out the lagging effects which is an argument that I’ve never bought in this cycle, nor have I believed the narrative that inflation is transitory versus a multi-year structural issue. Riding out policy lags is a luxury drawn from past cycles when the wages and prices complex was not adjusting in such rapid fashion and feeding upon itself. Riding out lags and counting upon forward guidance to be high for longer is another luxury drawn from an era before the credibility of providing longer-term forward guidance became thoroughly destroyed by broken promises not to raise rates for years. It is unsuited to today’s circumstances.
In today’s climate, surging inflation has very clearly unmoored inflation expectations as evidenced by those same BoC surveys that have consumers and businesses saying they think inflation will ride over 3% y/y throughout the years ahead. Surveying for the latest surveys is now over.
It’s also evident in wage setting exercises. Canada is different from the US with a 30% unionization rate that is triple that of the US. Collective bargaining has a similar influence upon Canada as in Europe and this is posing second-round inflationary pressures. We see that in average hourly wages that are up by 10–11% m/m SAAR in each of the past couple of months. We see it in the wage settlements data and with further strike risk to wage pressures ahead. Also recall IMF research that shows that countries with higher unionization rates and full employment conditions are more likely to see collective bargaining settlements stamped across the rest of the labour market. Canada meets both criteria. This summer and Fall it’s civil servants, port workers, education sector employees, and auto workers among others. Next it’s everyone else.
The combination of no one believing in the 2% inflation target, accelerating wage gains, ongoing collective bargaining pressures and tumbling labour productivity continues to put out of sample pressures upon underlying inflation. Out of sample immigration pressures add to this.
It remains my personal view that the BoC should not view its job as complete and that the risk of further rate hikes remains high as it digs in against political pressure that is richly hypocritical in deflecting ownership of direct and indirect drivers of inflation. As governments prime the pump to offer more this Fall, the BoC has a job to do independent of political pressure and must do it to guard the reputation of Canadian markets and institutions. All of which conforms to my long held narrative that ultimately Canada faces greater inflation risk than the US due to idiosyncratic factors and therefore we cannot dismiss the possibility of multiple further hikes—and the pain that goes with them particularly for the most interest-sensitive and leveraged sectors.
DISCLAIMER
This report has been prepared by Scotiabank Economics as a resource for the clients of Scotiabank. Opinions, estimates and projections contained herein are our own as of the date hereof and are subject to change without notice. The information and opinions contained herein have been compiled or arrived at from sources believed reliable but no representation or warranty, express or implied, is made as to their accuracy or completeness. Neither Scotiabank nor any of its officers, directors, partners, employees or affiliates accepts any liability whatsoever for any direct or consequential loss arising from any use of this report or its contents.
These reports are provided to you for informational purposes only. This report is not, and is not constructed as, an offer to sell or solicitation of any offer to buy any financial instrument, nor shall this report be construed as an opinion as to whether you should enter into any swap or trading strategy involving a swap or any other transaction. The information contained in this report is not intended to be, and does not constitute, a recommendation of a swap or trading strategy involving a swap within the meaning of U.S. Commodity Futures Trading Commission Regulation 23.434 and Appendix A thereto. This material is not intended to be individually tailored to your needs or characteristics and should not be viewed as a “call to action” or suggestion that you enter into a swap or trading strategy involving a swap or any other transaction. Scotiabank may engage in transactions in a manner inconsistent with the views discussed this report and may have positions, or be in the process of acquiring or disposing of positions, referred to in this report.
Scotiabank, its affiliates and any of their respective officers, directors and employees may from time to time take positions in currencies, act as managers, co-managers or underwriters of a public offering or act as principals or agents, deal in, own or act as market makers or advisors, brokers or commercial and/or investment bankers in relation to securities or related derivatives. As a result of these actions, Scotiabank may receive remuneration. All Scotiabank products and services are subject to the terms of applicable agreements and local regulations. Officers, directors and employees of Scotiabank and its affiliates may serve as directors of corporations.
Any securities discussed in this report may not be suitable for all investors. Scotiabank recommends that investors independently evaluate any issuer and security discussed in this report, and consult with any advisors they deem necessary prior to making any investment.
This report and all information, opinions and conclusions contained in it are protected by copyright. This information may not be reproduced without the prior express written consent of Scotiabank.
™ Trademark of The Bank of Nova Scotia. Used under license, where applicable.
Scotiabank, together with “Global Banking and Markets”, is a marketing name for the global corporate and investment banking and capital markets businesses of The Bank of Nova Scotia and certain of its affiliates in the countries where they operate, including; Scotiabank Europe plc; Scotiabank (Ireland) Designated Activity Company; Scotiabank Inverlat S.A., Institución de Banca Múltiple, Grupo Financiero Scotiabank Inverlat, Scotia Inverlat Casa de Bolsa, S.A. de C.V., Grupo Financiero Scotiabank Inverlat, Scotia Inverlat Derivados S.A. de C.V. – all members of the Scotiabank group and authorized users of the Scotiabank mark. The Bank of Nova Scotia is incorporated in Canada with limited liability and is authorised and regulated by the Office of the Superintendent of Financial Institutions Canada. The Bank of Nova Scotia is authorized by the UK Prudential Regulation Authority and is subject to regulation by the UK Financial Conduct Authority and limited regulation by the UK Prudential Regulation Authority. Details about the extent of The Bank of Nova Scotia's regulation by the UK Prudential Regulation Authority are available from us on request. Scotiabank Europe plc is authorized by the UK Prudential Regulation Authority and regulated by the UK Financial Conduct Authority and the UK Prudential Regulation Authority.
Scotiabank Inverlat, S.A., Scotia Inverlat Casa de Bolsa, S.A. de C.V, Grupo Financiero Scotiabank Inverlat, and Scotia Inverlat Derivados, S.A. de C.V., are each authorized and regulated by the Mexican financial authorities.
Not all products and services are offered in all jurisdictions. Services described are available in jurisdictions where permitted by law.