- Positive revisions spared a technical recession…
- ...as Q2 GDP was revised up, Q3 contracted, and Q4 is tracking positively
- Final domestic demand continues to grow unabated
- Canada’s economy is in better shape than GDP indicates…
- ...upon controlling for a unique array of temporary drags
- Early BoC cut pricing is too aggressive
- Canada GDP, q/q % SAAR, Q3:
- Actual: -1.1
- Scotia: +0.4
- Consensus: +0.1
- Prior: +1.4 (revised up from –0.2)
- Canada GDP, m/m % SA, September:
- Actual: 0.1
- Scotia: 0.0
- Consensus: 0.0
- Prior: 0.0
- October preliminary GDP estimate: +0.2% m/m
Recession, huh? Not so fast. The economy was better than previously reported in Q2, shrank in Q3 but details were better under the hood, and Q4 is tracking positive growth.
What’s more, pricing a chance at rate cuts as soon as very slim odds for next week or January is drop dead nuts with even March/April pricing looking too rich in my view. Sometimes when the market delivers a smoking grapefruit down the middle of the plate, perhaps one should swing!
NO RECESSION TO SEE HERE
Canada’s economy dodged a bullet by putting up better (not great) numbers and better details than feared especially upon controlling for temporary factors. The economy is not in recession as some folks across the street have been claiming. The recessionistas have some explaining to do and the Bank of Canada won’t see enough in here to guide easing any time soon.
As a result of the Canadian data and the firm US core PCE print of 0.2% m/m SA (with generous rounding up), Canada’s yield curve sold off in abrupt fashion. Canada 2s went from slight richening with the yield down by about 2bps before the data to then selling off by 8bps. CAD swung from mild depreciation to the USD pre-data to mild appreciation and as the only currency holding its own against broad USD strength versus other global crosses this morning.
DETAILS BETTER THAN HEADLINES
GDP did unexpectedly contract in Q3 by 1.1% q/q SAAR but there are several strong cautions here.
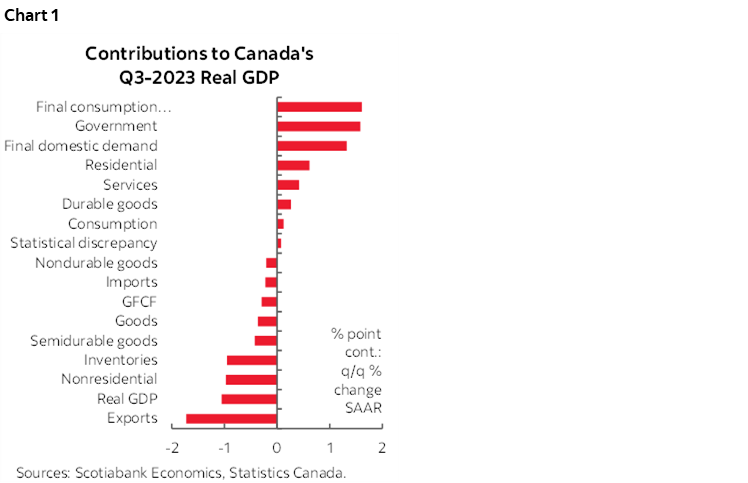
1. The composition of the weakness in Q3 GDP points to better details (chart 1). Housing, government spending and private consumption all made modest contributions to growth. Furthermore, inventories dragged a full percentage point off of growth and careful inventory management at this point in the cycle is not a bad thing. It’s actually prudent of companies such that if the economy disappoints, they won’t have as much inventory to store and finance as they would have otherwise, but if the economy is resilient then perhaps they’ll have to re-stock. I’ll return to some of the monthly GDP distortions in the next section.
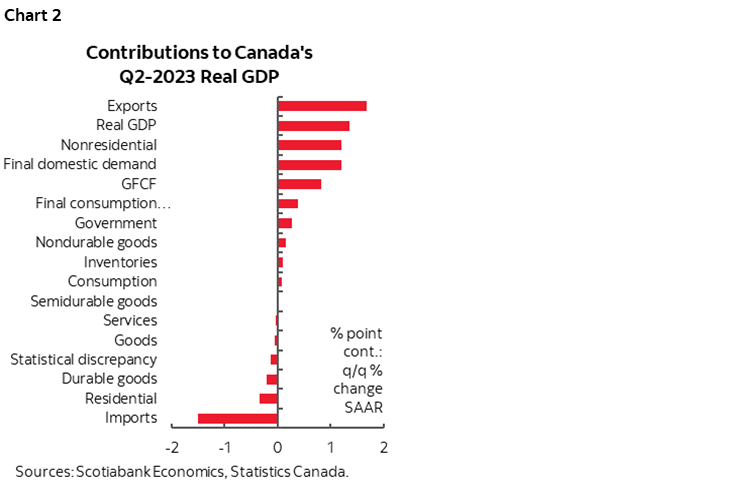
2. That Q3 contraction was significantly due to an upward revision to Q2 growth that is now pegged at +1.4% q/q SAAR versus the earlier –0.2% estimate. A +1.6 ppt swing in estimated Q2 GDP growth posed a higher jumping off point that made it more difficult to post expected growth in Q3. The upward revision to Q2 was mainly due to revisions to exports and inventories. Chart 2 shows the contributions to Q2 GDP growth on a weighted basis.
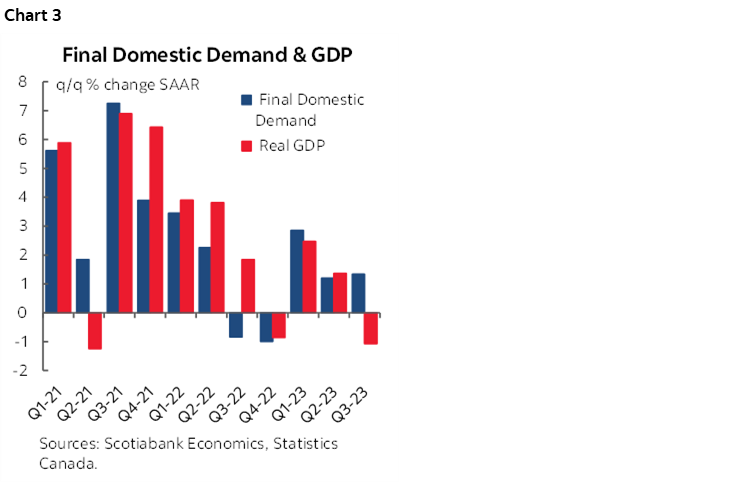
3. Final domestic demand continues to grow (chart 3). It was up by 1.3% q/q SAAR in Q3 after a 1.2% rise in Q2. This measure captures consumption plus investment plus government spending and therefore excludes net exports and inventories. It is a cleaner barometer of domestic economic activity and I would expect the BoC to flag its continued growth as an offset to the GDP numbers in their statement next week. FDD is among the things I watch beneath GDP numbers for signs of a genuine downturn in the domestic economy and that’s not happening here.
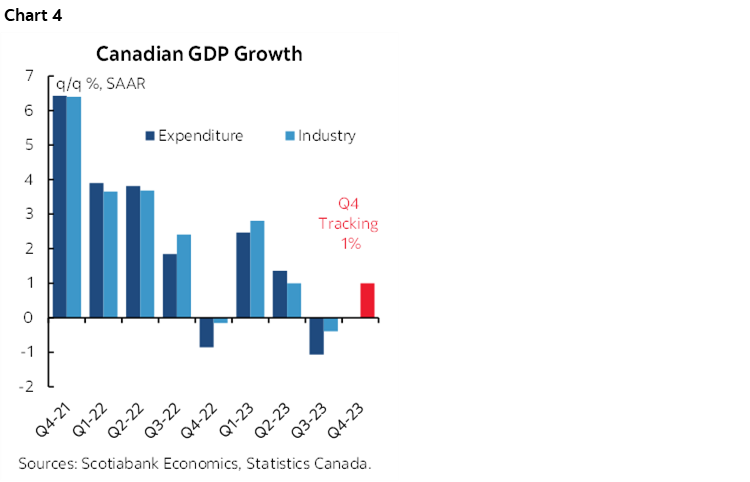
4. Early tracking for Q4 growth using the monthly GDP accounts points to about 1% q/q SAAR growth based solely upon the Q3 average level of monthly GDP and October GDP while assuming November and December will be flat solely for the purpose of focusing the math upon known factors to date. Chart 4.
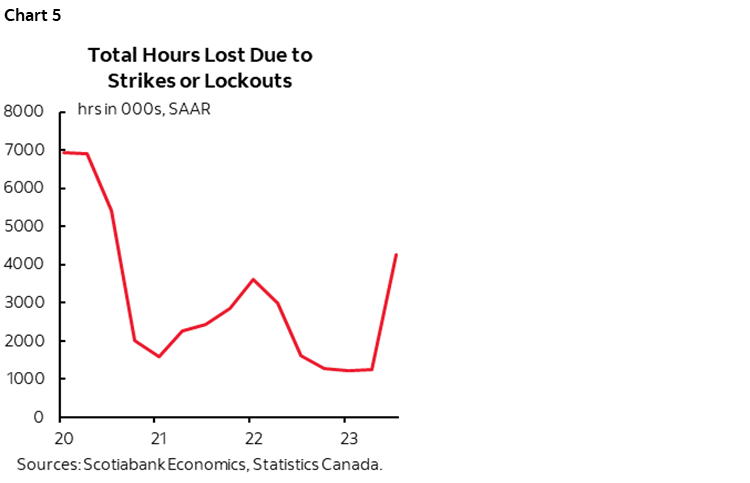
5. I still believe that the economy is stronger than is being guided upon controlling for some temporary drags on growth. One is that half the country was literally on fire over the summer and those wildfires disrupted a broad cross-section of economic activity from shut mines and petrochemical facilities to agriculture, forestry and tourism under the warm glow of orange skies. Second is that hours worked got crushed in Q3 by the biggest amount since the economy was shut down at the start of the pandemic but this time because of hours of work lost due to strikes (chart 5). The half of the country that was not on fire was on strike. Workers across grocery chains, ports, governments, educational institutions, auto makers, airlines and—my personal fave—Montreal cemetery workers were all examples of strikes that crippled their sectors this summer. Folks on picket lines or at home picking something else are not producing goods and services and so since GDP is the sum total of all goods and services produced in the economy it was temporarily dampened by these strikes. This is a much bigger deal than in the US because about one-third of Canada’s workforce is unionized and going through collective bargaining exercises, versus about 10% of the US workforce that is unionized.
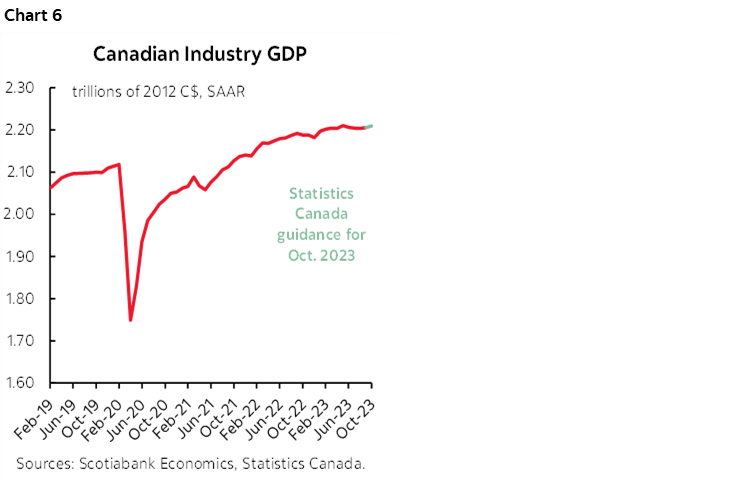
6. Last, as chart 6 shows, the amazing thing is that despite about 500bps of rate hikes, wildfires, drought, strikes aplenty and inventory swings, Canada’s economy is proving to be remarkably resilient thus far. I think that reflects a balanced take on the influences that are well beyond flapping around in circles over just mortgage resets and with sometimes outrageously faulty math to boot! Immigration is off the charts. There is a nationwide housing shortage with a need to expand the housing stock. Fiscal policy remains stimulative which adds to inflation risk but supports growth. Commodities are supporting the terms of trade including the OPEC+ shot in the arm given to oil prices this morning. Corporate balance sheets are strong with record high nonfinancial corporate sector interest coverage. Banks are well capitalized. Over 400k jobs have been created this year alongside ripping trend wage growth. CAD depreciation is the opposite of the Fed’s strong dollar challenge. Credit is tighter, but financial conditions are easing once again.
MONTHLY GDP SIGNALS GROWTH MOMENTUM AND ARTIFICIALLY DEPRESSED
Higher frequency monthly GDP indicates that growth is transitioning to Q4 in a positive way, albeit mildly so, tentatively, and distorted to the downside. September GDP was up 0.1% m/m and Statcan’s preliminary October estimate is +0.2% m/m. This gives tracking of about 1% q/q SAAR GDP growth in Q4.
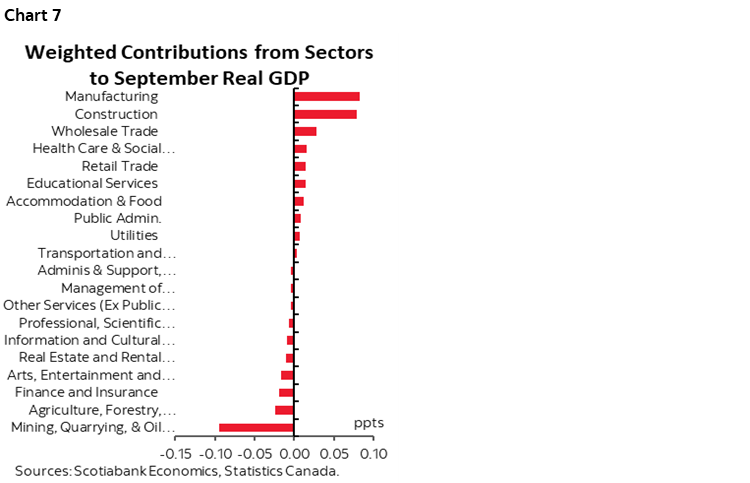
September’s details are better than the headline. Chart 7 shows the weighted contributions to growth and the positive role played by several sectors. The biggest drag came from mining/quarrying/oil/gas that fell 1.8% m/m and knocked about 0.1 ppts off of GDP and we should look through this effect while anticipating a rebound. Statcan pegged the reason for that being maintenance activities that drove oil and gas extraction ex-oil sands down 3.6% m/m due to “maintenance work at an oil platform off Canada’s Atlantic coast.” Oilsands output was also impacted by maintenance, but to a much smaller degree.
An added influence on September GDP that should be controlled for was a 2% drop in mining and quarrying that Statcan mostly blamed on lower unwrought gold exports to the UK and US. These flows bounce around erratically through the gold trade.
Drought also weighed upon agricultural sector GDP that fell 1.4% m/m in September. Statcan pinned that on lower crop yields for wheat and canola in particular. That’s a real drag not to be removed, but with probably short-lived effects.
As for October, Statcan does not release details with its preliminary estimate but does offer limited verbal guidance. They said that mining, quarrying, oil and gas extraction did indeed rebound, and joined growth in retail trade and construction to offset a decline in wholesale sector activity.
Overall, the amount of misinformation on Canada remains stunning. The economy is not in recession at least not to this point despite other claims to the contrary and we need to control for things beyond rate hike effects. In any event, soft trend growth is the goal of tighter monetary policy in order to bring inflation durably lower and so we should expect that, rather than thinking the BoC will get all wiggy at the first signs of softening. The BoC is not being fooled by its own rate hikes through mortgage interest’s effect on headline CPI because they focus upon trimmed mean and weighted median CPI that exclude mortgage interest. Yet it’s this sort of thinking is motivating early rate cut pricing. Now, onto jobs and wages tomorrow placed in the context of a very strong year to date for both.
DISCLAIMER
This report has been prepared by Scotiabank Economics as a resource for the clients of Scotiabank. Opinions, estimates and projections contained herein are our own as of the date hereof and are subject to change without notice. The information and opinions contained herein have been compiled or arrived at from sources believed reliable but no representation or warranty, express or implied, is made as to their accuracy or completeness. Neither Scotiabank nor any of its officers, directors, partners, employees or affiliates accepts any liability whatsoever for any direct or consequential loss arising from any use of this report or its contents.
These reports are provided to you for informational purposes only. This report is not, and is not constructed as, an offer to sell or solicitation of any offer to buy any financial instrument, nor shall this report be construed as an opinion as to whether you should enter into any swap or trading strategy involving a swap or any other transaction. The information contained in this report is not intended to be, and does not constitute, a recommendation of a swap or trading strategy involving a swap within the meaning of U.S. Commodity Futures Trading Commission Regulation 23.434 and Appendix A thereto. This material is not intended to be individually tailored to your needs or characteristics and should not be viewed as a “call to action” or suggestion that you enter into a swap or trading strategy involving a swap or any other transaction. Scotiabank may engage in transactions in a manner inconsistent with the views discussed this report and may have positions, or be in the process of acquiring or disposing of positions, referred to in this report.
Scotiabank, its affiliates and any of their respective officers, directors and employees may from time to time take positions in currencies, act as managers, co-managers or underwriters of a public offering or act as principals or agents, deal in, own or act as market makers or advisors, brokers or commercial and/or investment bankers in relation to securities or related derivatives. As a result of these actions, Scotiabank may receive remuneration. All Scotiabank products and services are subject to the terms of applicable agreements and local regulations. Officers, directors and employees of Scotiabank and its affiliates may serve as directors of corporations.
Any securities discussed in this report may not be suitable for all investors. Scotiabank recommends that investors independently evaluate any issuer and security discussed in this report, and consult with any advisors they deem necessary prior to making any investment.
This report and all information, opinions and conclusions contained in it are protected by copyright. This information may not be reproduced without the prior express written consent of Scotiabank.
™ Trademark of The Bank of Nova Scotia. Used under license, where applicable.
Scotiabank, together with “Global Banking and Markets”, is a marketing name for the global corporate and investment banking and capital markets businesses of The Bank of Nova Scotia and certain of its affiliates in the countries where they operate, including; Scotiabank Europe plc; Scotiabank (Ireland) Designated Activity Company; Scotiabank Inverlat S.A., Institución de Banca Múltiple, Grupo Financiero Scotiabank Inverlat, Scotia Inverlat Casa de Bolsa, S.A. de C.V., Grupo Financiero Scotiabank Inverlat, Scotia Inverlat Derivados S.A. de C.V. – all members of the Scotiabank group and authorized users of the Scotiabank mark. The Bank of Nova Scotia is incorporated in Canada with limited liability and is authorised and regulated by the Office of the Superintendent of Financial Institutions Canada. The Bank of Nova Scotia is authorized by the UK Prudential Regulation Authority and is subject to regulation by the UK Financial Conduct Authority and limited regulation by the UK Prudential Regulation Authority. Details about the extent of The Bank of Nova Scotia's regulation by the UK Prudential Regulation Authority are available from us on request. Scotiabank Europe plc is authorized by the UK Prudential Regulation Authority and regulated by the UK Financial Conduct Authority and the UK Prudential Regulation Authority.
Scotiabank Inverlat, S.A., Scotia Inverlat Casa de Bolsa, S.A. de C.V, Grupo Financiero Scotiabank Inverlat, and Scotia Inverlat Derivados, S.A. de C.V., are each authorized and regulated by the Mexican financial authorities.
Not all products and services are offered in all jurisdictions. Services described are available in jurisdictions where permitted by law.